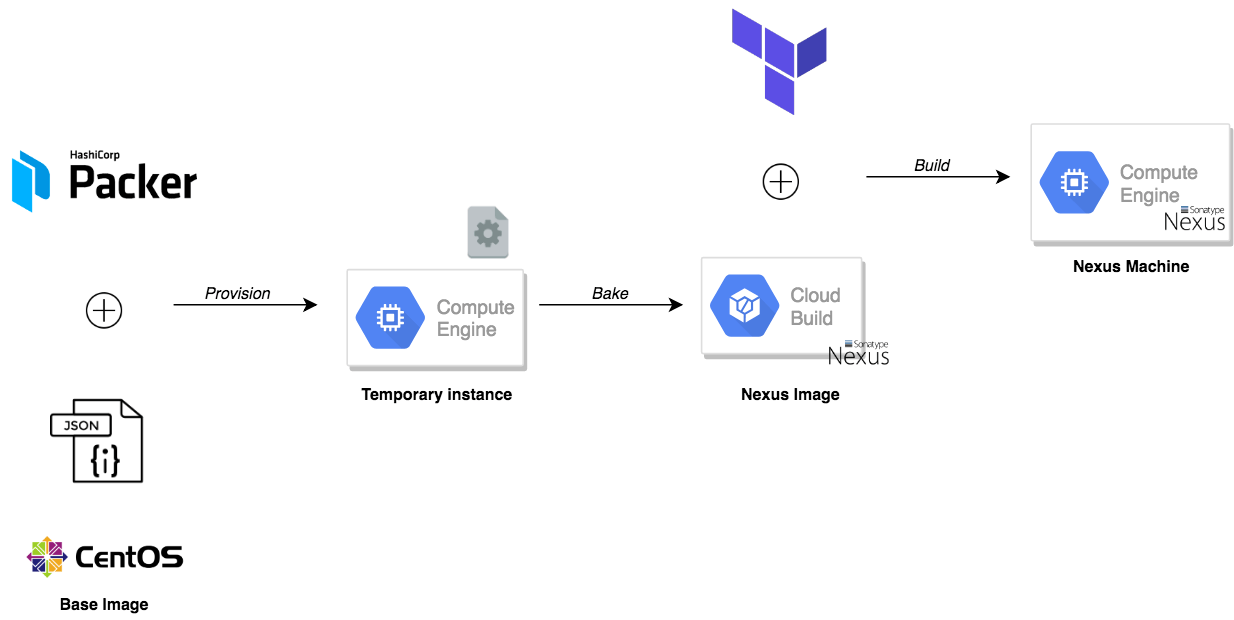
In this post, I will walk you through how to deploy Sonatype Nexus OSS 3 on Google Cloud Platform and how to create a private Docker hosted repository to store your Docker images and other build artifacts (maven, npm and pypi, etc). To achieve this, we need to bake our machine image using Packer to create a gold image with Nexus preinstalled and configured. Terraform will be used to deploy a Google compute instance based on the baked image. The following schema describes the build workflow:
PS : All the templates used in this tutorial, can be found on my GitHub.
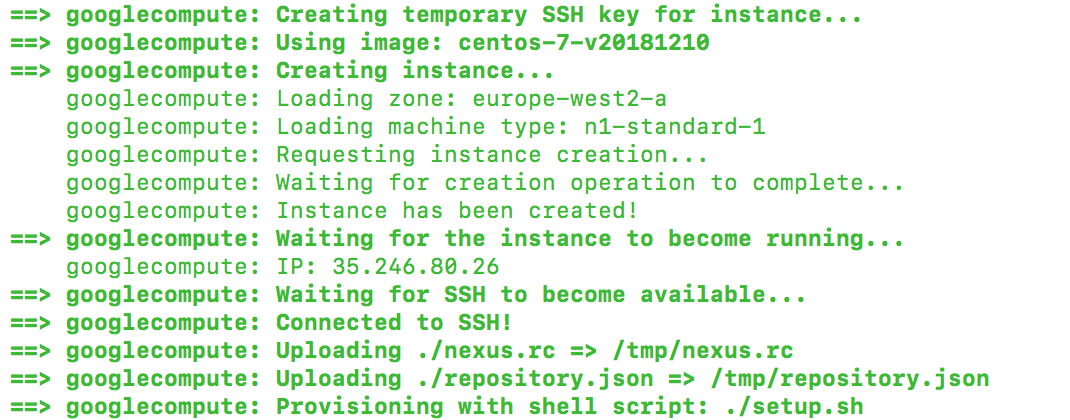
To get started, we need to create the machine image to be used with Google Compute Engine (GCE). Packer will create a temporary instance based on the CentOS image and use a shell script to provision the instance:
The shell script, will install the latest stable version of Nexus OSS based on their official documentation and wait for the service to be up and running, then it will use the Scripting API to post a groovy script:
Once the template files are defined, issue packer build command to bake our machine image:
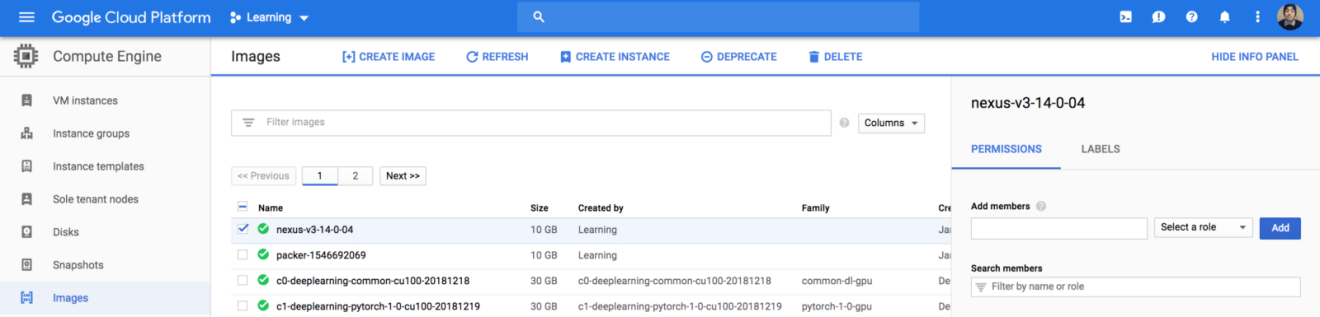
If you head back to Images section from Compute Engine dashboard, a new image called nexus should be created:
Now we are ready to deploy Nexus, we will create a Nexus server based on the machine image we baked with Packer. The template file is self-explanatory, it creates a set of firewall rules to allow inbound traffic on port 8081 (Nexus GUI) and 22 (SSH) from anywhere, and creates a google compute instance based on the Nexus image:
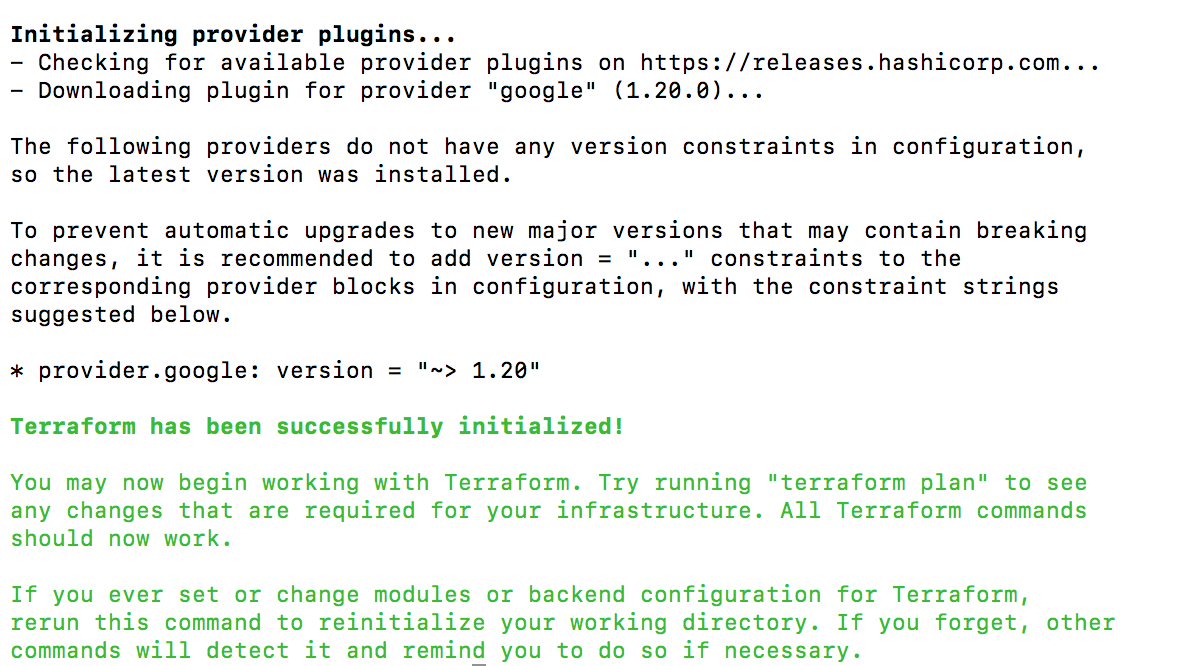
On the terminal, run the terraform init command to download and install the Google provider, shown as follows:
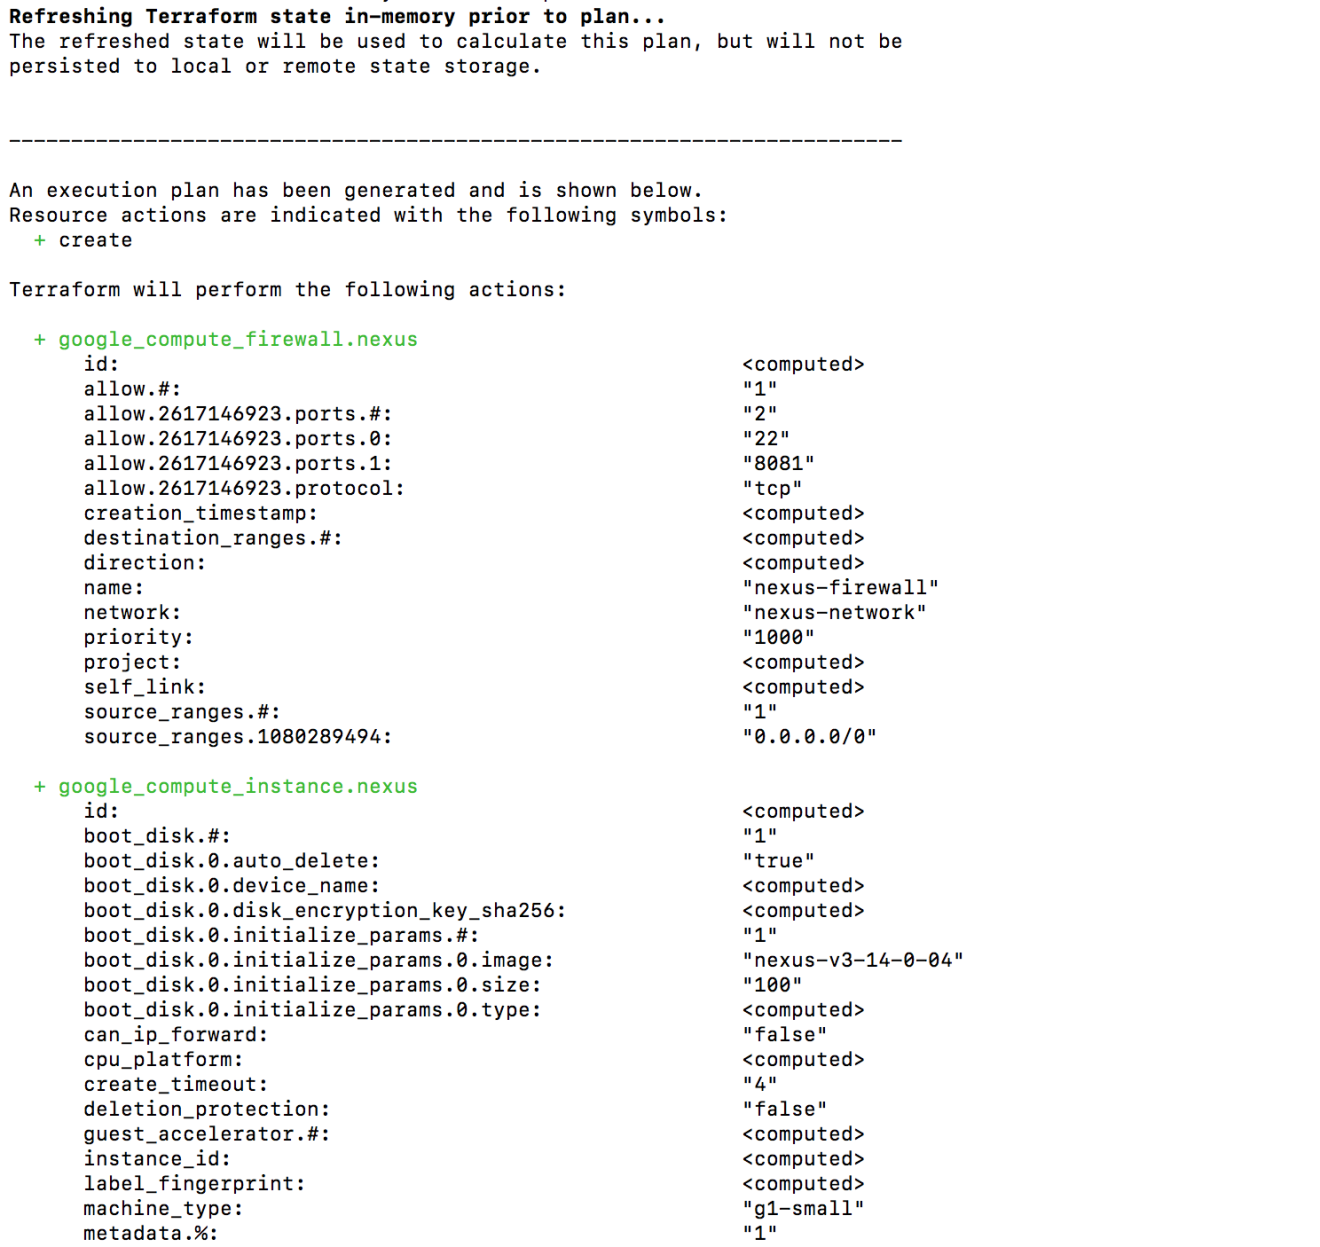
Create an execution plan (dry run) with the terraform plan command. It shows you things that will be created in advance, which is good for debugging and ensuring that you’re not doing anything wrong, as shown in the next screenshot:
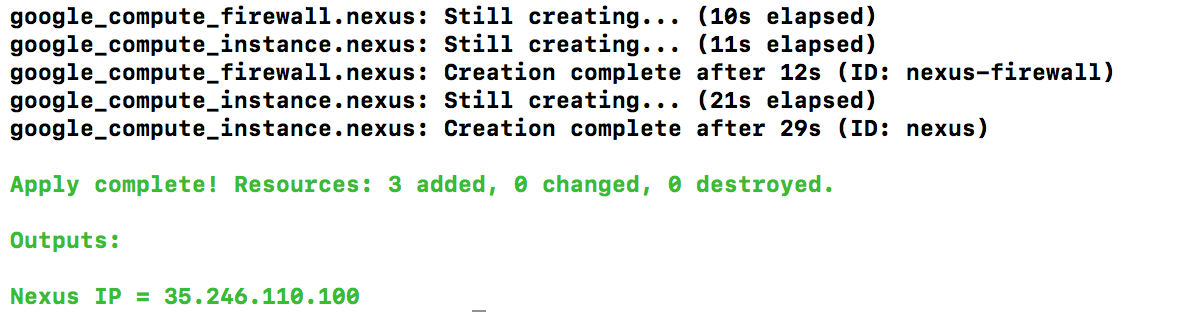
When you’re ready, go ahead and apply the changes by issuing terraform apply:
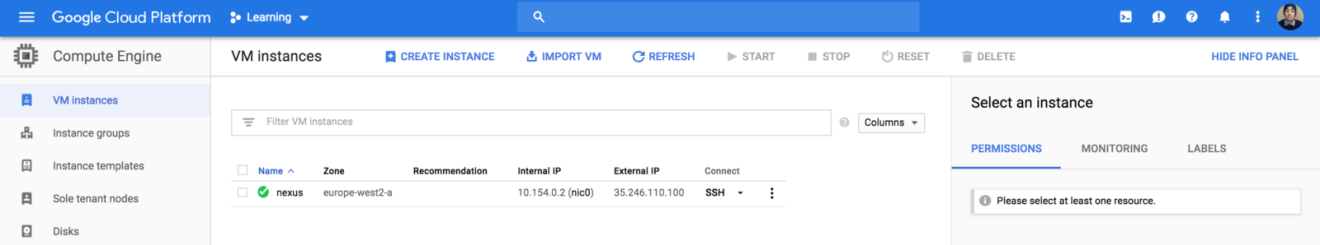
Terraform will create the needed resources and display the public ip address of the nexus instance on the output section. Jump back to GCP Console, your nexus instance should be created:
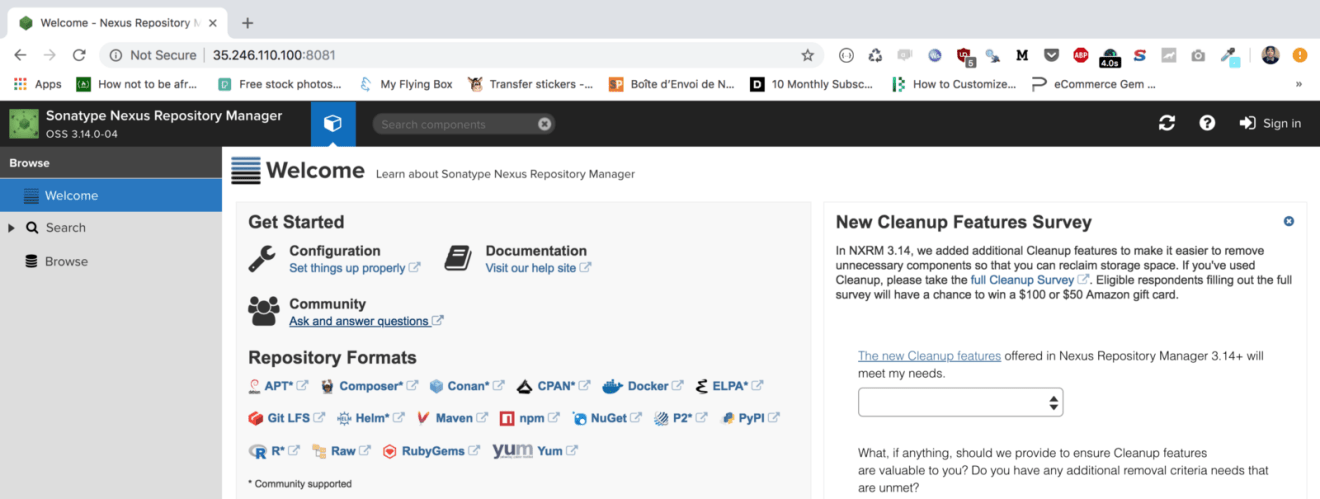
If you point your favorite browser to http://instance_ip:8081, you should see the Sonatype Nexus Repository Manager interface:
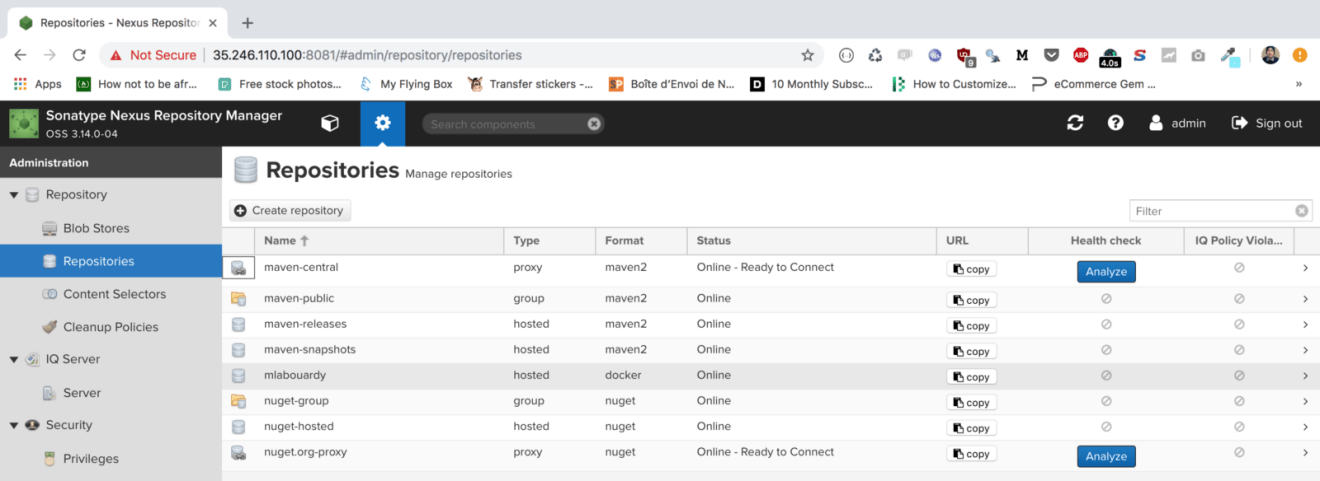
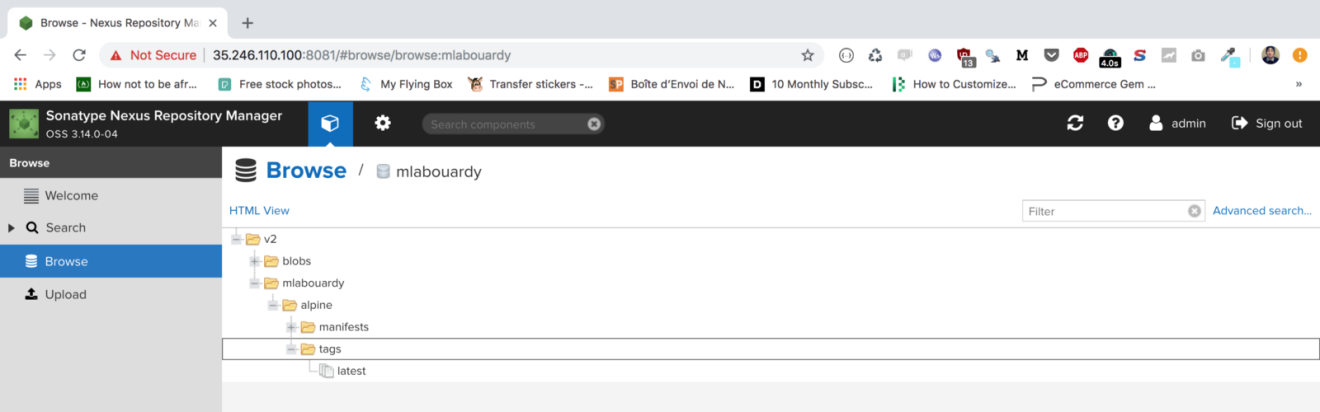
Click the “Sign in” button in the upper right corner and use the username “admin” and the password “admin123”. Then, click on the cogwheel to go to the server administration and configuration section. Navigate to “Repositories”, our private Docker repository should be created as follows:
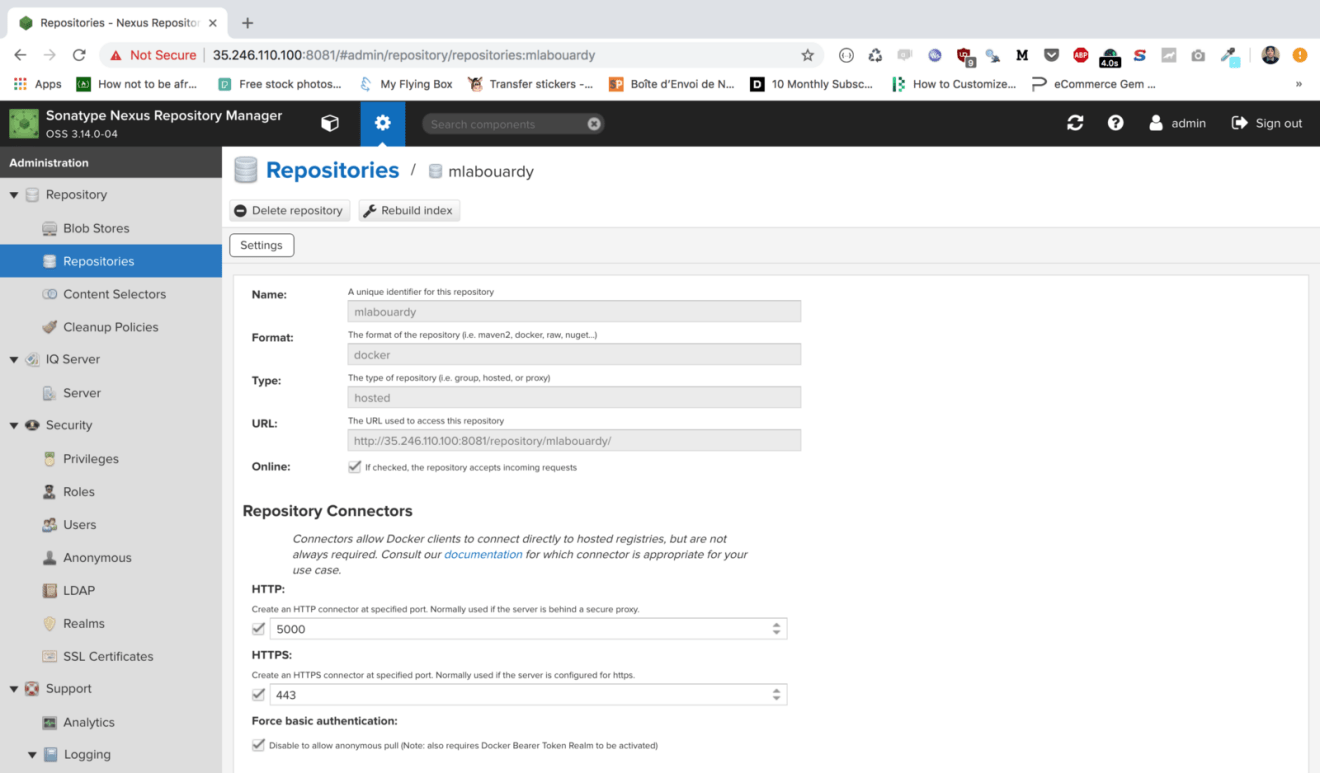
The docker repository is published as expected on port 5000:
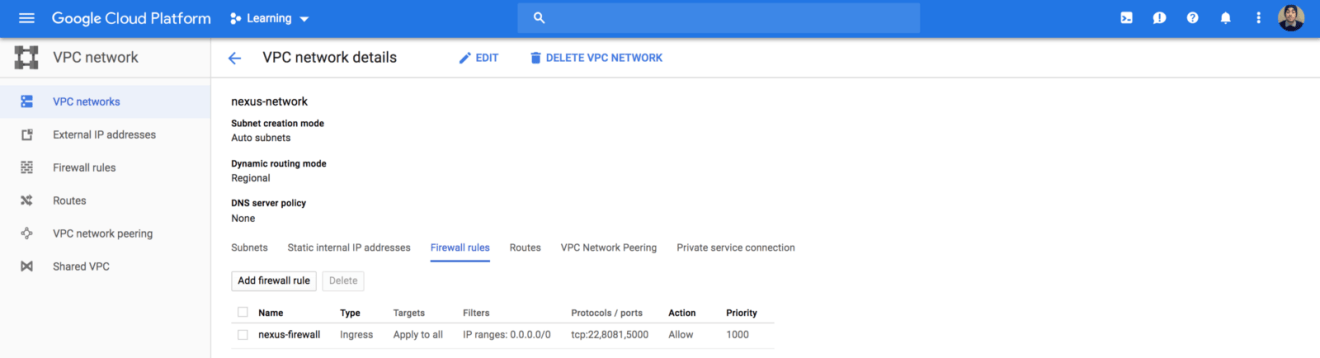
Hence, we need to allow inbound traffic on that port, so update the firewall rules accordingly:
1 2 3 4 5 6 7 8 9 10 11 12 13 14 15
resource "google_compute_firewall" "nexus" { name = "nexus-firewall" network = "${google_compute_network.nexus.name}"
resource "google_compute_network" "nexus" { name = "nexus-network" }
Issue terrafrom apply command to apply the changes:
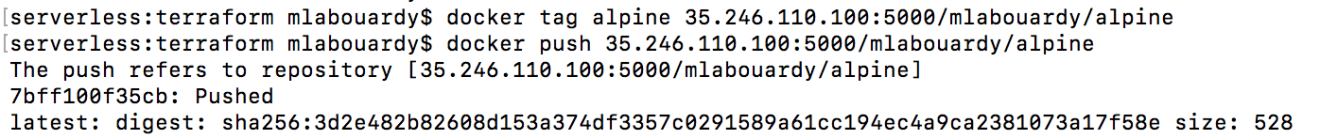
Your private docker registry is ready to work at instance_ip:5000, let’s test it by pushing a docker image.
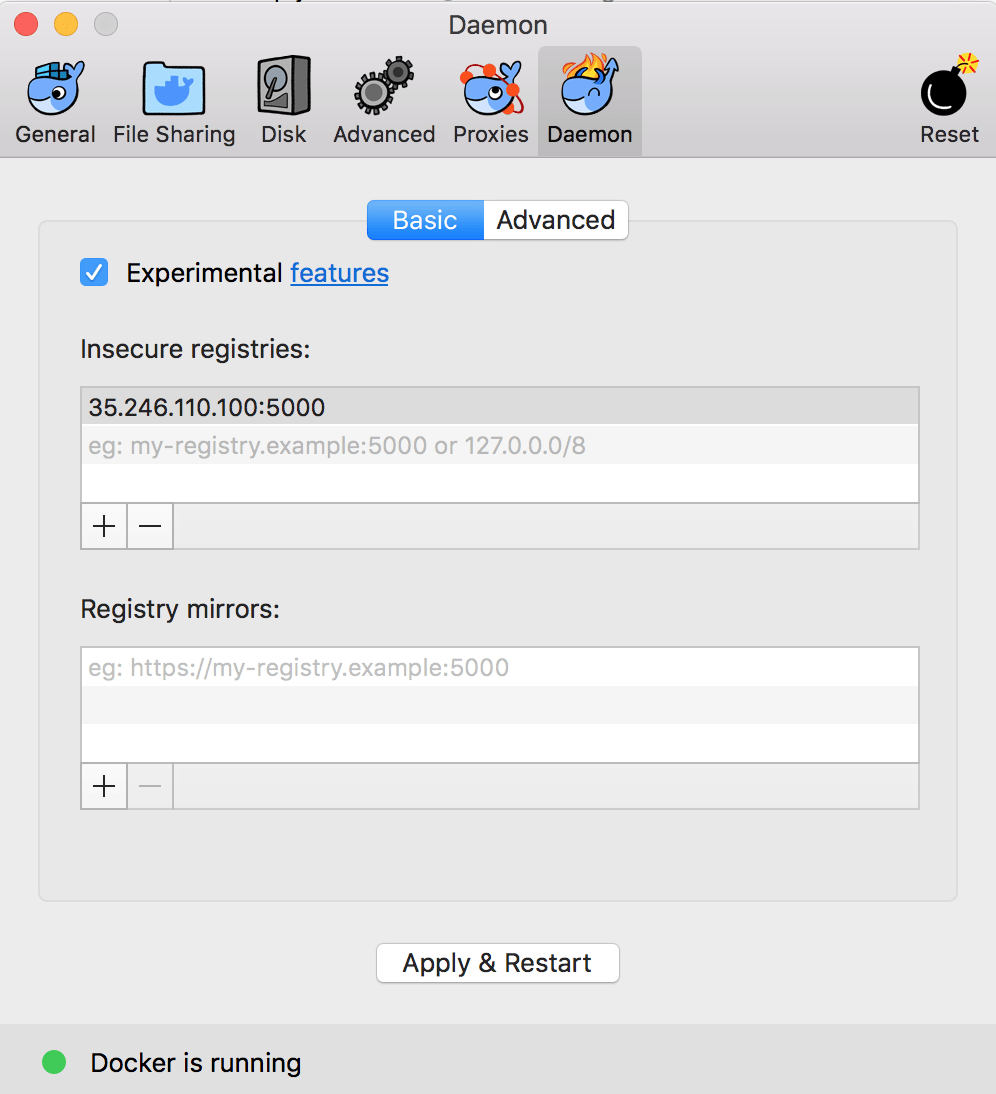
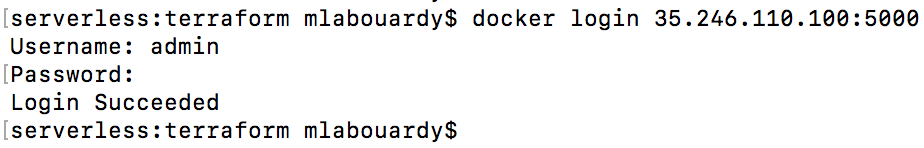
Since we have exposed the private Docker registry on a plain HTTP endpoint, we need to configure the Docker daemon that will act as client to the private Docker registry as to allow for insecure connections.
On Windows or Mac OS X: Click on the Docker icon in the tray to open Preferences. Click on the Daemon tab and add the IP address on which the Nexus GUI is exposed along with the port number 5000 in Insecure registries section. Don’t forget to Apply & Restart for the changes to take effect and you’re ready to go.
Kubernetes might be the ultimate choice when deploying heavy workloads on Google Cloud Platform. However, Docker Swarm has always been quite popular among developers who prefer fast deployments and simplicity— and among ops who are learning to get comfortable with an orchestrated environment.
In this post, we will walk through how to deploy a Docker Swarm cluster on GCP using Terraform from scratch. Let’s do it!
All the templates and playbooks used in this tutorial, can be found on my GitHub.
Get Started
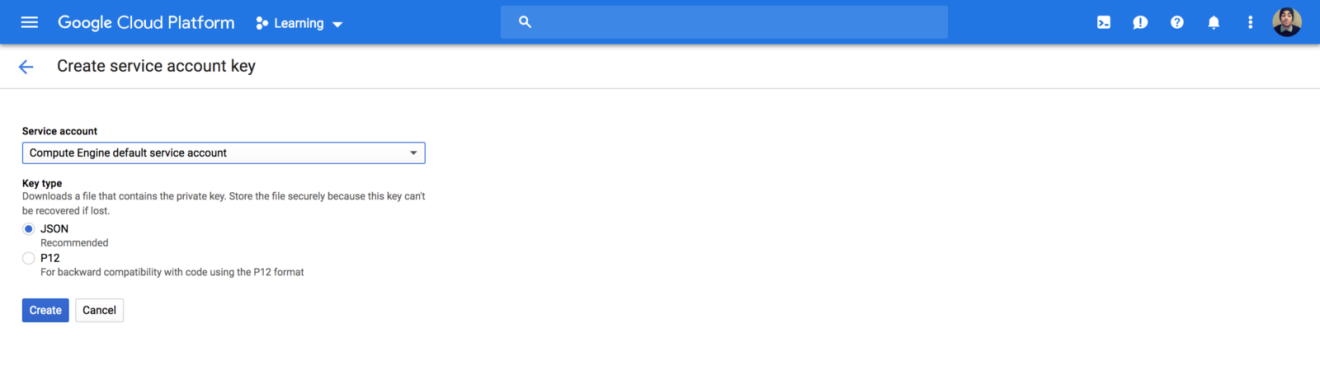
To get started, sign in to your Google Cloud Platform console and create a service account private key from IAM:
Download the JSON file and store it in a secure folder.
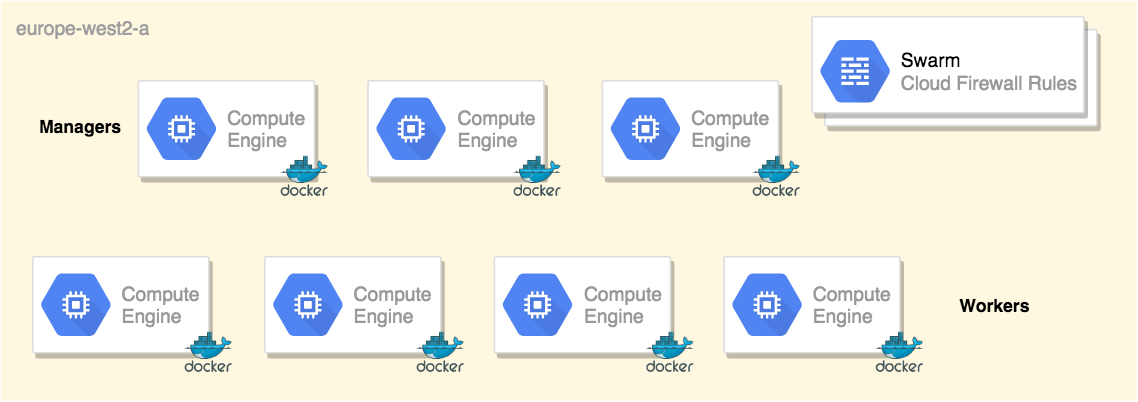
For simplicity, I have divided my Swarm cluster components to multiple template files — each file is responsible for creating a specific Google Compute resource.
1. Setup your swarm managers
In this example, I have defined the Docker Swarm managers based on the CoreOS image:
Similarly, a set of Swarm workers based on CoreOS image, and I have used the resource dependencies feature of Terraform to ensure the Swarm managers are deployed first. Please note the usage of depends_on keyword:
Also, I have defined a network interface with a list of firewall rules that allows inbound traffic for cluster management, raft sync communications, docker overlay network traffic and ssh from anywhere:
resource "google_compute_network" "swarm" { name = "swarm-network" }
4. Automate your inventory with Terraform
In order to take automation to the next level, let’s use Terraform template_file data source to generate a dynamic Ansible inventory from Terraform state file:
Once the templates are defined, we will use Ansible to provision our instances and turn them to a Swarm cluster. Hence, I created 3 Ansible roles:
python: as its name implies, it will install Python on the machine. CoreOS ships only with the basics, it’s a minimal linux distribution without much except tools centered around running containers.
swarm-init: execute the docker swarm init command on the first manager and store the swarm join tokens.
swarm-join: join the node to the cluster using the token generated previously.
By now, your main playbook will look something like:
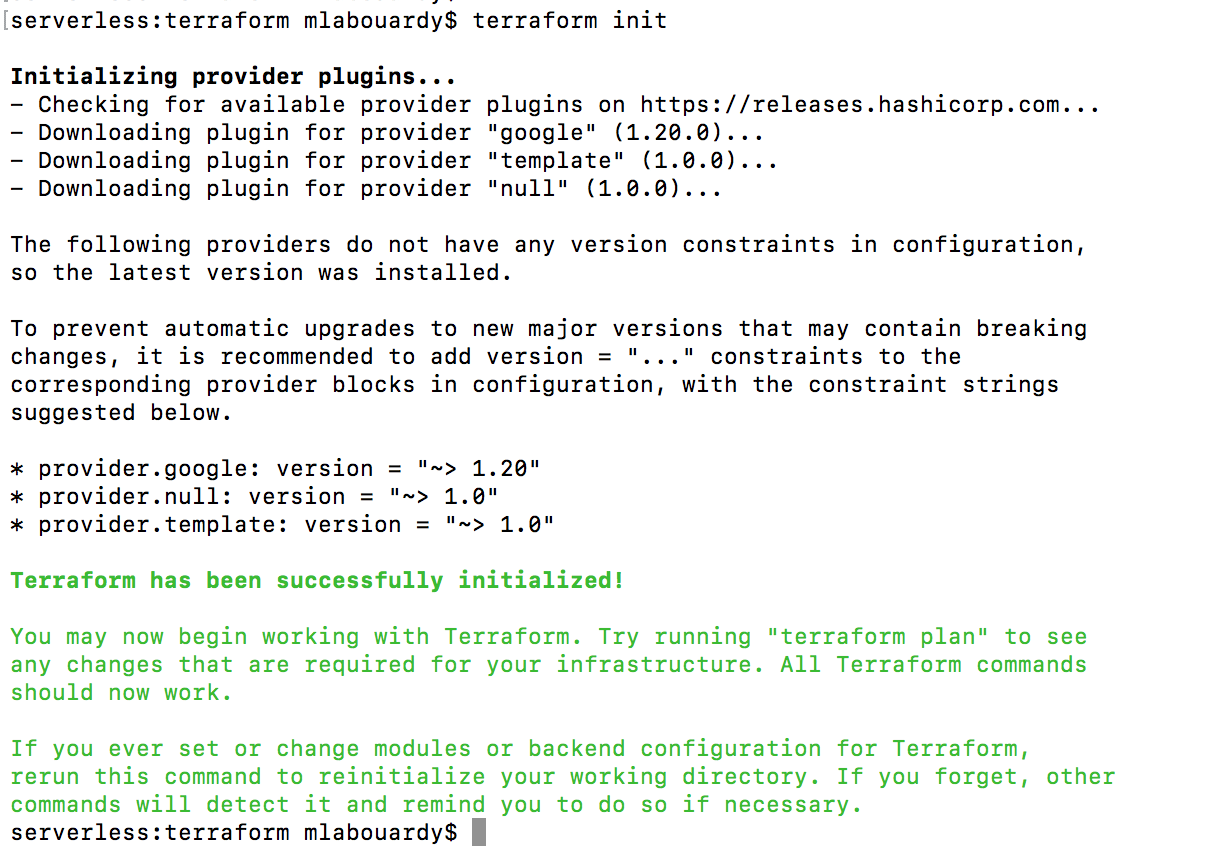
To test it out, open a new terminal session and issue terraform init command to download the google provider:
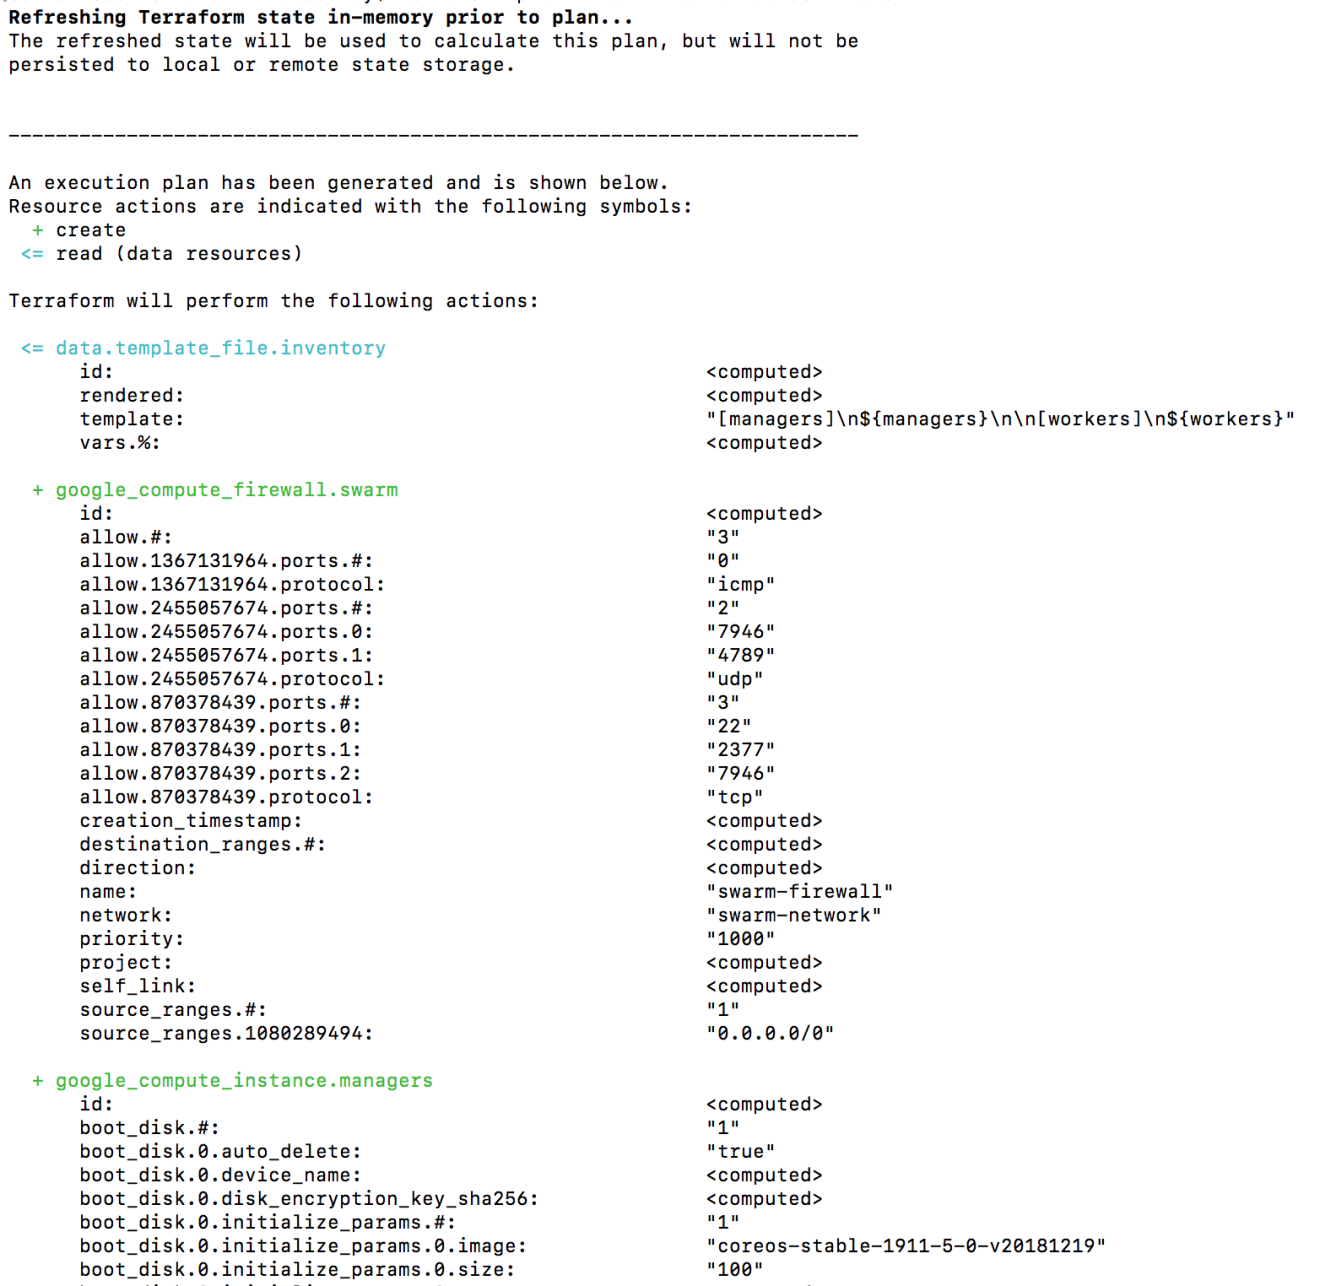
Create an execution plan (dry run) with the terraform plan command. It shows you things that will be created in advance, which is good for debugging and ensuring that you’re not doing anything wrong, as shown in the next screenshot:
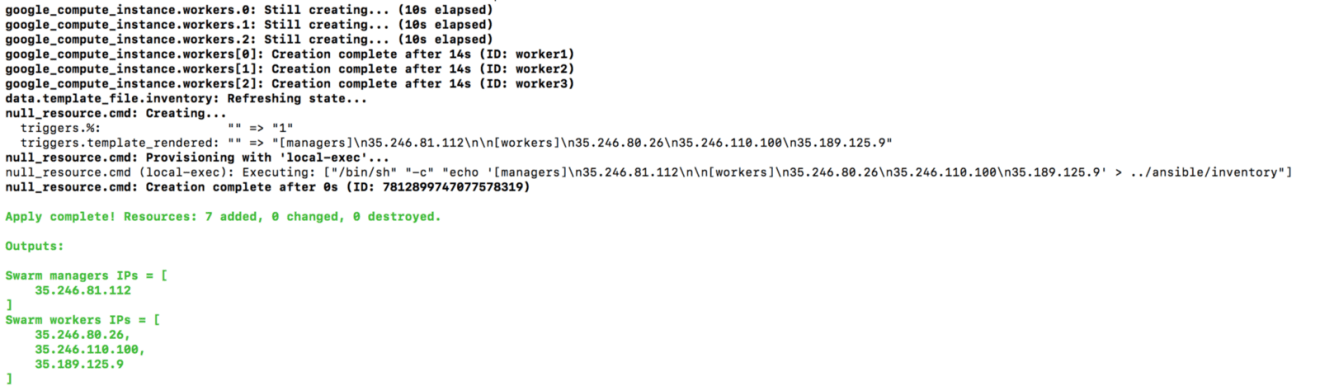
You will be able to examine Terraform’s execution plan before you deploy it to GCP. When you’re ready, go ahead and apply the changes by issuing terraform apply command.
The following output will be displayed (some parts were cropped for brevity):
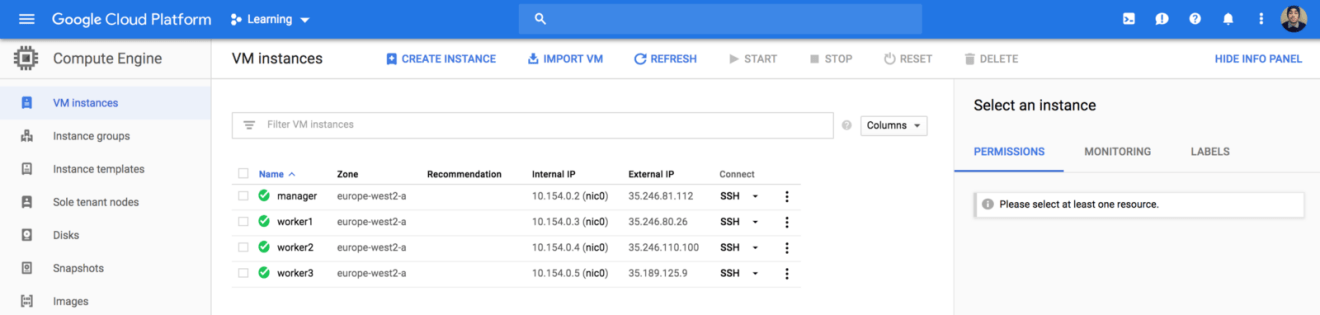
If you head back to Compute Engine Dashboard, your instances should be successfully created:
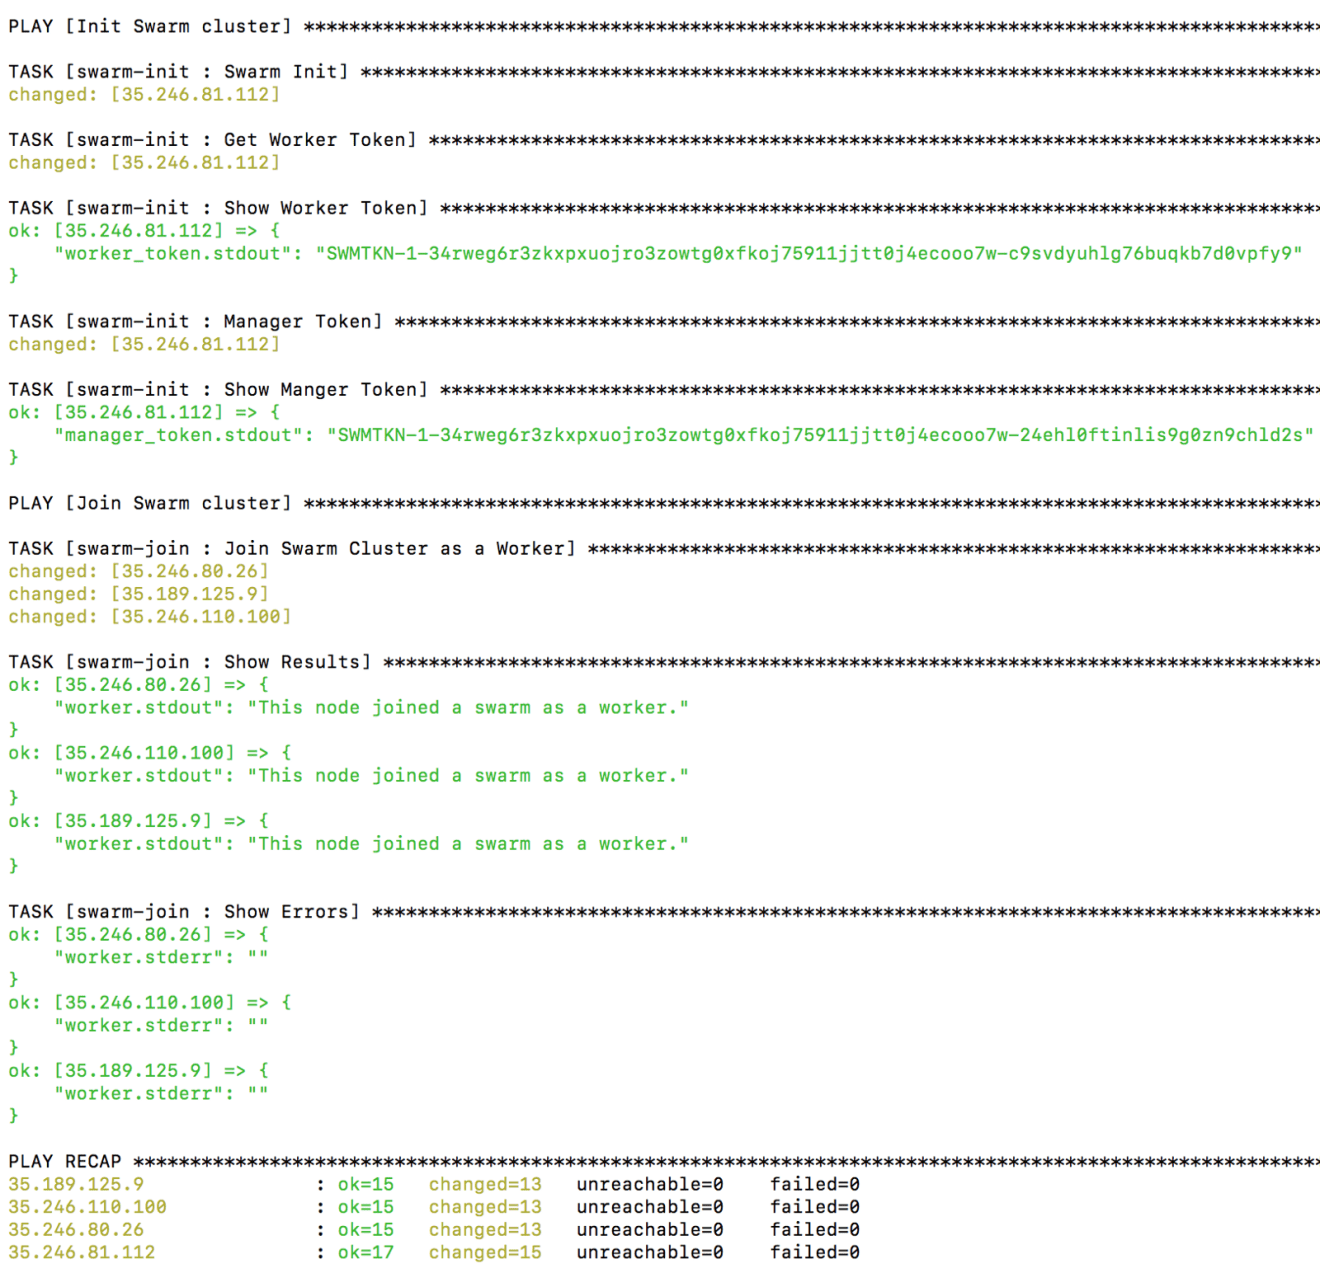
7. Create your Swarm cluster with Ansible
Now our instances are created, we need to turn them to a Swarm cluster with Ansible. Issue the following command:
1
ansible-playbook -i inventory main.yml
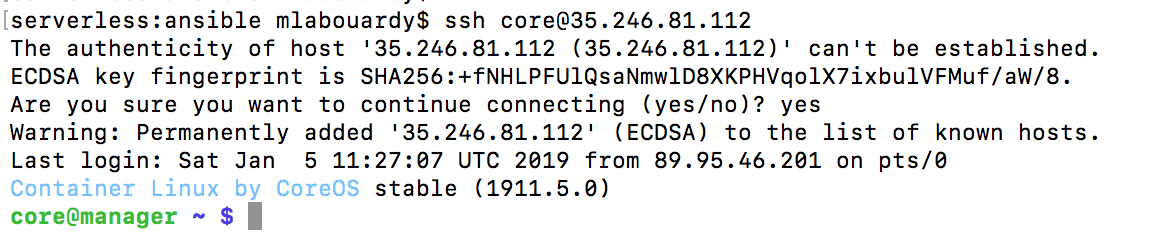
Next, SSH to the manager instance using it’s public IP address:
If you run docker node ls, you will get a list of nodes in the swarm:
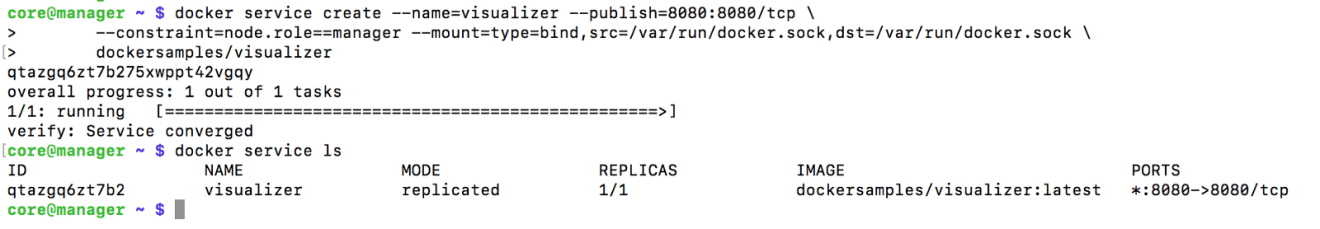
Deploy the visualizer service with the following command:
1 2 3
docker service create --name=visualizer --publish=8080:8080/tcp \ --constraint=node.role==manager --mount=type=bind,src=/var/run/docker.sock,dst=/var/run/docker.sock \ dockersamples/visualizer
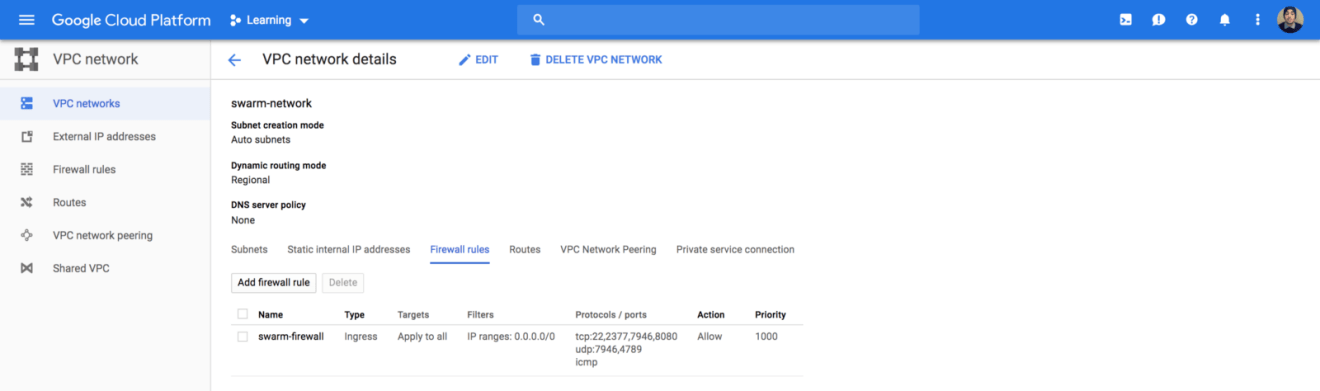
8. Update your network rules
The service is exposed on port 8080 of the instance. Therefore, we need to allow inbound traffic on that port, you can use Terraform to update the existing firewall rules:
resource "google_compute_network" "swarm" { name = "swarm-network" }
Run terraform apply again to create the new ingress rule, it will detect the changes and ask you to confirm it:
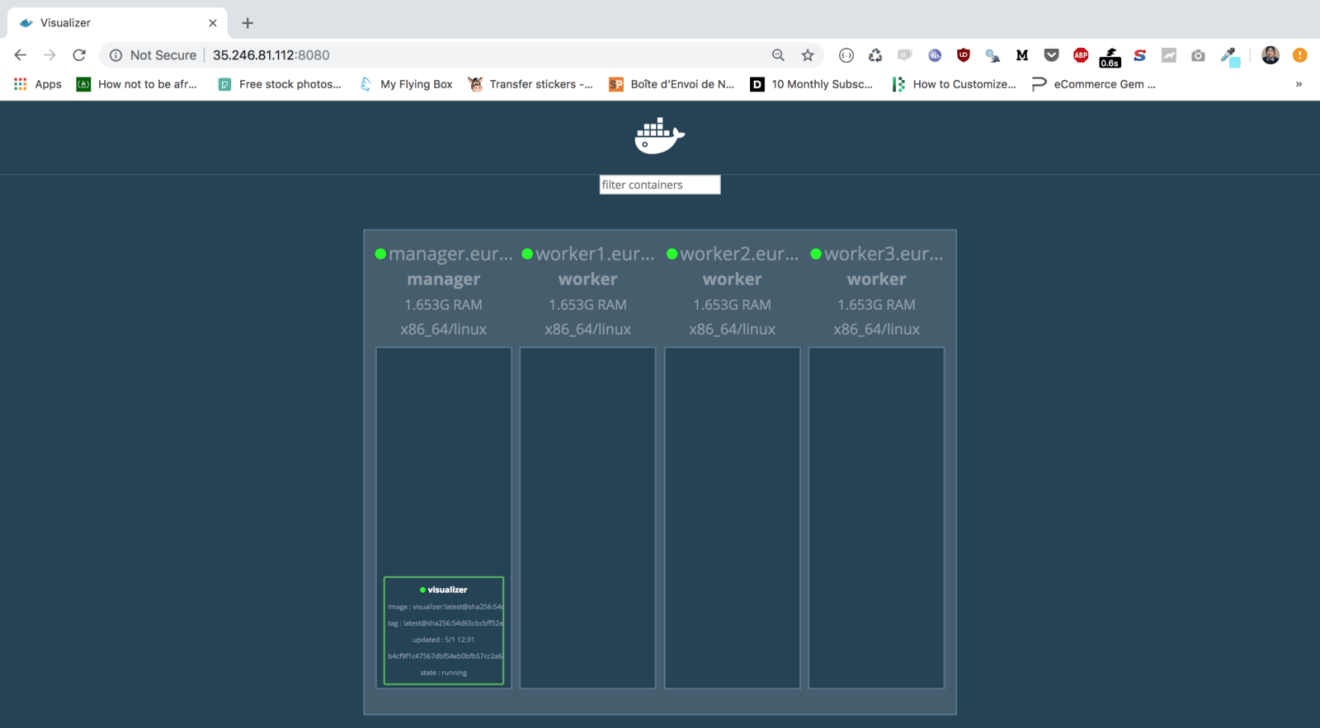
If you point your favorite browser to your http://instance_ip:8080, the following dashboard will be displayed which confirms our cluster is fully setup:
In an upcoming post, we will see how we can take this further by creating a production-ready Swarm cluster on GCP inside a VPC — and how to provision Swarm managers and workers on-demand using instance groups based on increases or decreases in load.
We will also learn how to bake a CoreOS machine image with Python preinstalled with Packer, and how to use Terraform and Jenkins to automate the infrastructure deployment!
Drop your comments, feedback, or suggestions below — or connect with me directly on Twitter @mlabouardy.
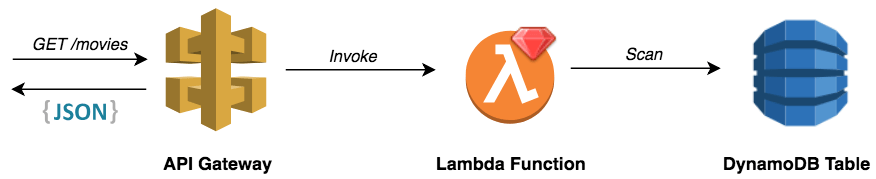
At AWS re:Invent 2018, it was announced that Ruby is now a supported language for AWS Lambda. In this post, I walk you through how to write your very first Ruby-based Lambda function from scratch, followed by how to configure, deploy, and test a Lambda function.
API Gateway will forward incoming requests to the target Ruby based Lambda function, which will call the corresponding DynamoDB operation on the movies table.
To get started, create a Lambda execution role with permission to invoke the Scan operation on the DynamoDB table:
The function entry-point below is is self explanatory, it uses the AWS SDK (the package is pre-installed in Lambda) to instantiate a DynamoDB client in the appropriate region and issues the Scan operation on the DynamoDB table (defined in an environment variable):
The AWS SDK for Ruby is included in the Lambda execution environment by default.
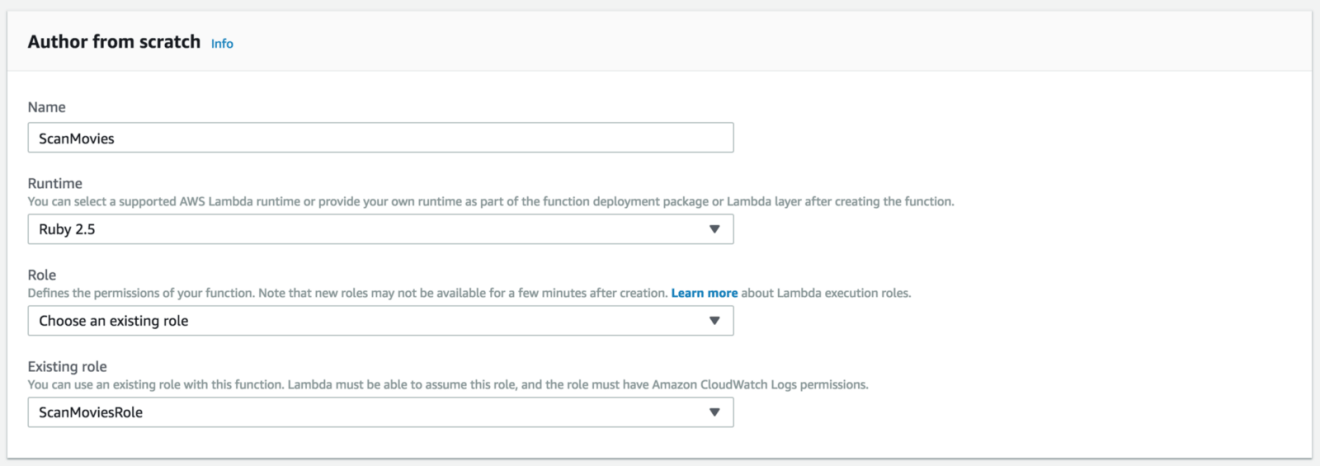
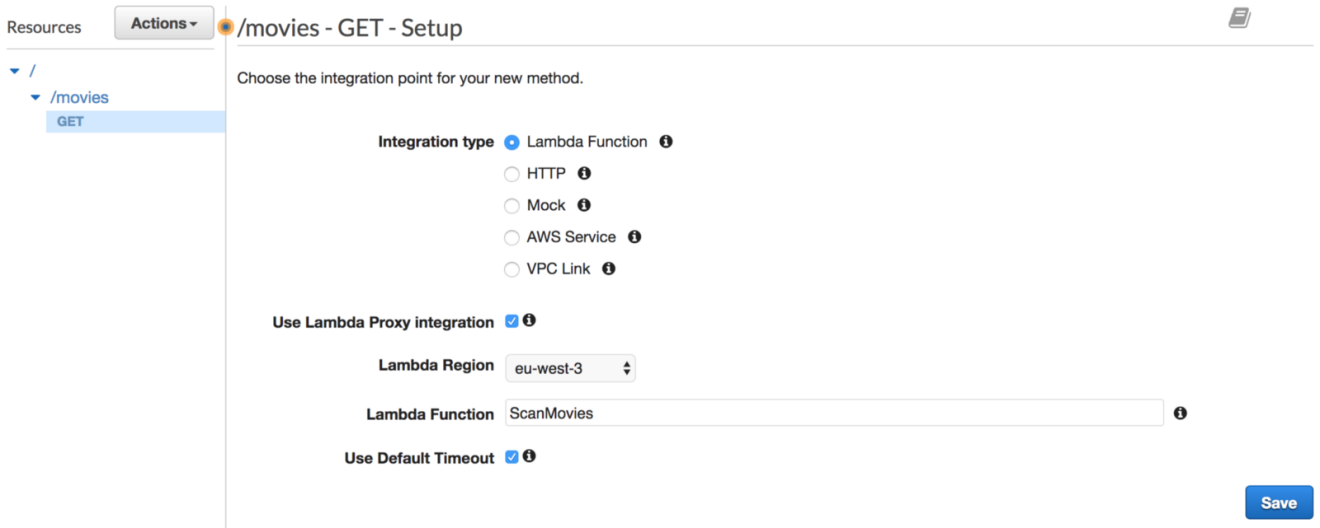
Now that our handler is defined, head to the Lambda form creation and select the IAM role (you might need to refresh the page for the changes to take effect) from the Existing role drop-down list. Then, click the Create function button:
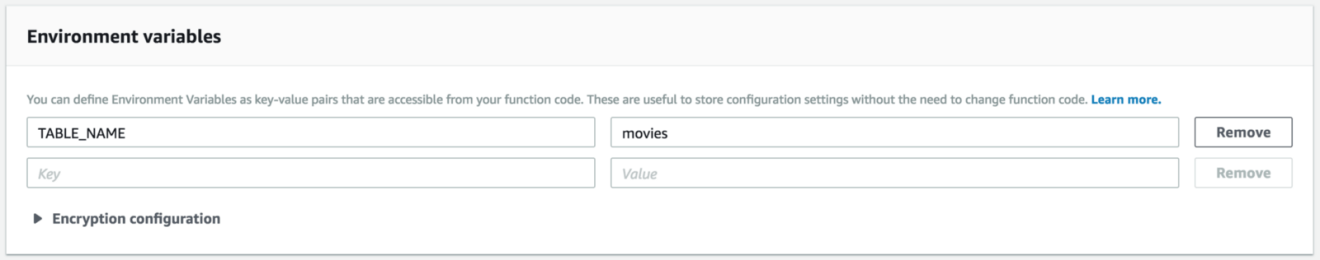
Set the table name as an environment variable:
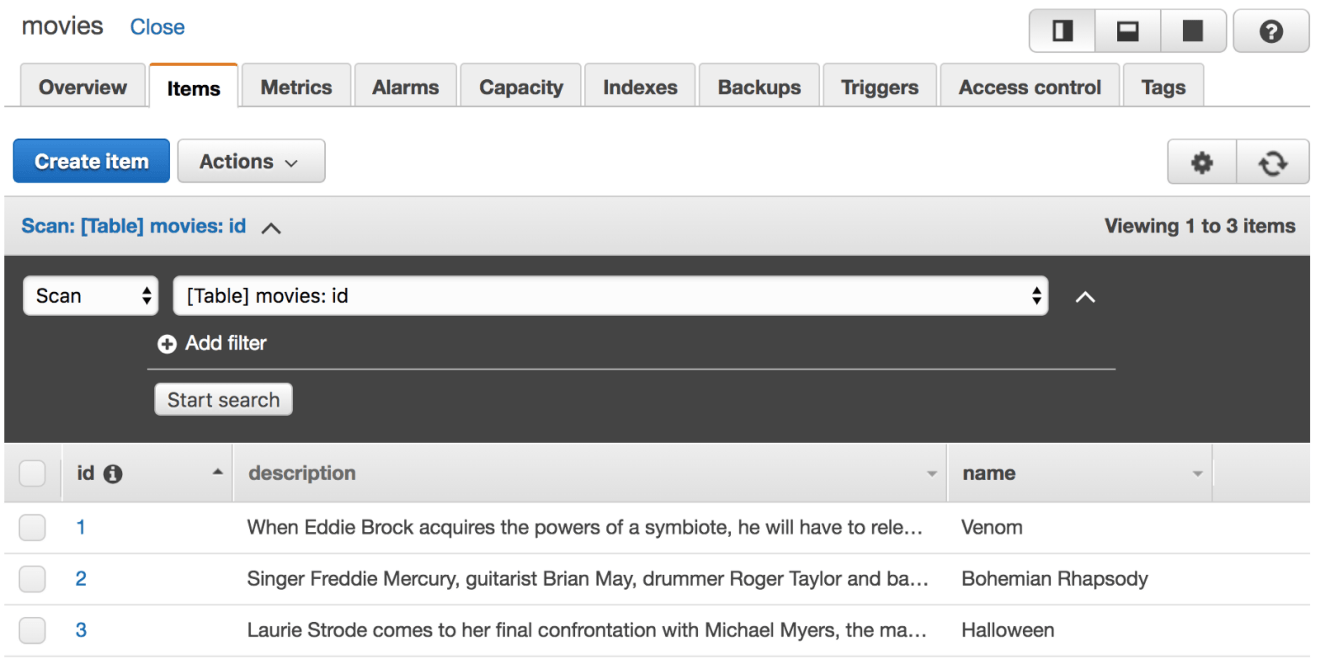
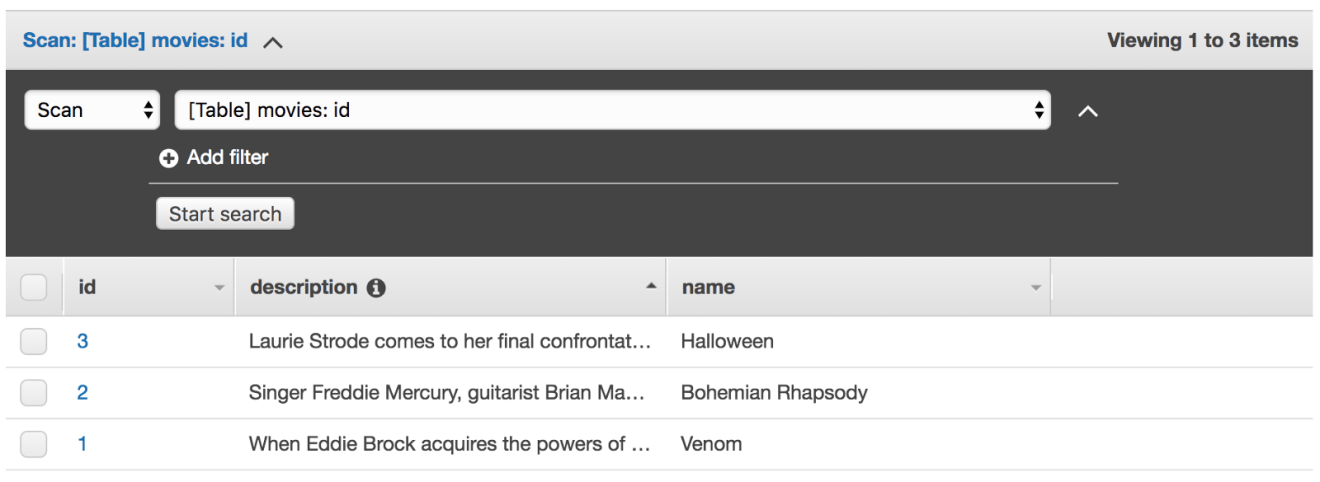
The movies table contains a set of movies:
Create a deployment package (zip file) and update the function’s code using the AWS CLI command:
Make sure to set the Lambda function handler to handler.lambda_handler
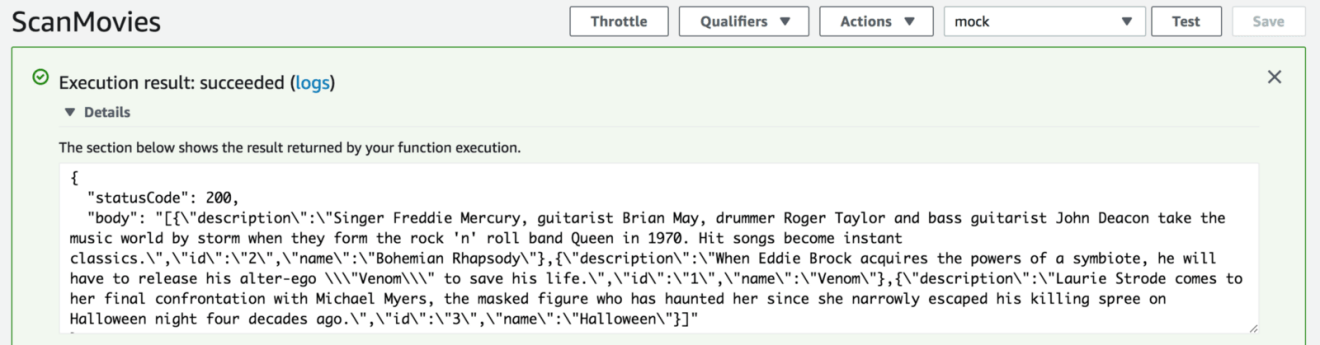
Once the function has been deployed, invoke it manually using the sample event data by clicking on the “Test” button in the top right of the console.
So far, we learned how to build our first Lambda function with Ruby. We also learned how to invoke it manually from the console. To leverage the power of Lambda, we are going to learn how to trigger this Lambda function in response to incoming HTTP requests (event-driven architecture) using the AWS API Gateway service:
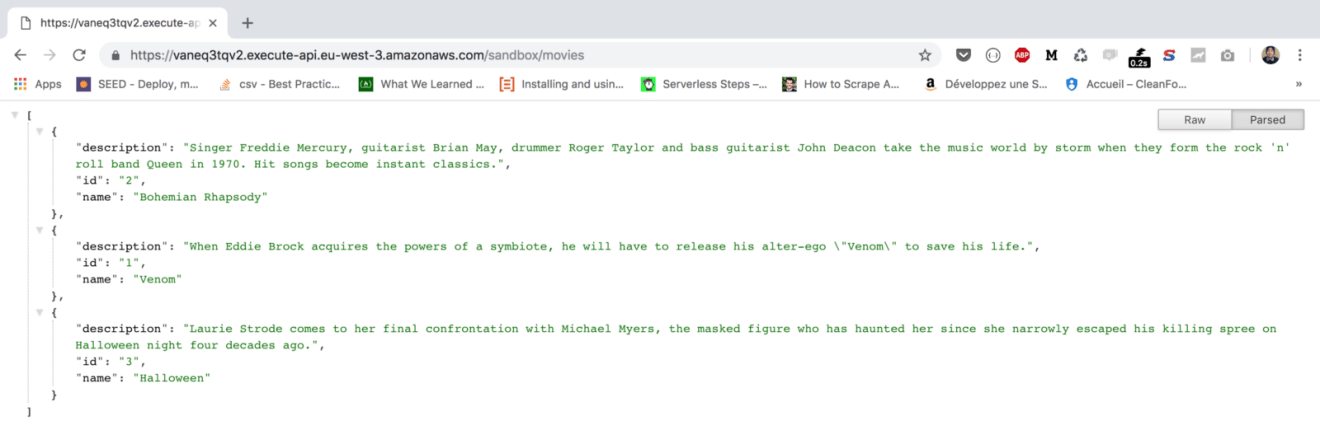
Create a deployment stage and open your favorite browser with the API Invoke URL; you should see a message like the one shown in the following screenshot:
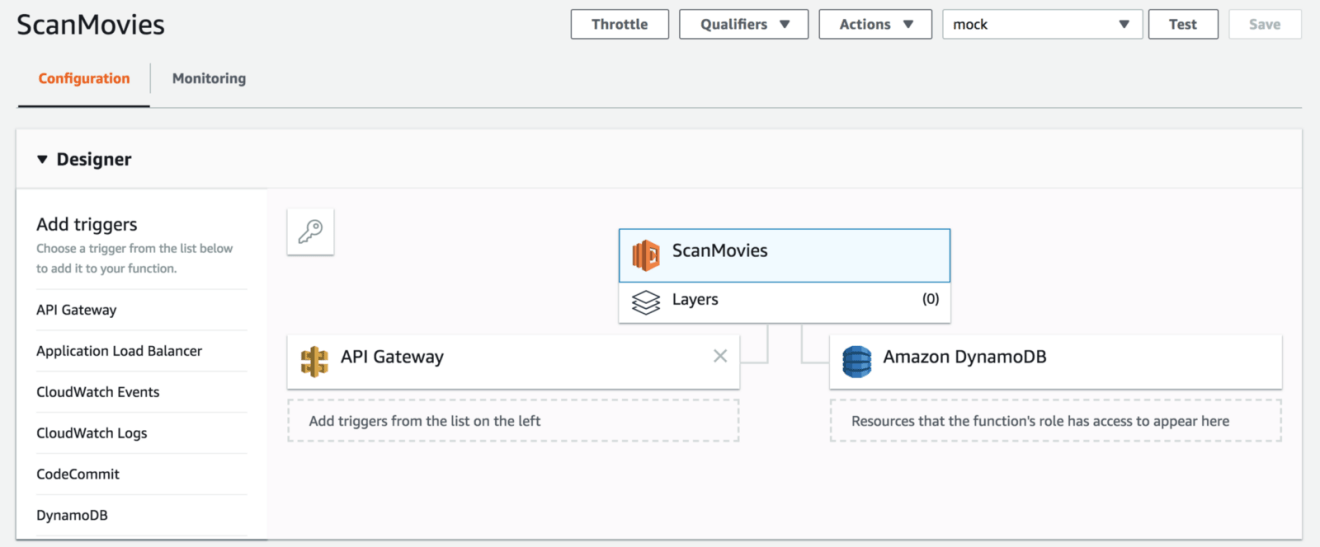
The following screenshot shows a properly configured Ruby based Lambda function with IAM access to DynamoDB:
Like what you’re reading? Check out my book and learn how to build, secure, deploy and manage production-ready Serverless applications in Golang with AWS Lambda.
Drop your comments, feedback, or suggestions below — or connect with me directly on Twitter @mlabouardy.
A common use case of API Gateway is building API endpoints in top of Lambda functions. It can also be used as an API proxy to connect to AWS services. In this guide, I will walk you through how to create your own API using API Gateway and DynamoDB only and go through advanced features to enhance your API endpoints such as:
Mapping templates, Integration Request and Integration Response.
Error handling and request validation.
Authentication with AWS Cognito and Lambda Authorizer.
API Throttling with Plan usage and API keys.
API documentation generation.
API Gateway custom domain.
Setting up DynamoDB
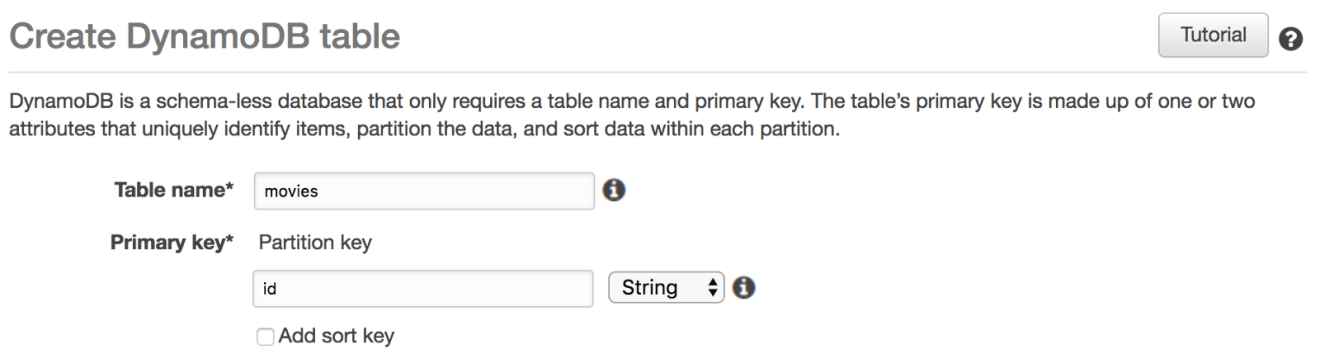
To get started, create a DynamoDB table called movies with an id as a partition key (leave the read/write capacity to default values):
Next, insert few items into the table, it should look something like this:
Next, we need to grant the API Gateway access to DynamoDB table. Therefore we need to create an IAM role assumable by API Gateway:
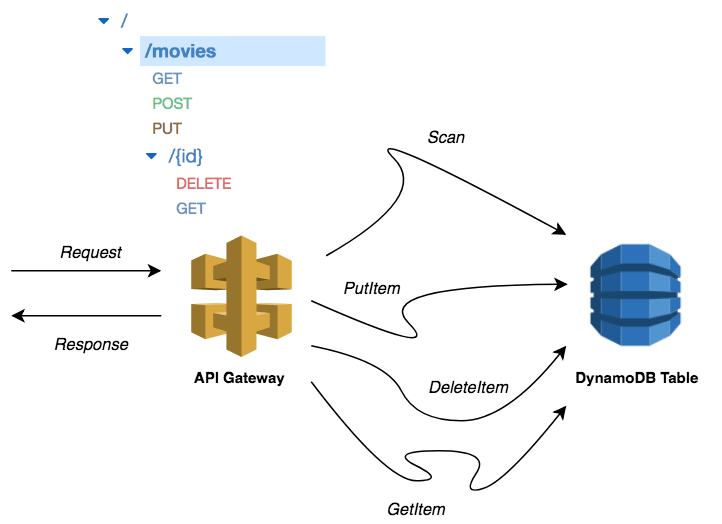
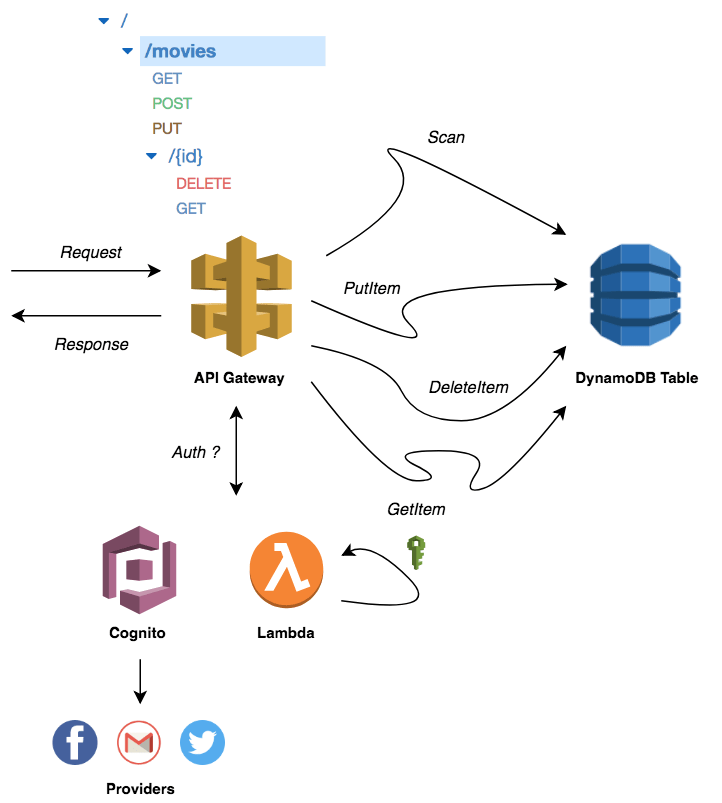
Before going into further detail about the architecture, the following diagram shows how API Gateway and DynamoDB will fit into the API architecture:
When calling the API endpoints, the request will go through the API Gateway, which will invoke the appropriate DynamoDB operation. This returns a response which is proxied by the API Gateway to the client in a JSON format.
GET /MOVIES
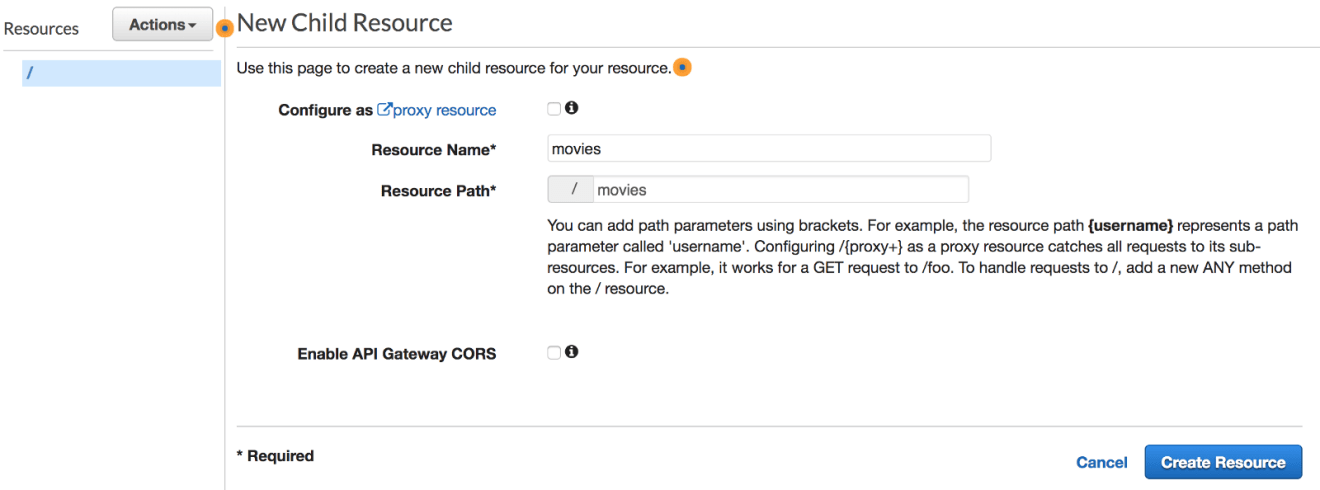
Create new API called MoviesAPI from API Gateway Console, and create a new resource, let’s call it movies:
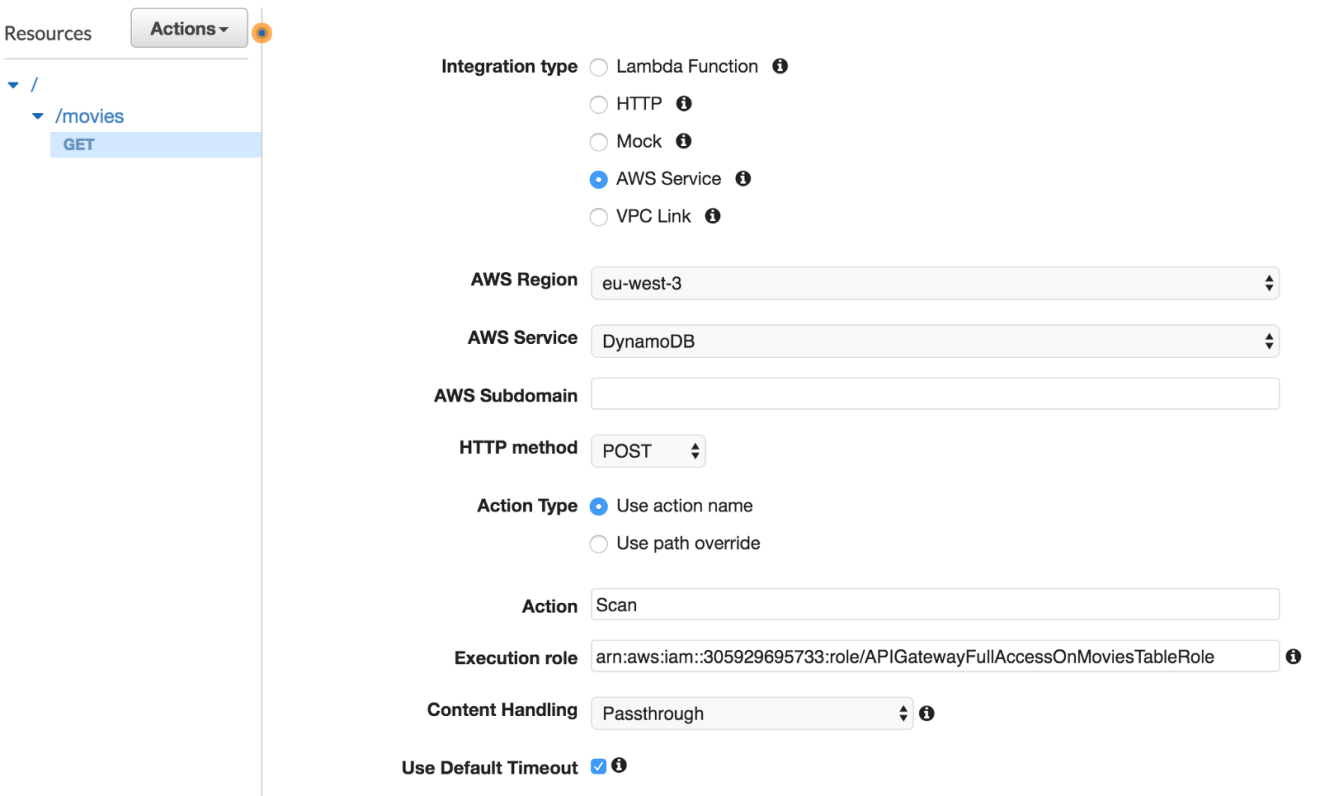
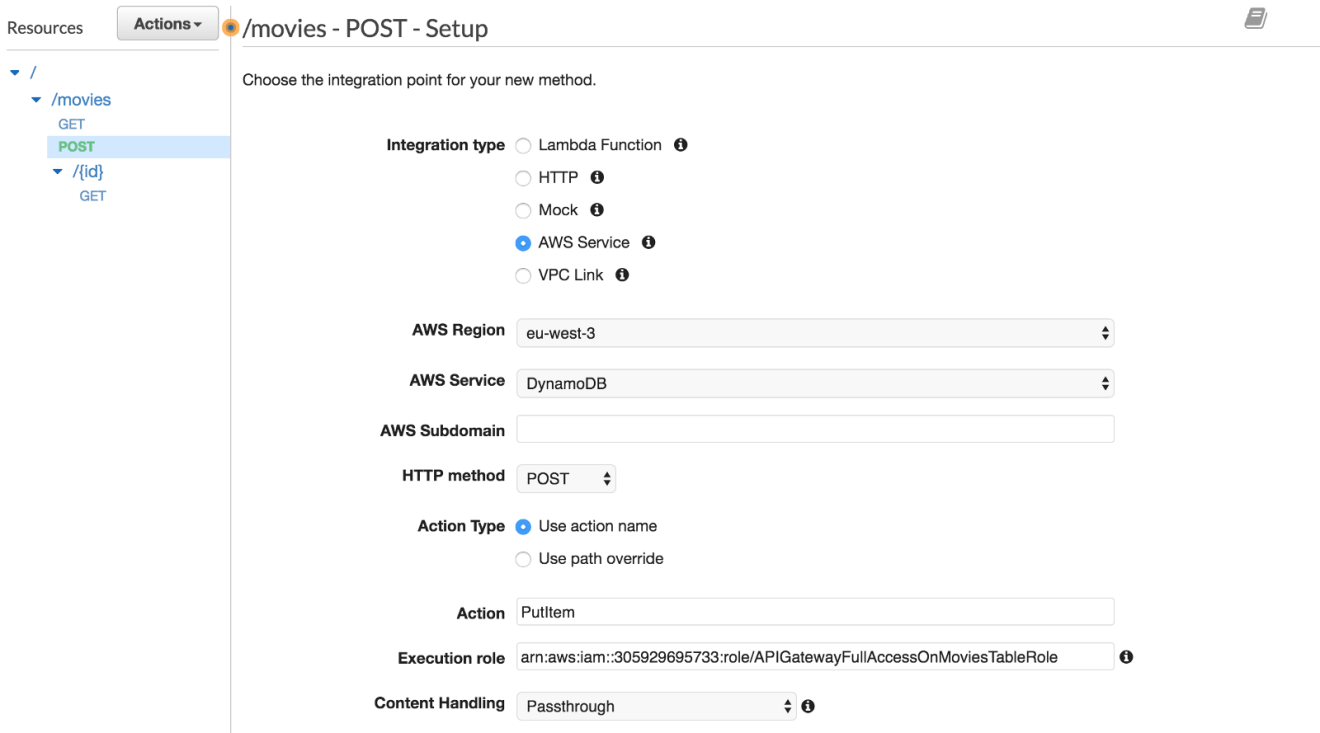
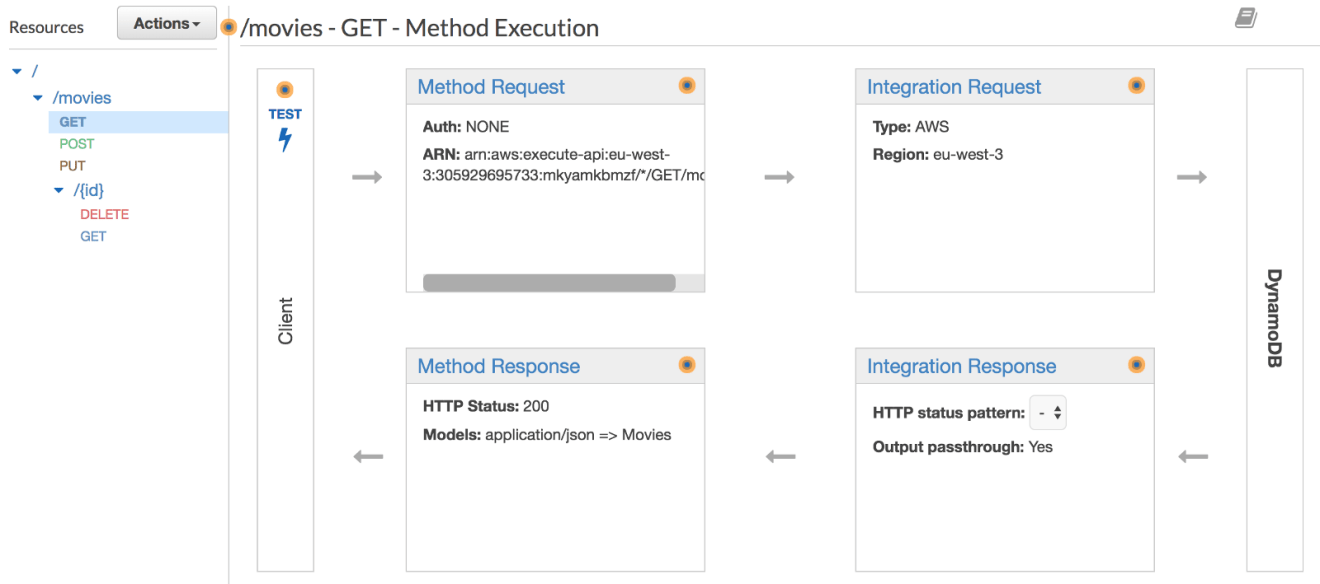
Expose a GET method on /movies resource by clicking on “Create Method”. Select AWS Service under the “Integration type” section, choose the DynamoDB service, set the HTTP method to be POST and action type to be a Scan operation.
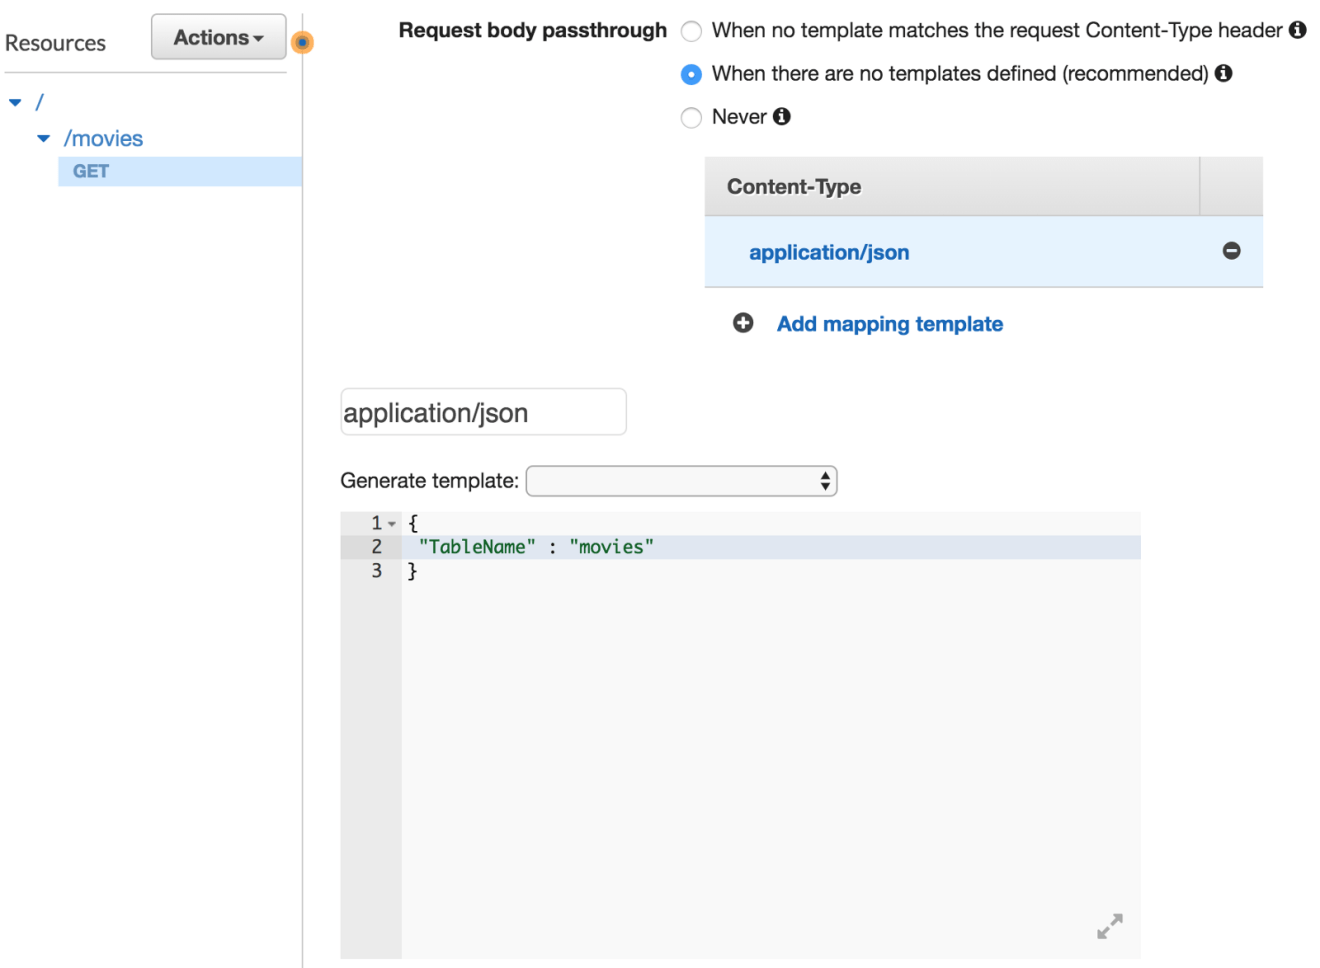
Next, we need to transform the HTTP request coming into API Gateway to a proper Scan request for DynamoDB. In the API Gateway console, select the “Integration Request”. All the way at the bottom we can select the Body Mapping Templates. Here, create a new application/json mapping template with the following configuration:
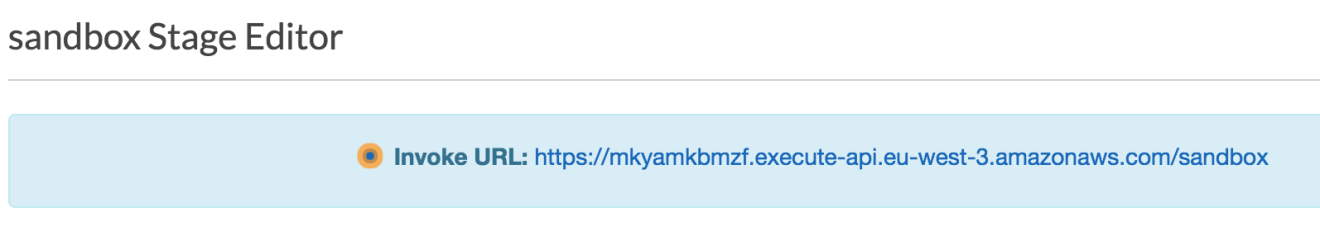
Deploy the API from “Actions” and create a new deployment stage, an invocation URL will be displayed:
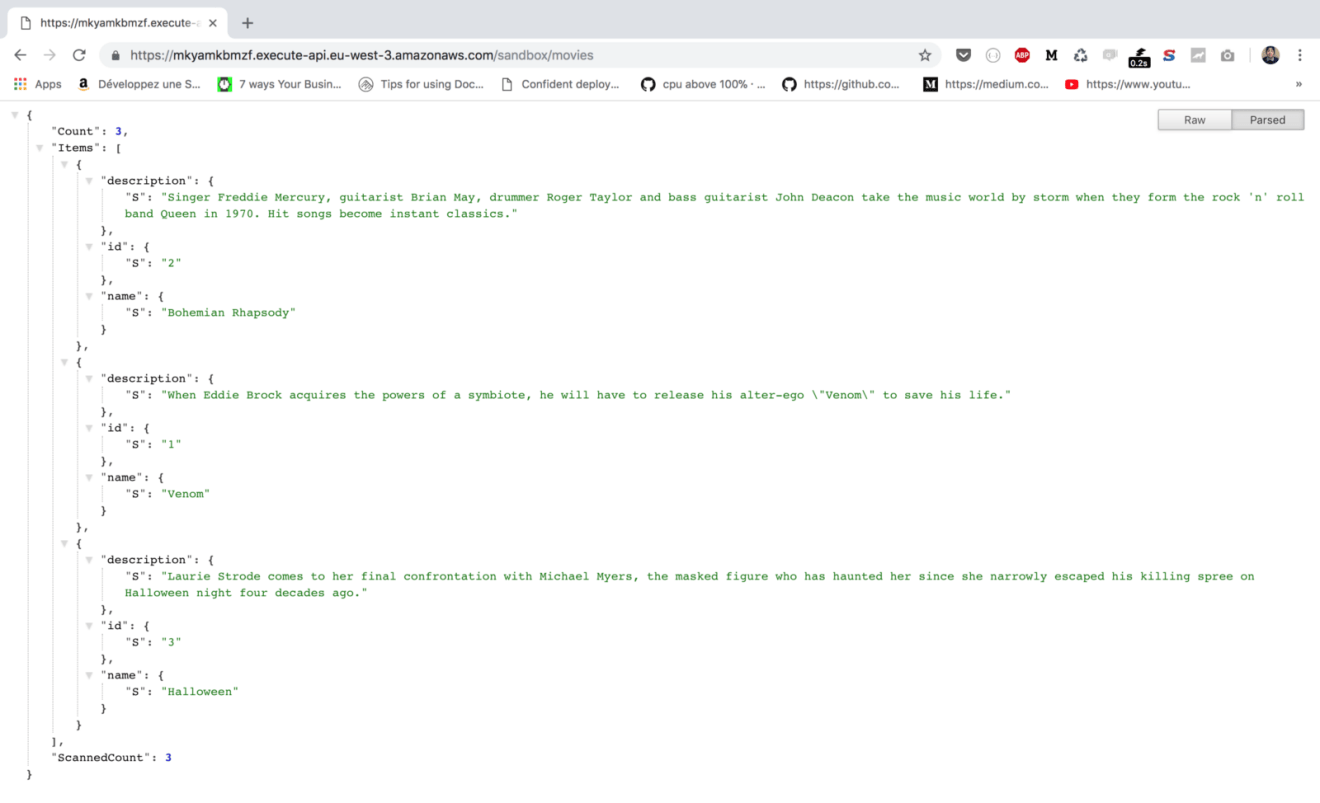
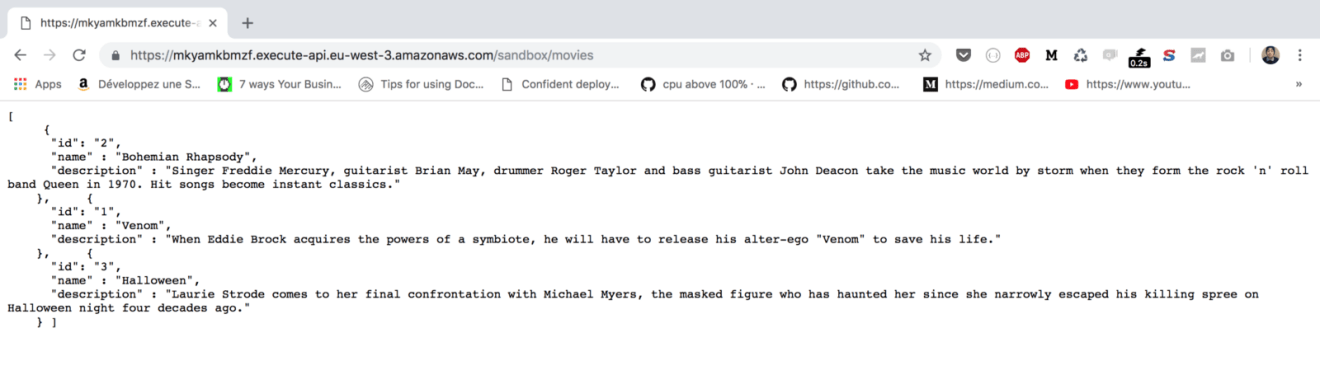
Point your browser to the URL given or use a modern REST client like Postman. The endpoint will return a list of movies in a JSON format:
The output is returned in DynamoDB response format, in order to map the raw response to traditional JSON object structure, we will use Integration Response feature.
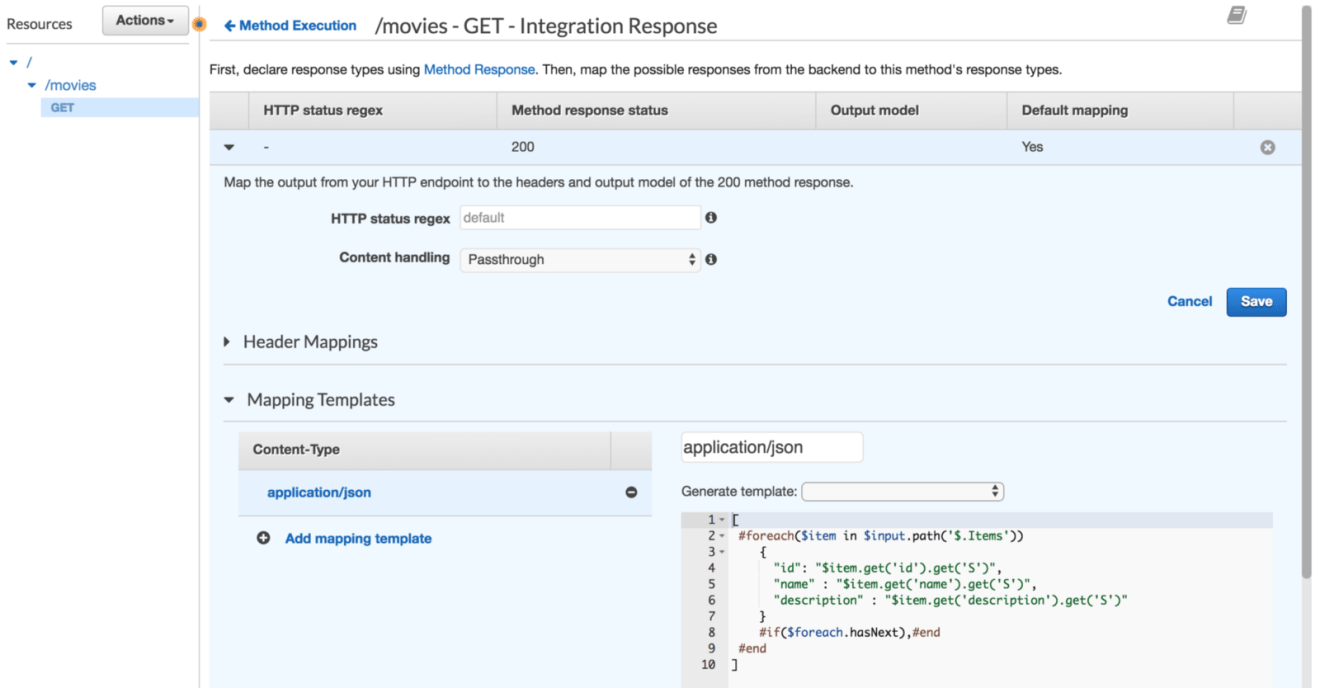
Click on “GET” method and navigate to “Integration Response”, expand the 200 response code. Expand the “Mapping Templates” section. In Content-Type choose application/json and create a mapping template that loop through each item from the Items array, extracts the relevant attributes of the movie’s item and places them into a response structure:
As a result, you should now see a formatted response.
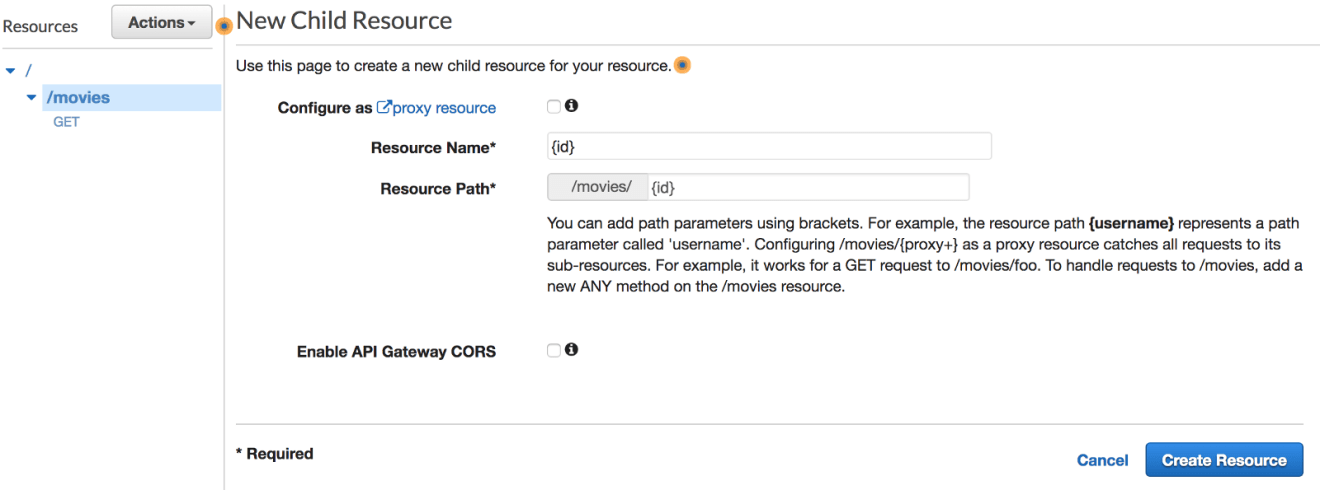
GET /MOVIES/:ID
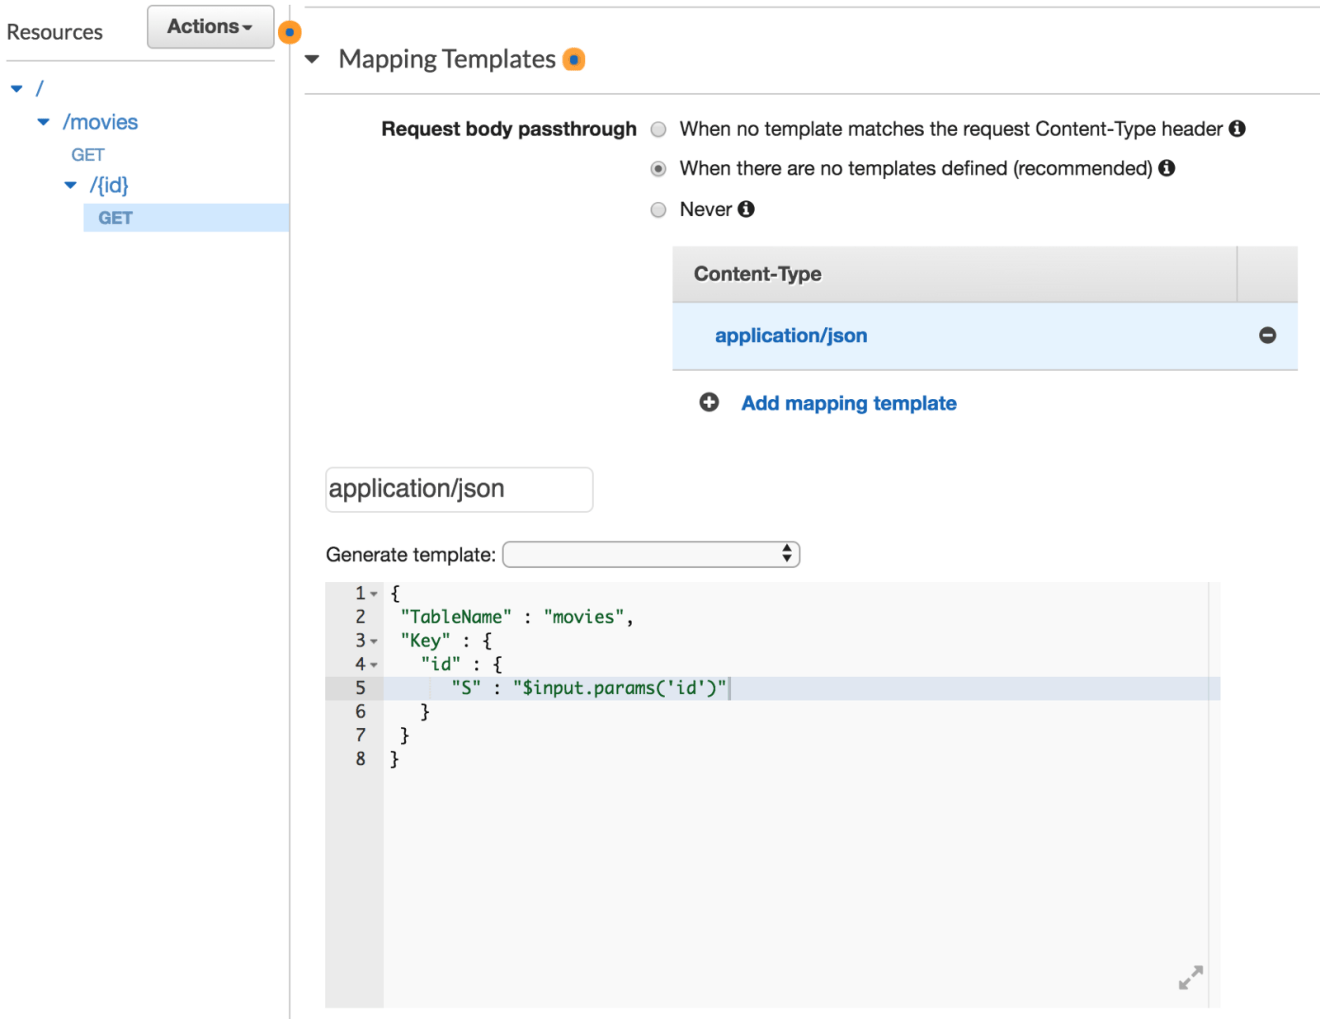
The second endpoint will be responsible of fetching a movie based on an ID provided by the client. Hence, a new resource with a path parameter should be created. The value of ID will be made available via the $input.params(‘id’) method:
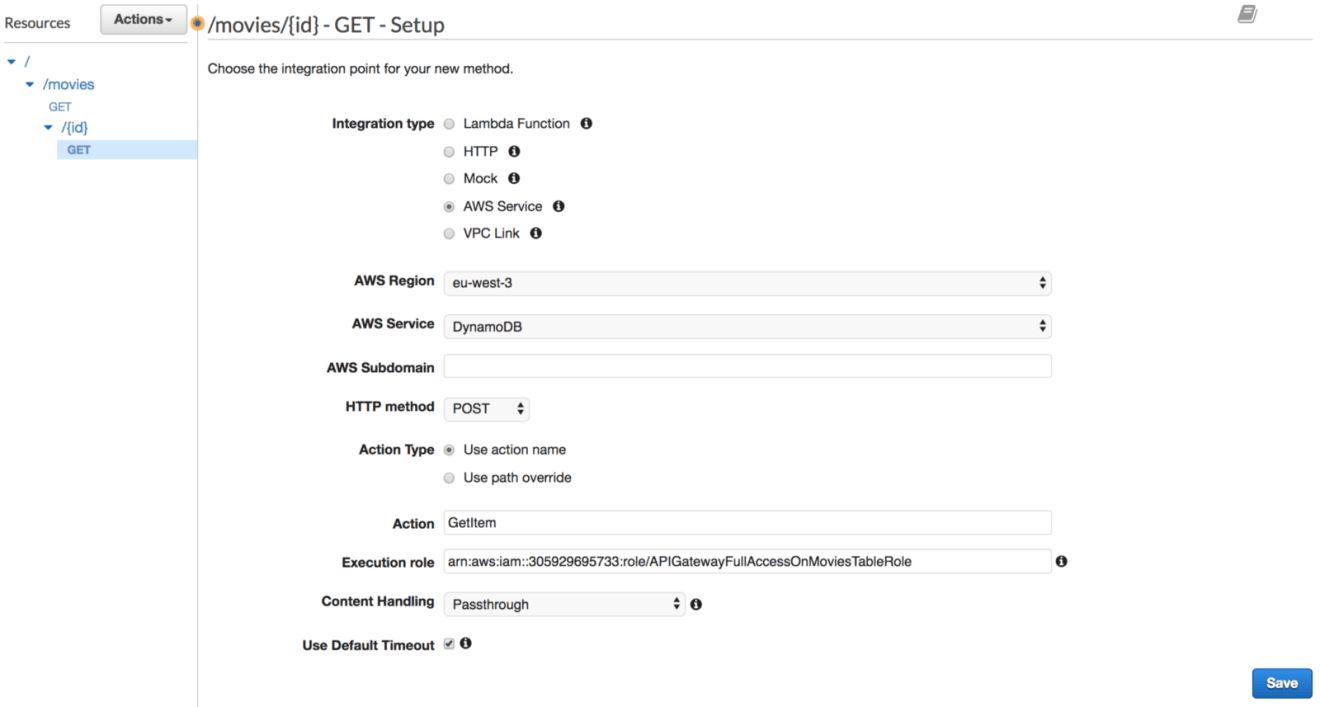
Expose a GET method, and then link the resource to the DynamoDB service. The action will be GetItem operation:
Again, specify a body mapping template for the integration request, now with the following template:
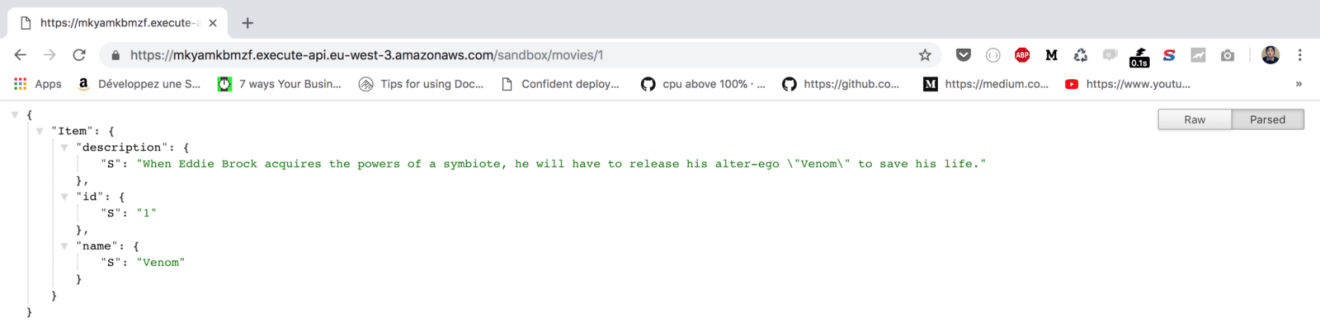
When the API URL is invoked with an ID, the movie corresponding to the ID is returned if it exists.
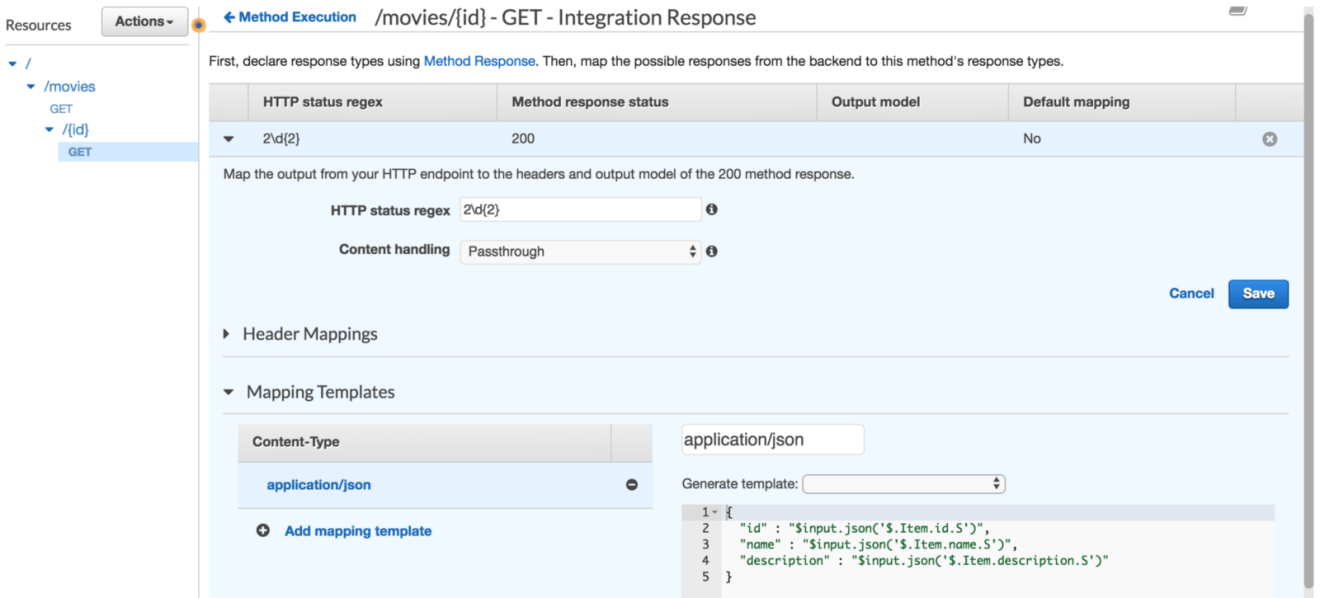
Similarly we will use integration response to map the raw DynamoDB response to the similar JSON object structure we defined earlier:
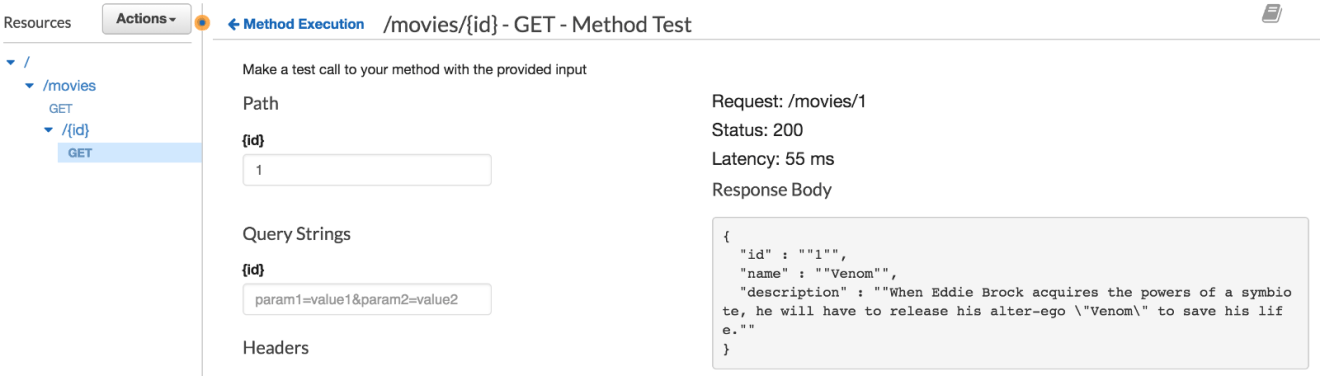
If you test it out once again, the following JSON will be returned:
POST /MOVIES
Now we know how the GET method works with and without path parameters. The next step will be to insert a new item to the table. Create a POST method with PutItem as an action:
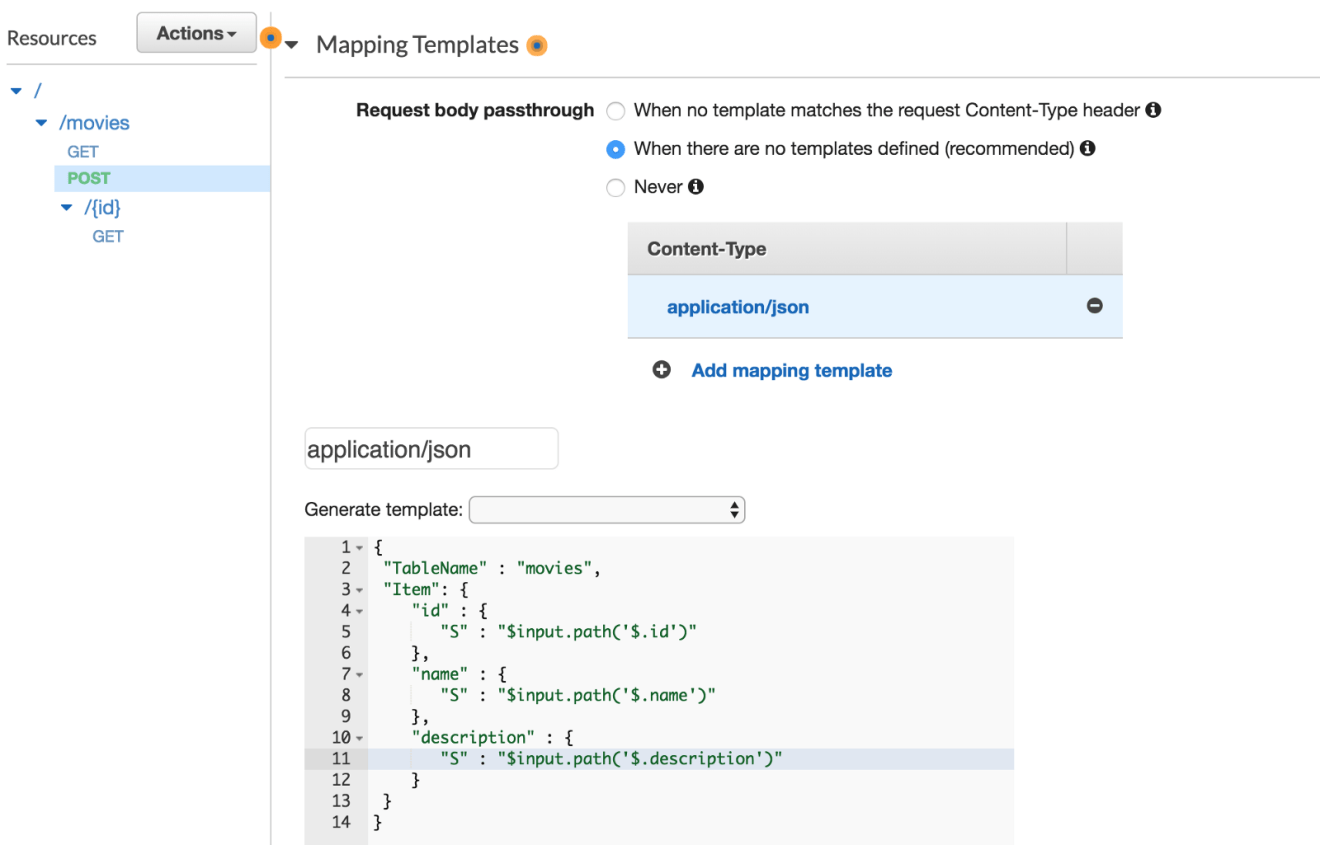
We will create a mapping template to transform the client request into the structure that the DynamoDB API PutItem requires. The below mapping template creates the JSON structure required by the DynamoDB PutItem API. The three input variables are referenced from the request JSON using the $input variable:
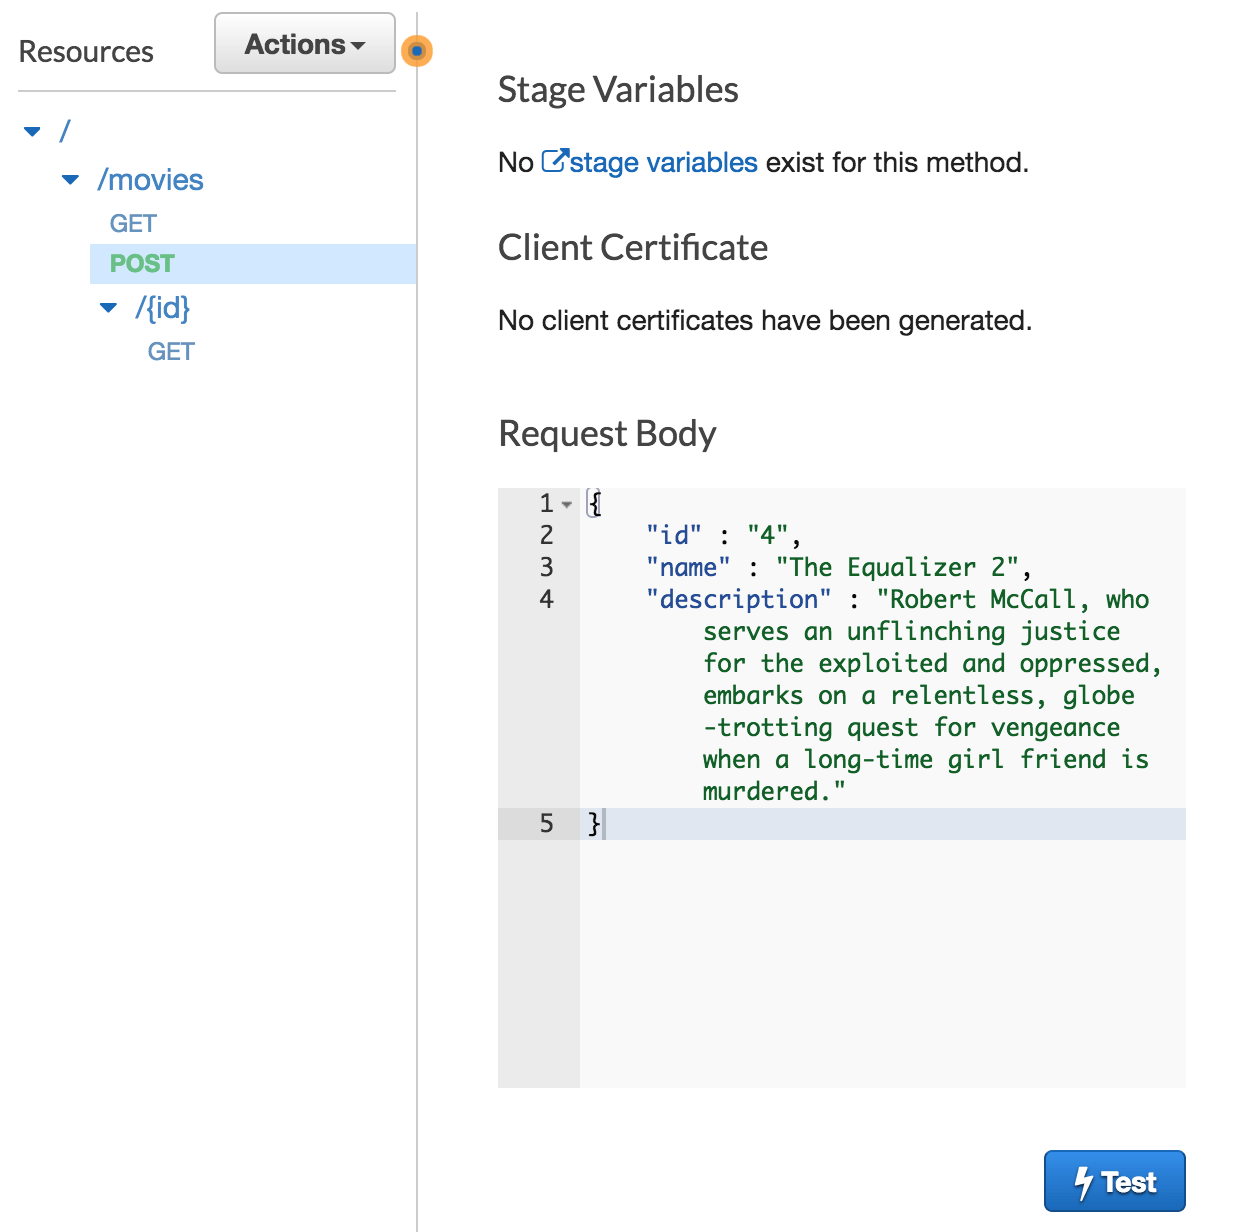
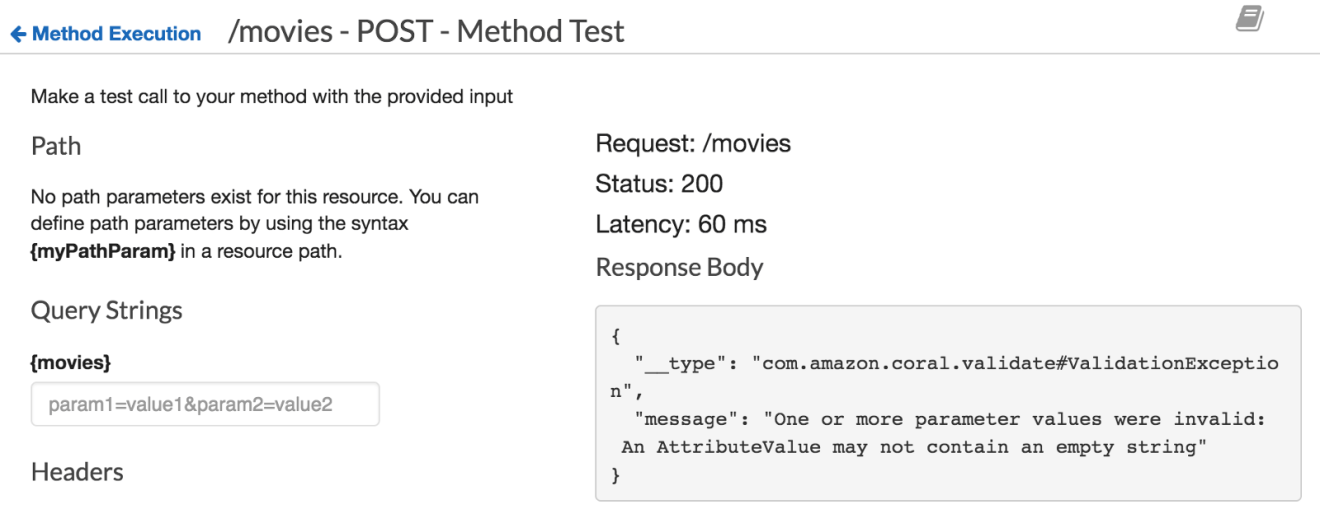
Back in the “Method Execution” pane click “TEST”. Create an example request body that matches the API definition documented above and then choose “Test”. For example, your request body could be:
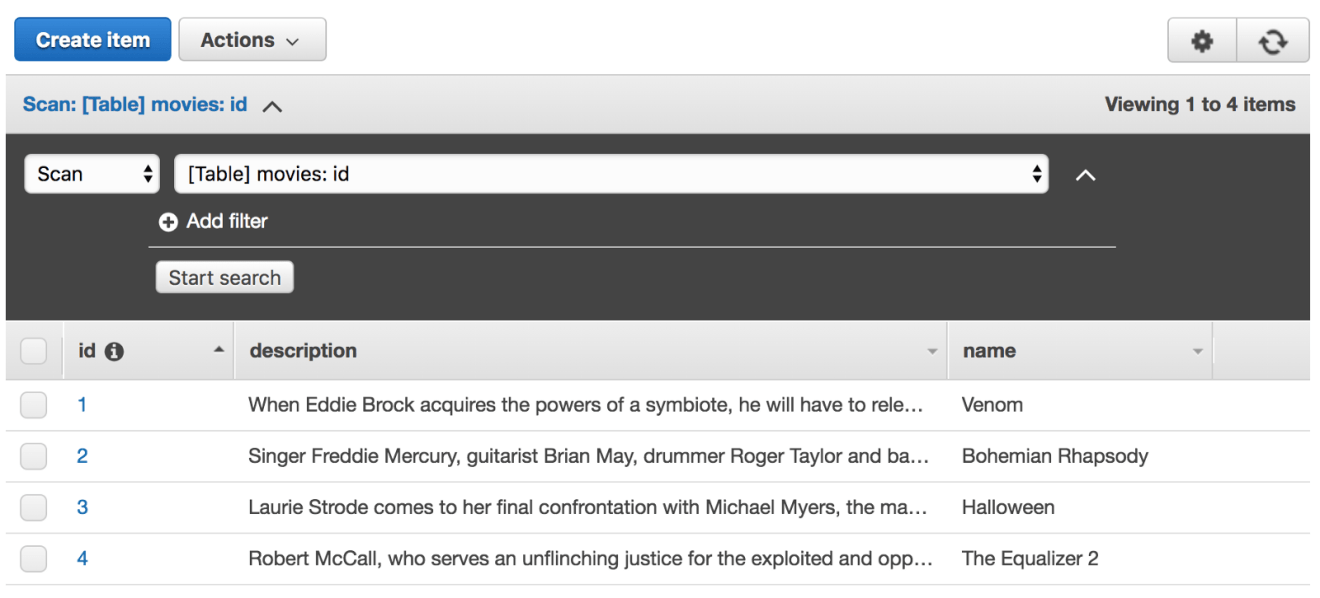
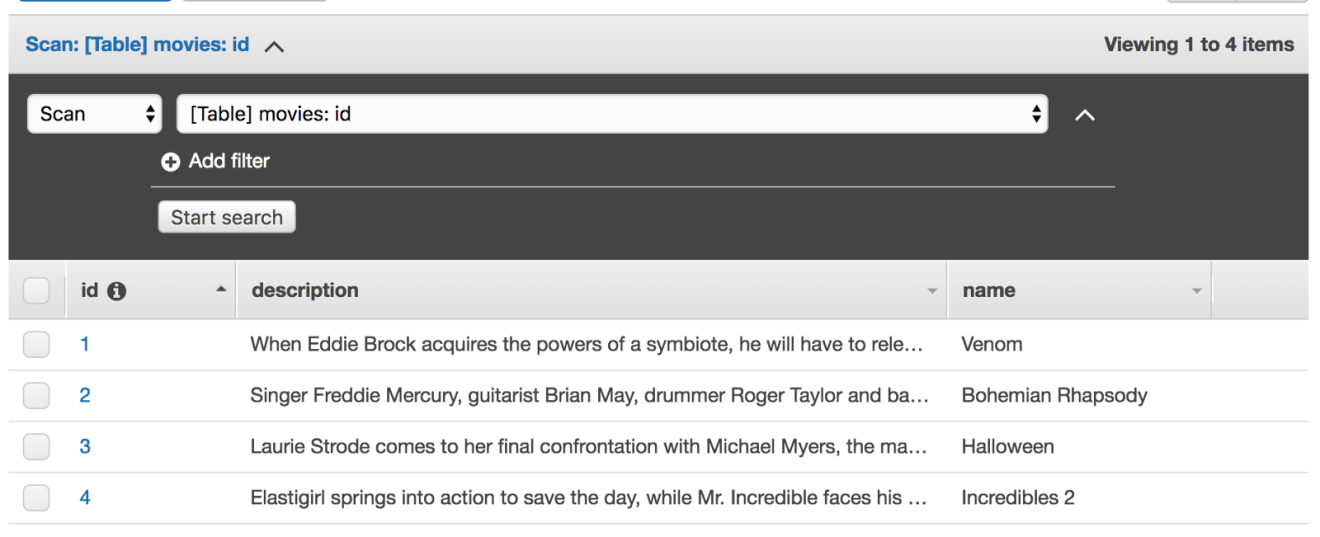
Navigate to the DynamoDB console and view the movies table to show that the request really was successfully processed:
Try to insert a new movie without giving a movie’s name attribute. The following error will returned:
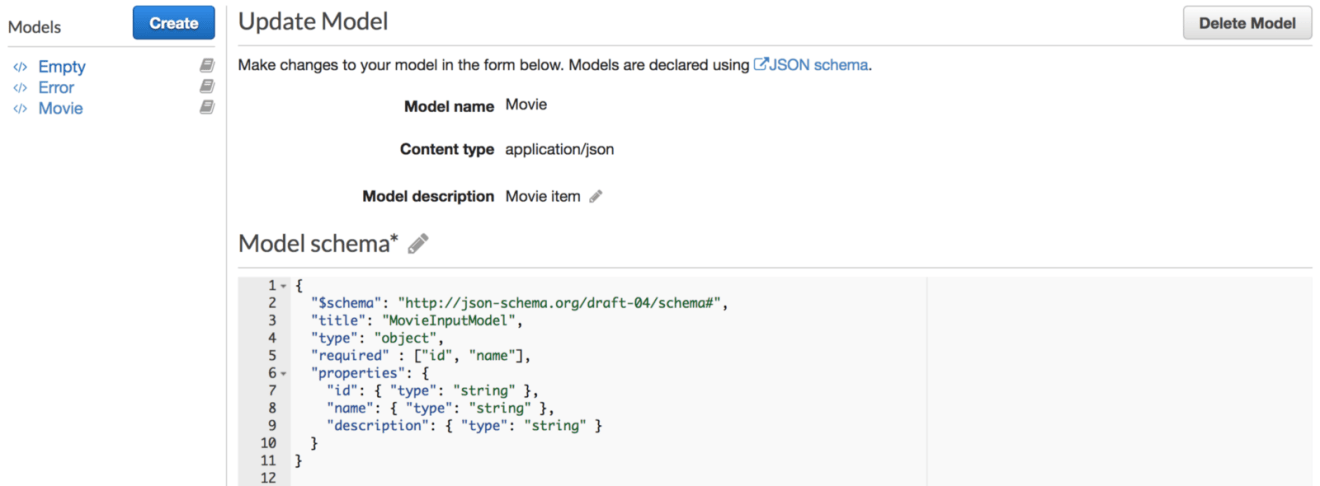
It’s a DynamoDB PutItem error. Fortuently, API Gateway allows you to validate your request body before invoking the downstream resources (In our example the DynamoDB table). To achieve this, we will use API Gateway Models. A Model defines the payload data structure. Models definitions are written using JSON Schema draft 4.
In the API Gateway, navigate to the Models tab and create a new model. Fill in the form as so:
The model above defines a movie entity with 3 attributes and requires id and name attributes to be defined (used during validation).
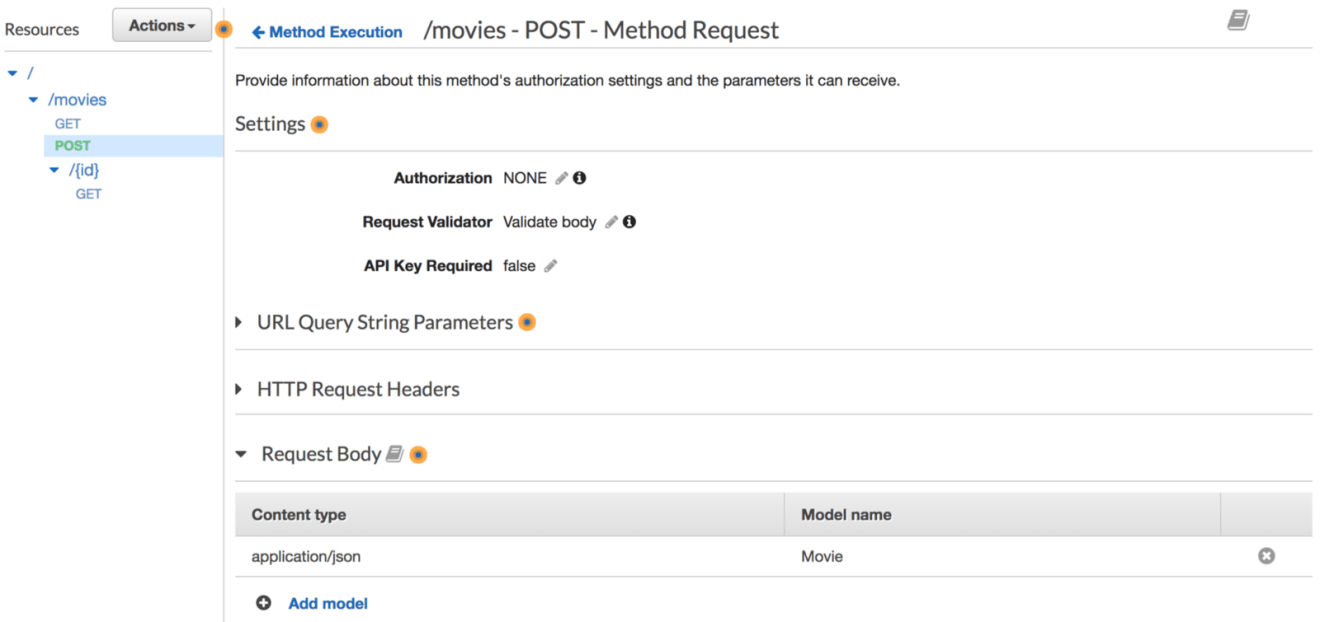
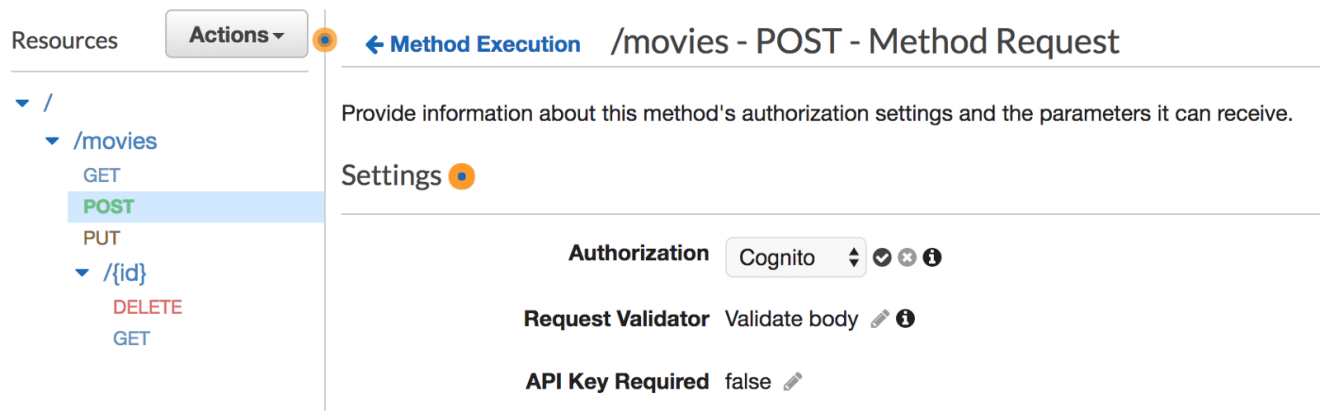
Head back to “Resources” page and click on “Method Request” from the POST method, enable the request validator option as below:
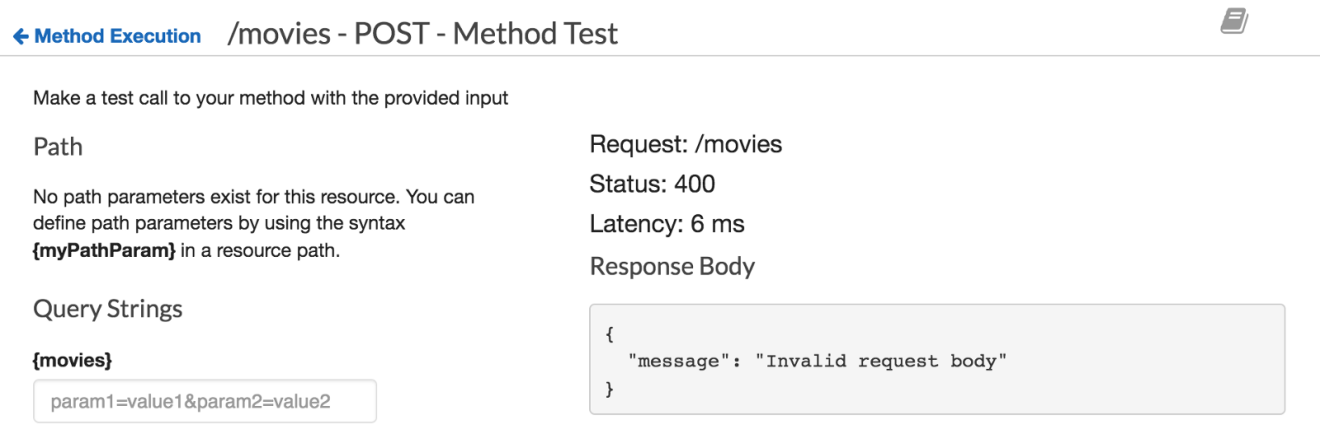
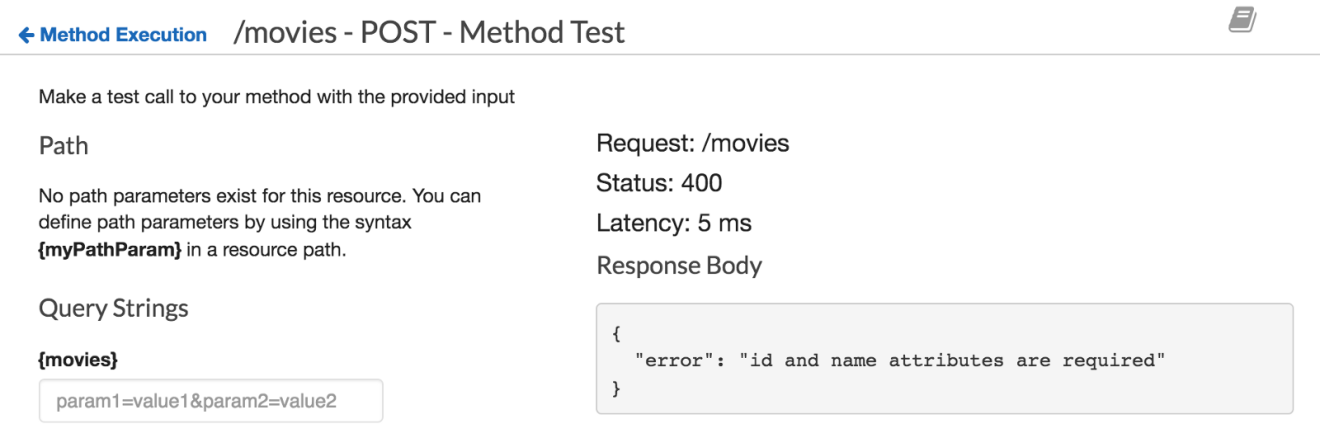
If you try to insert a new movie without providing the required parameters, a bad request message error will be returned:
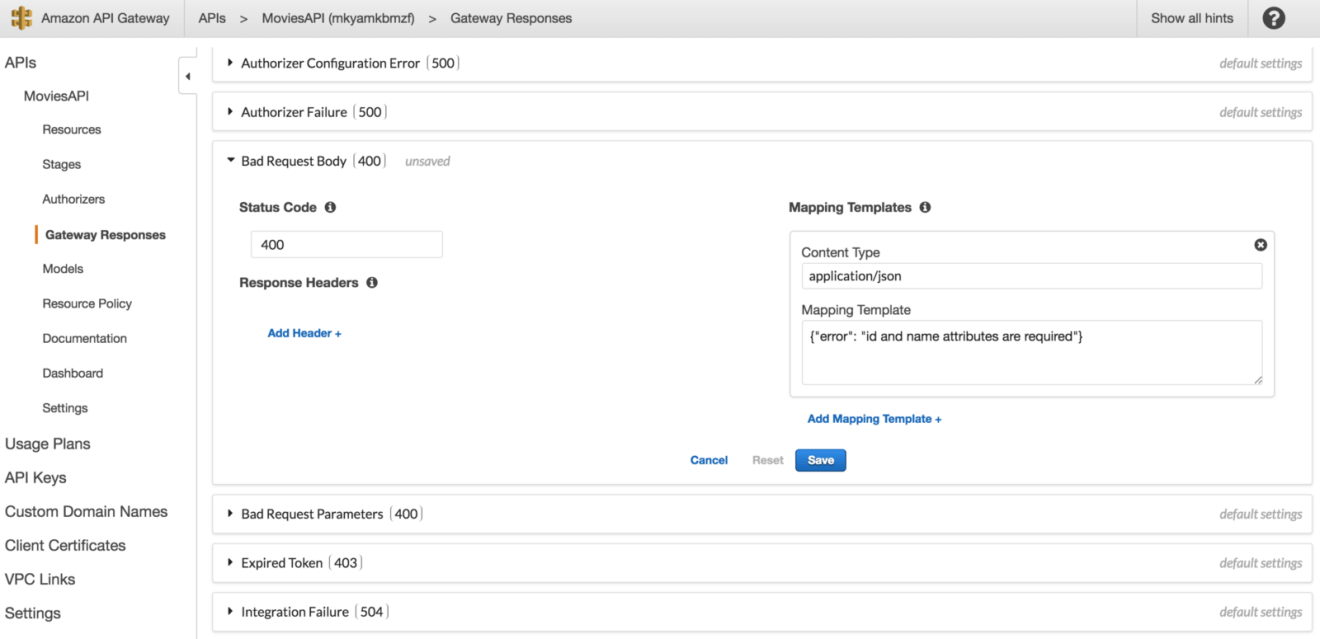
You can override the default 400 message from the “Gateway Responses” as follows:
As a result, the user defined error message will be returned:
Great! Try implementing the PUT and DELETE methods:
Authentication
The serverless API that we have built so far works like a charms. However, its open to the public, anyone can insert data into DynamoDB table if he/she has the API Gateway invocation URL. Luckily, API Gateway offers two ways to handle authentication:
API Gateway Authentication with Cognito and Lambda Authorizer
AMAZON COGNITO
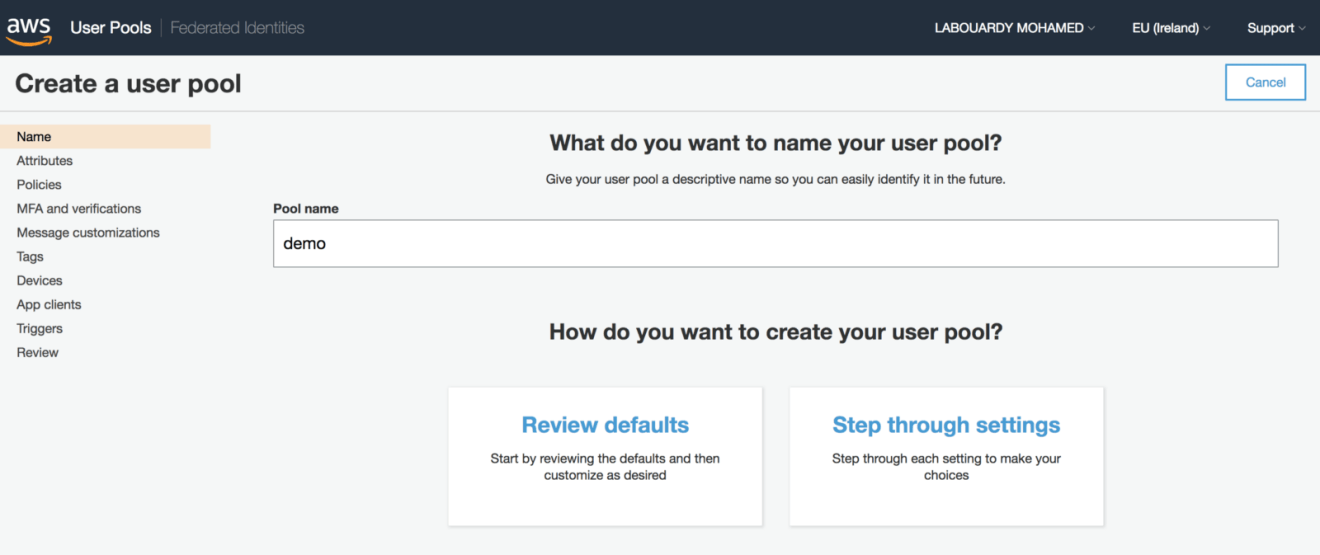
Create a new user pool, click on “Review defaults” to create a pool with default settings. A success message should be displayed at the end of the creation process:
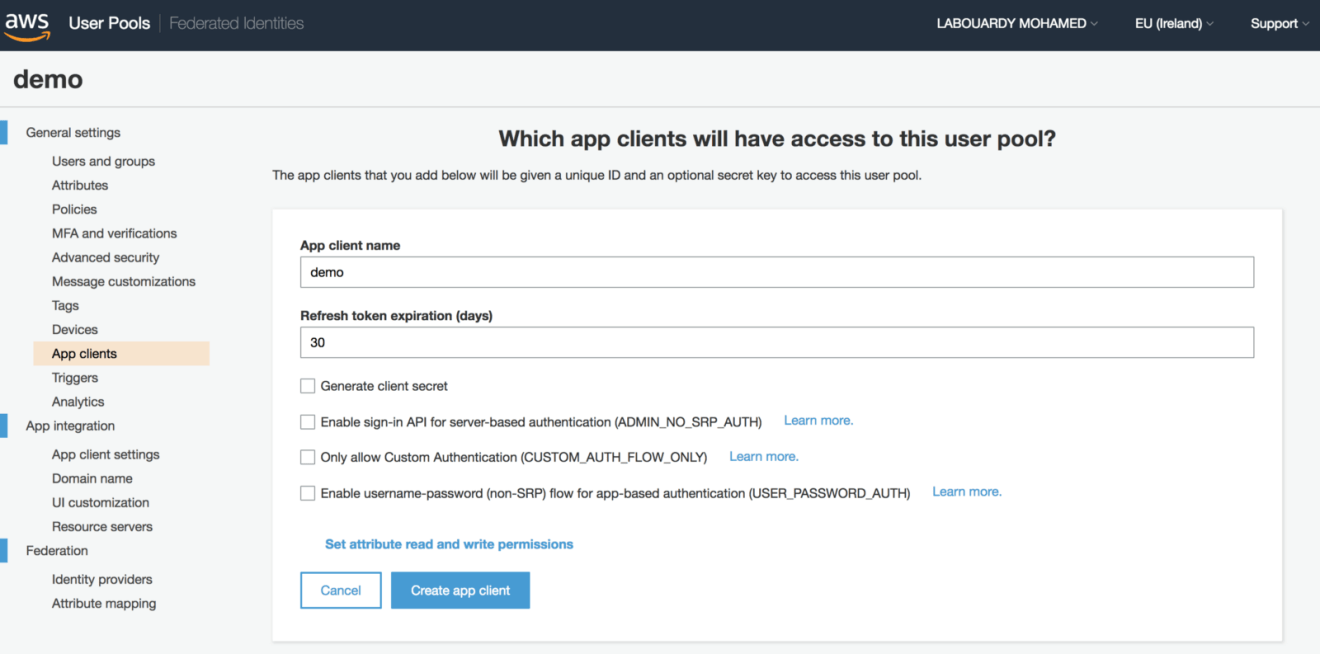
After creating your first user pool, register your serverless API from “App clients” under “General settings” and select “Add an app client”. Give the application a name and check the server-based authentication ADMIN_NO_SRP_AUTH option:
Now that the user pool has been created, we can configure the API Gateway to validate access tokens from a successful user pool authentication before granting access to DynamoDB.
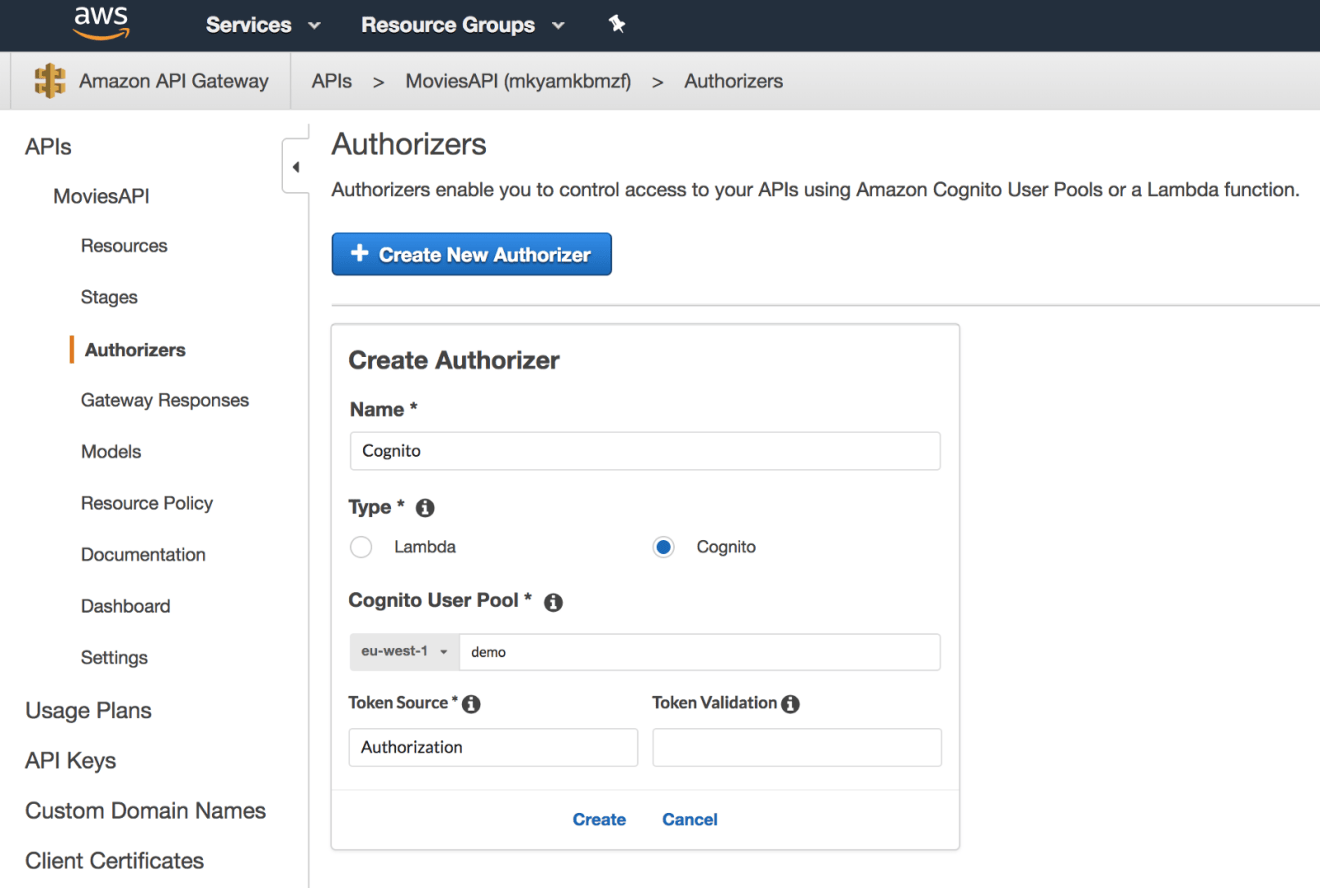
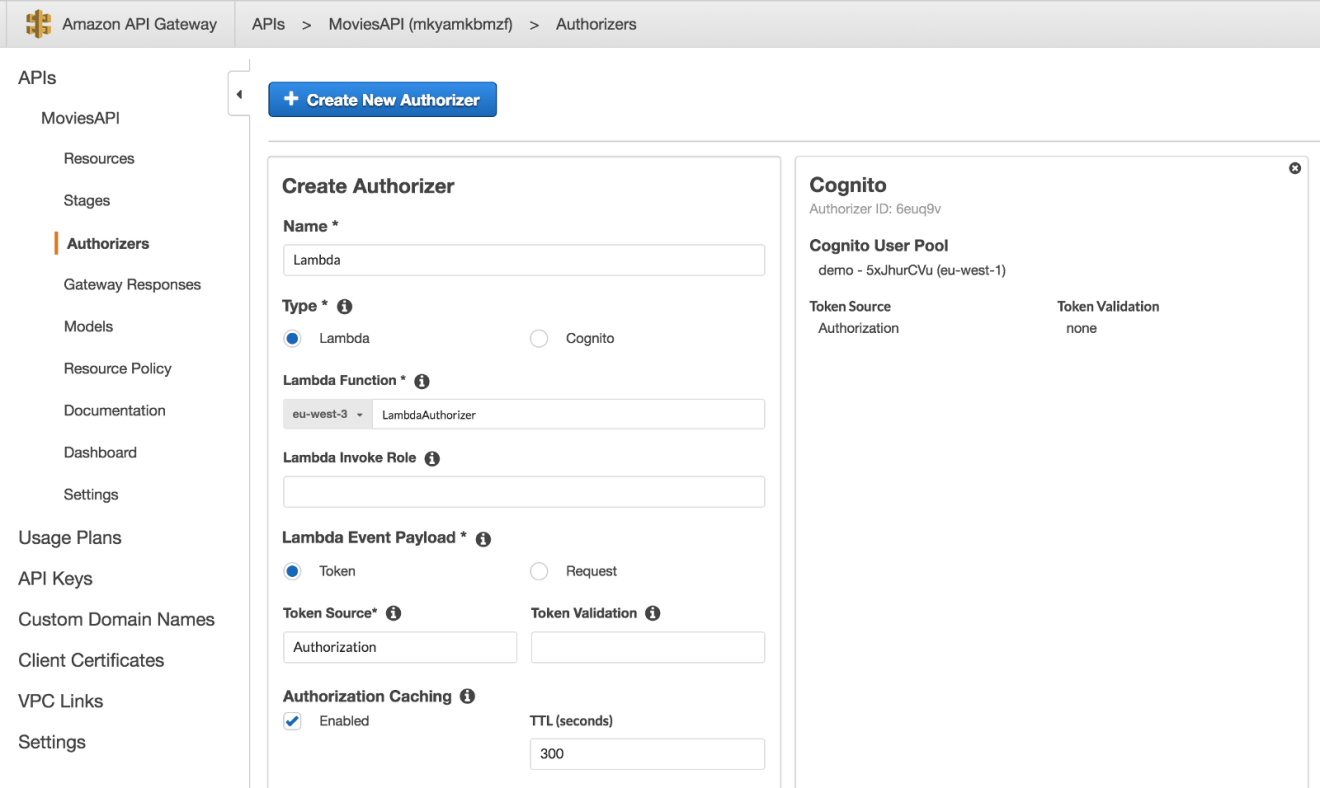
To begin securing API access, go to API Gateway console, choose the RESTful API that we built in the previously, and click on “Authorizers” from the navigation bar. Click on the “Create New Authorizer” button and select “Cognito”. Then, select the user pool that we created earlier and set the token source field to Authorization. This defines the name of the incoming request header containing the API caller’s identity token for Authorization:
You can now secure all of the endpoints, for instance, in order to secure the endpoint responsible for creating an new movie. Click on the corresponding POST method under the /movies resource. Click on the “Method Request” box, then on “Authorization”, and select the user pool we created previously:
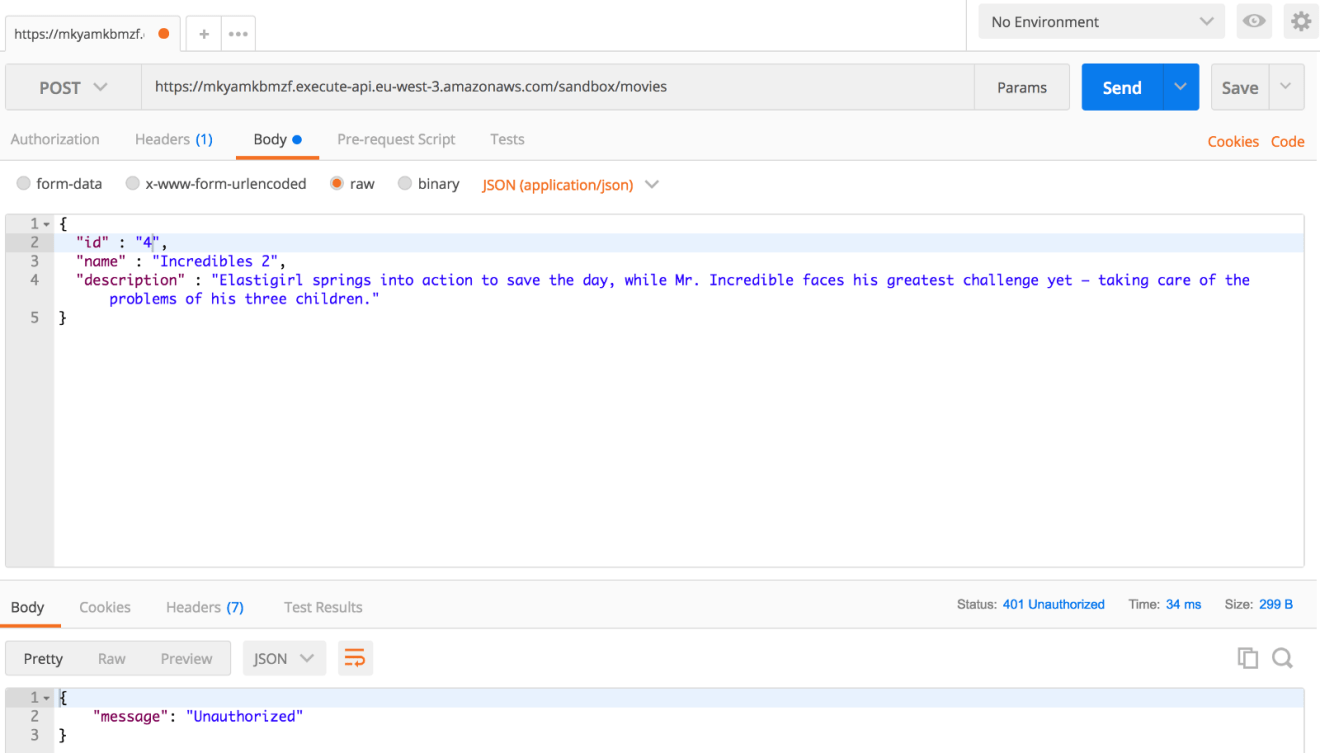
Once done, redeploy the API and try to insert a new movie using the API invocation URL. This time, the endpoint is secured and requires authentication:
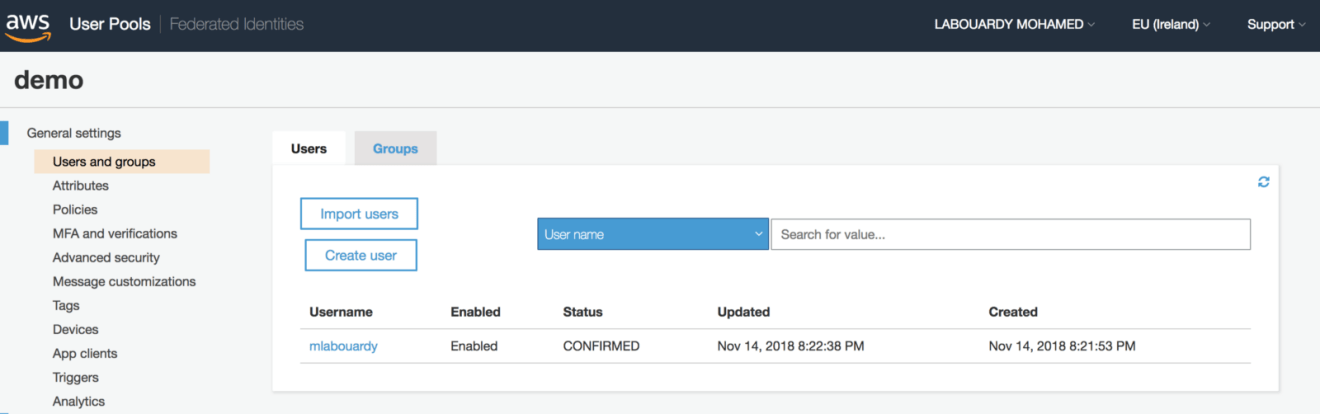
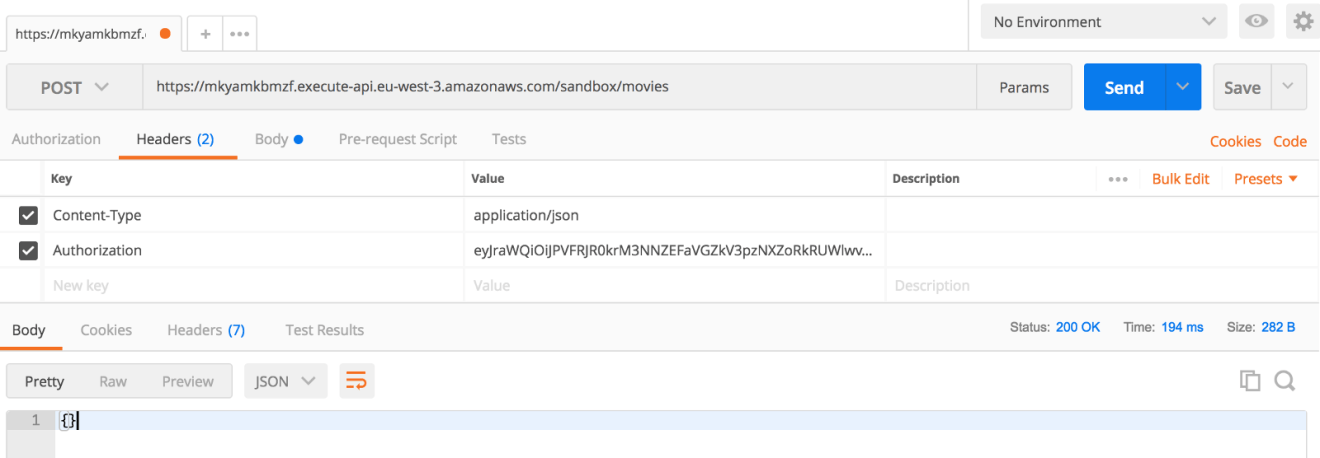
In order to authenticate, we need to obtain an identity token for the signed-in user from the the user pool and include the identity token in the Authorization header for the API Gateway requests. Issue the following AWS CLI command to get a new token:
Copy the ID token and add it to the Authorization header of your request:
The API Gateway will verify the token and will invoke the PutItem operation on the movies table, which will insert a new movie into the table:
LAMBDA AUTHORIZER
When a client sends a request to your API, it will go through the API Gateway, which will extracts the token from the request and calls your Lambda function authorizer with it. The function evaluates the token, generates a policy and sends it back to API Gateway. API Gateway evaluates the policy and invoke the DynamoDB action registered for the API endpoint.
For the sake of simplicity, our function will verify if the token provided by the client equals to our secret (environment variable) and returns a policy document based on the result. The following is the function handler source code written in Node.JS:
Head back to API Gateway and created a new “Lambda Authorizer” and set Authorization to be the header API Gateway will extract the token from:
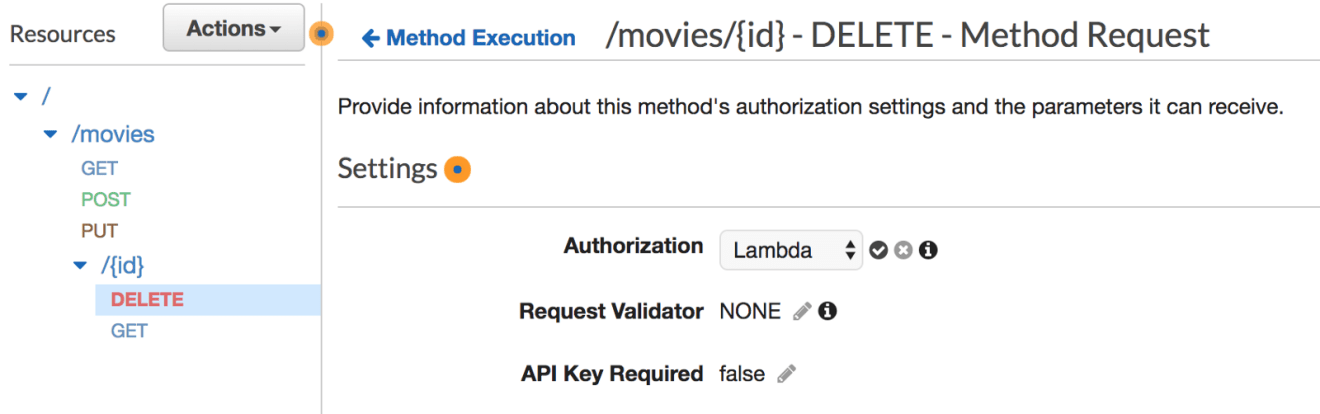
Choose the method you want to secure, let’s say, it will be the endpoint responsible of deleting a movie from the table. Click on “Method Request” and under Authorization select your new authorizer:
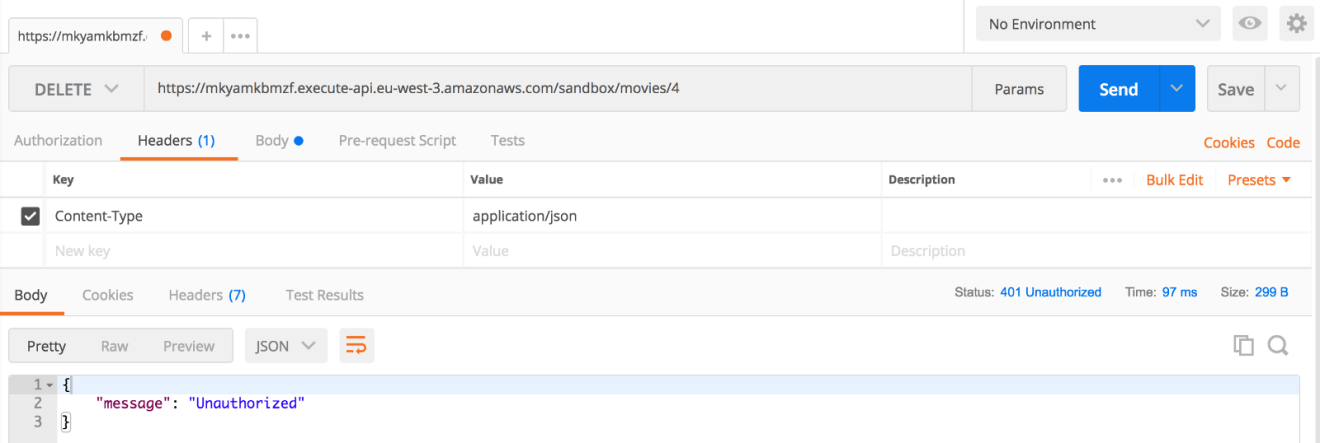
Let’s try calling the endpoint, As expected, we’re not getting through to our real endpoint:
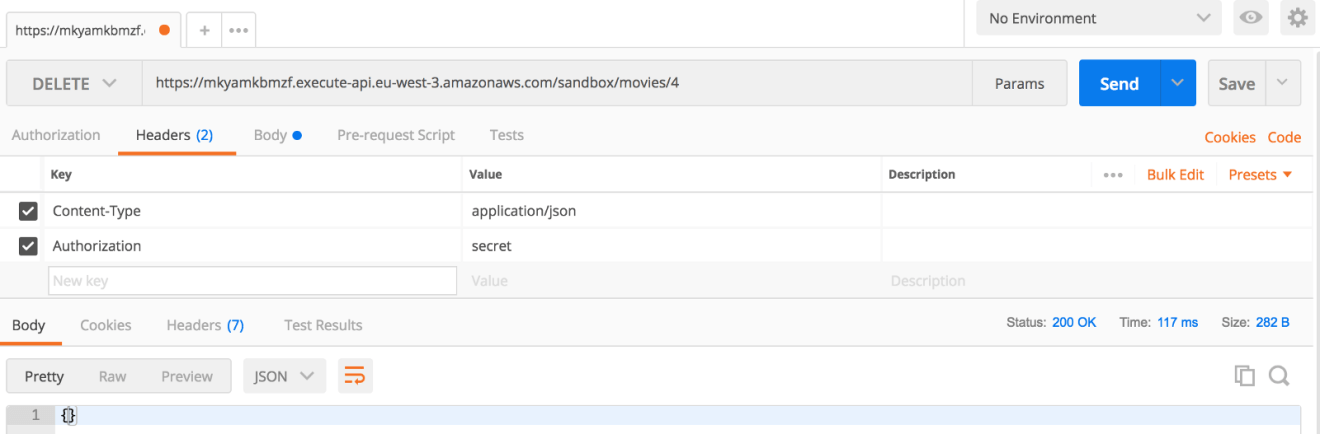
If you include the secret token to the Authorization header of your request, you should be able to delete an item:
Looks good!
API Throttling
You can use usage plans combined with API keys to set method-level throttling limits for your API and define how much and how fast clients can access your API (request rates and quotas).
The following procedure describes how to create a usage plan:
API USAGE
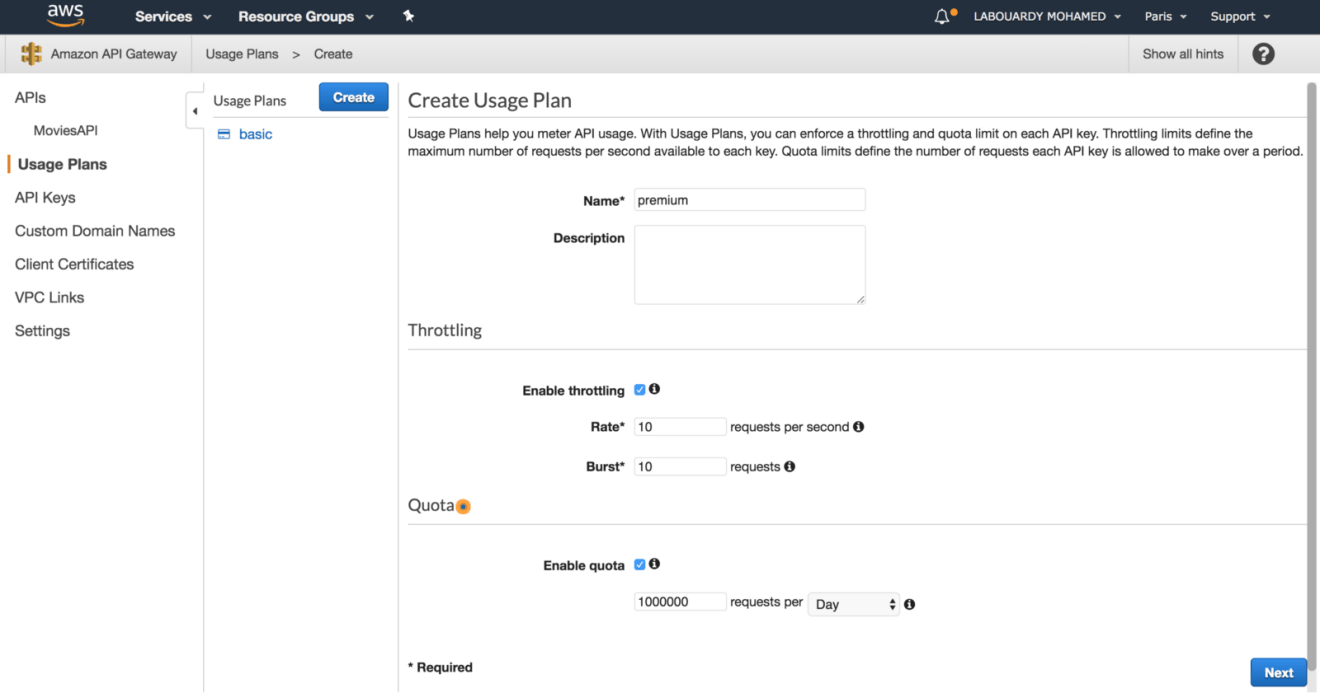
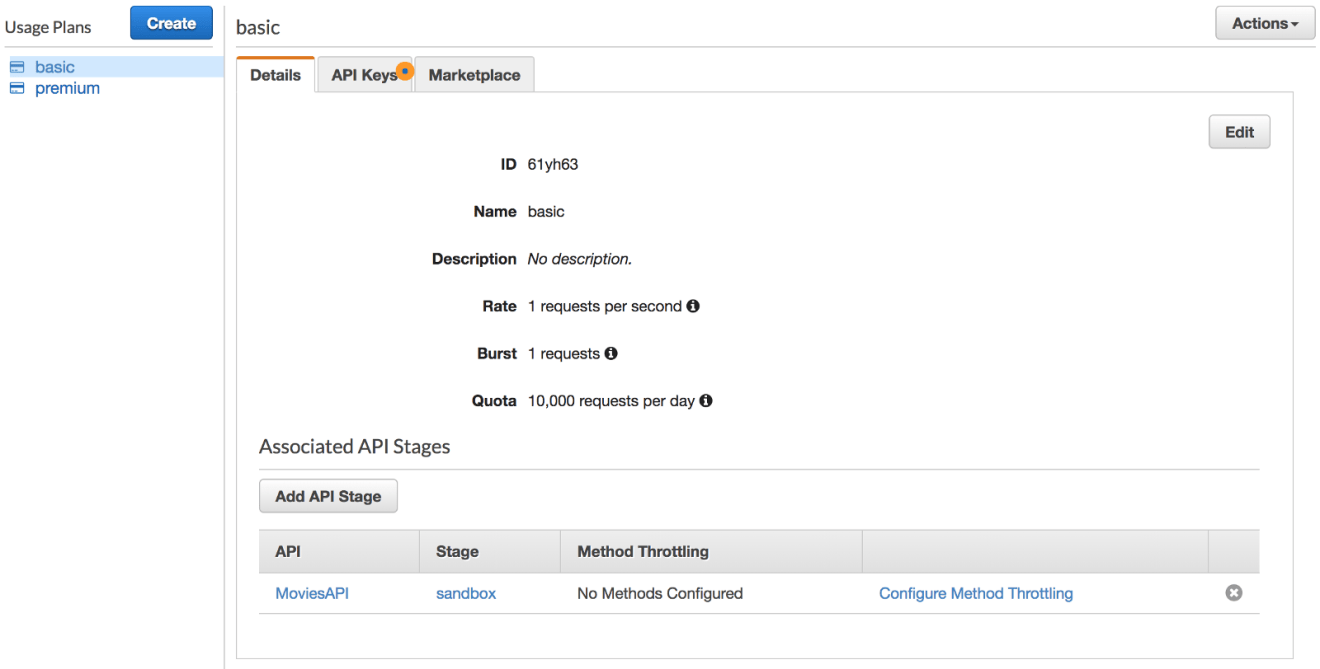
Create a usage plan called basic, with a throttling limit of 1 request per second and quota limit of 10000 requests per day:
Create a 2nd usage plan called premium, with a throlling limit of 10 requests per second and a quota limit of 1 million requests per day:
API KEYS
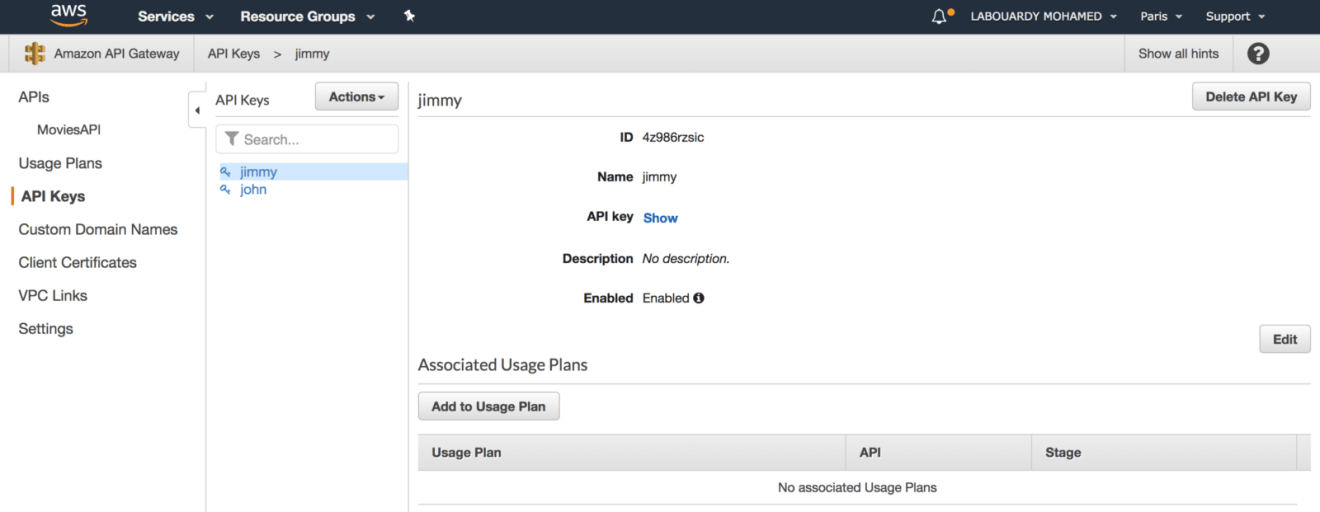
Next, create two API keys:
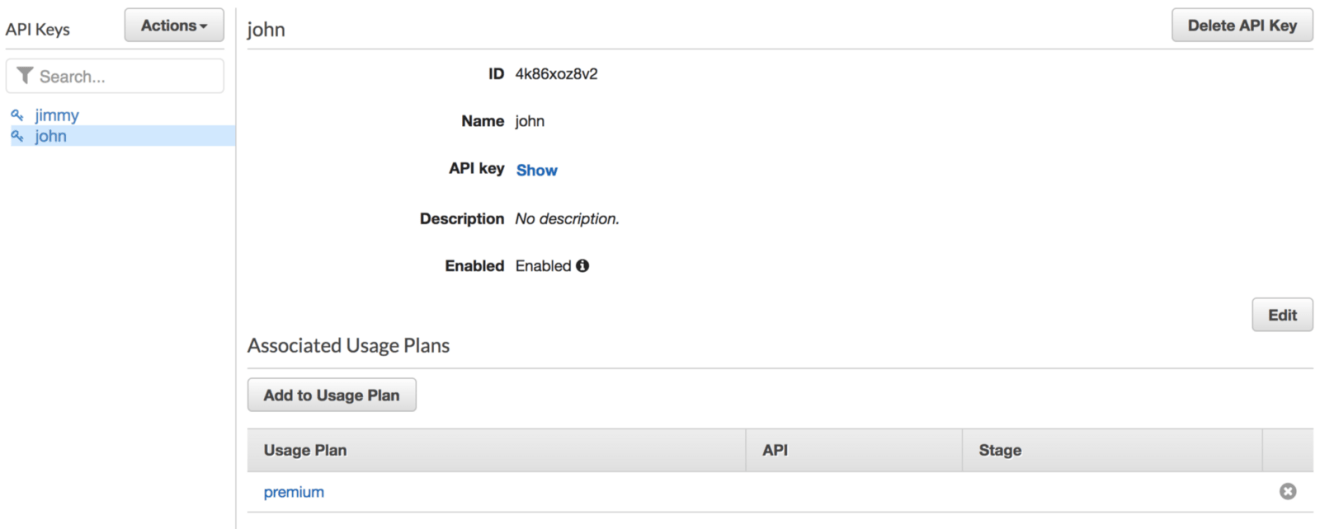
Assign the first API key to basic usage plan and second key to premium usage plan:
Associate the usage plans we created to the API deployment stage:
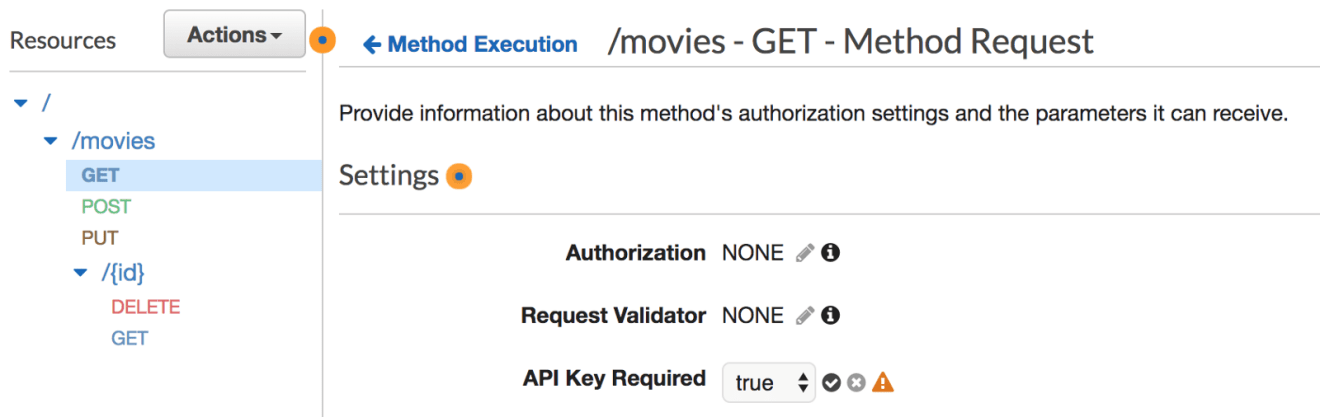
Configure an API method to require an API key:
Deploy or redeploy the API for the requirement to take effect:
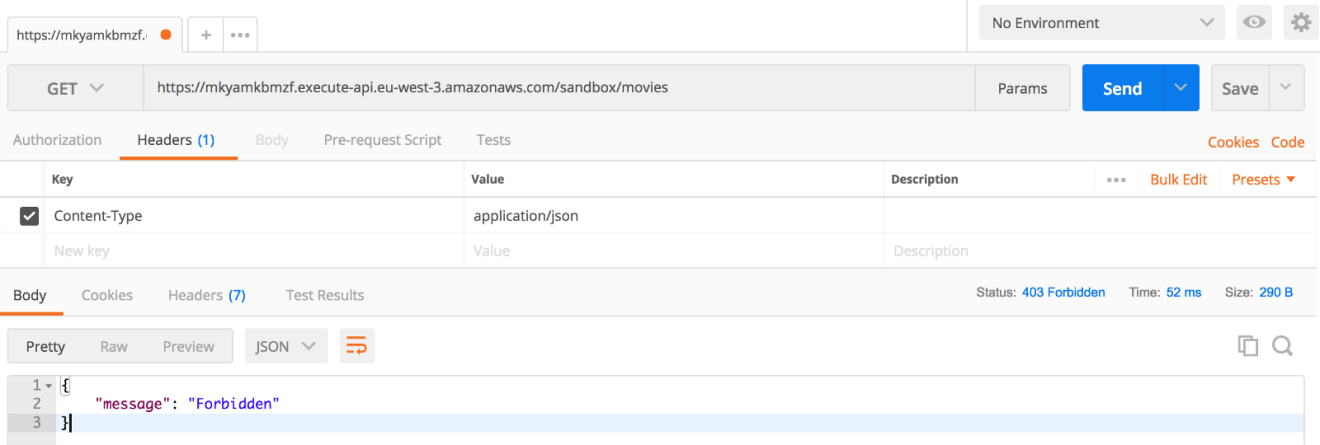
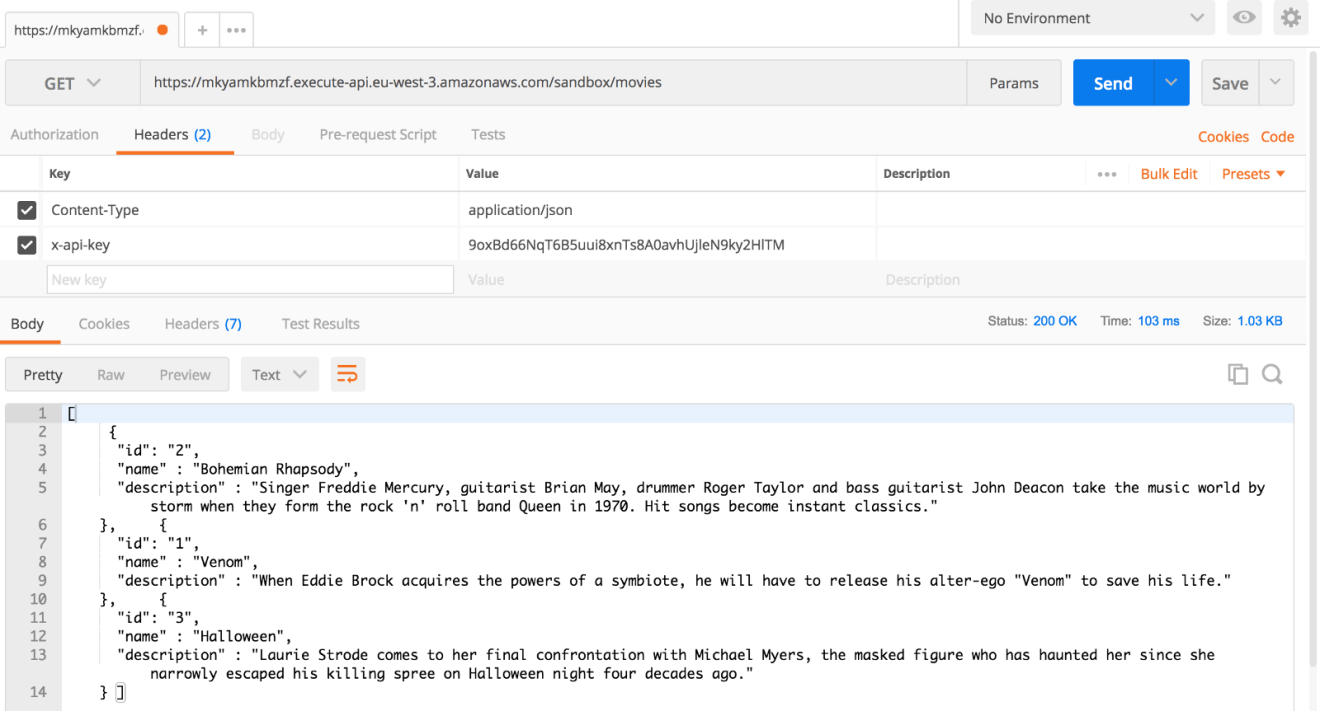
Now if you added the x-api-key header. If all goes well you will receive output like this:
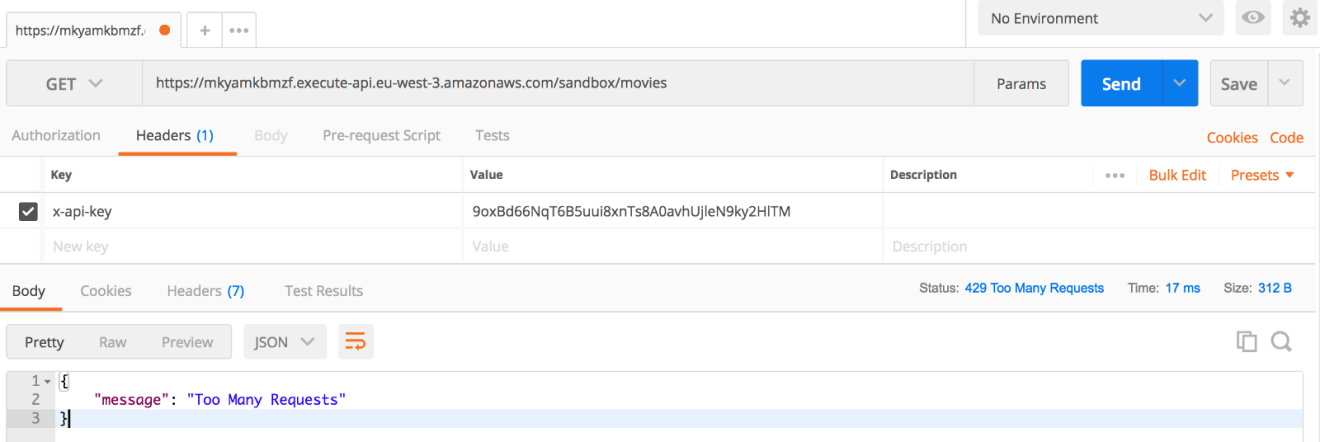
If you exceed the rate limit or quota limit associated with your API key, a “Too many requests” HTTP error will be returned:
Custom Domains
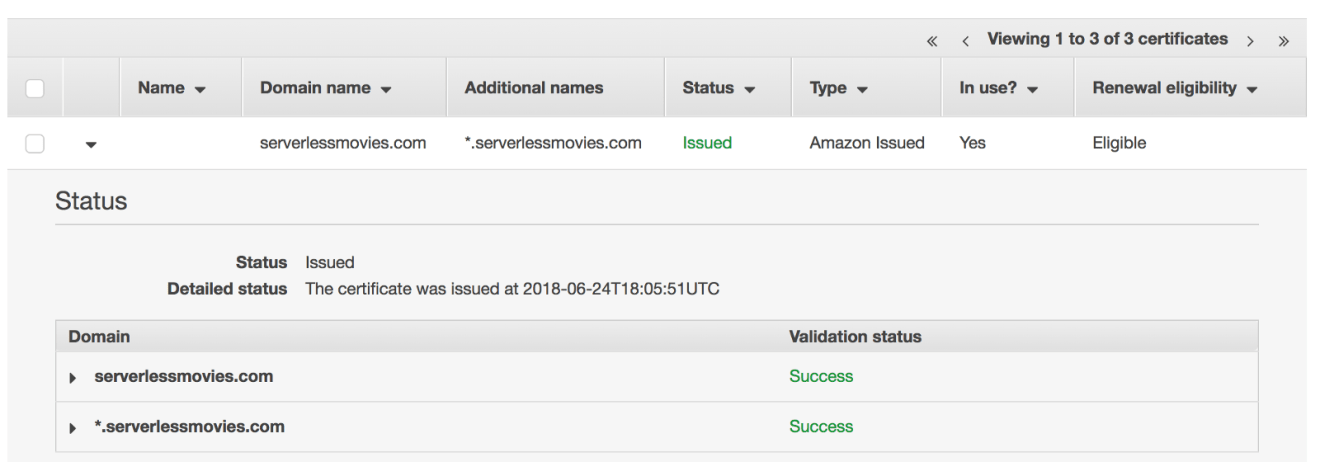
You can use your own domain name for an API and deployment stage, create a Custom Domain Name backed by an ACM (Amazon Certificate Manager) certificate:
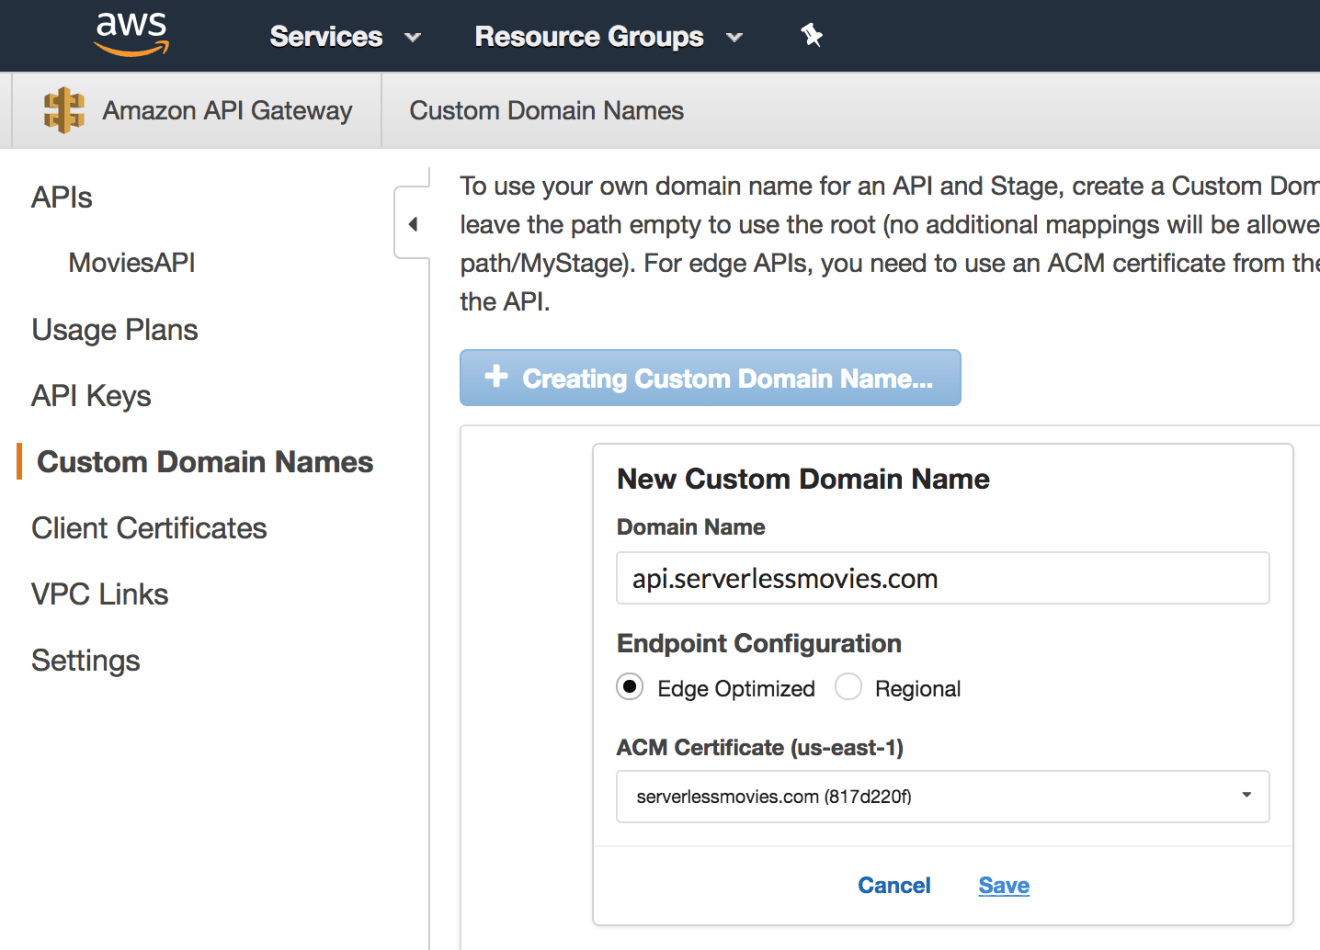
Create a new custom domain name from API Gateway Console:
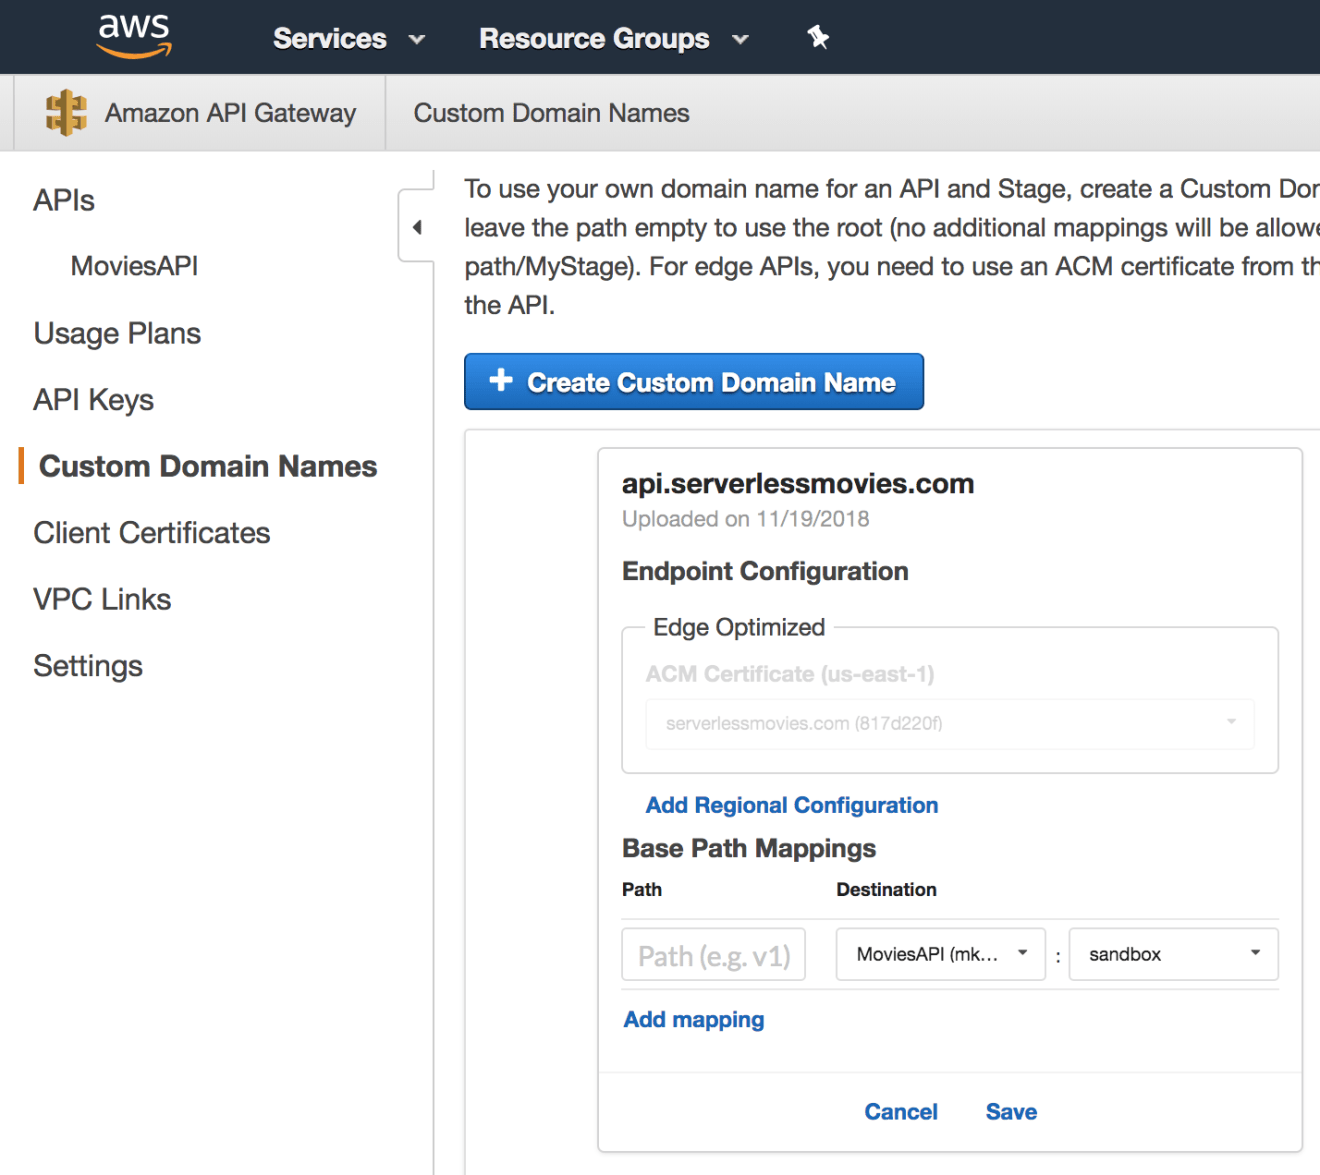
Add a path mapping to map your domain name to your API deployment stage:
Before finishing this guide, we will go through how to create documentation for the serverless API we’ve built so far.
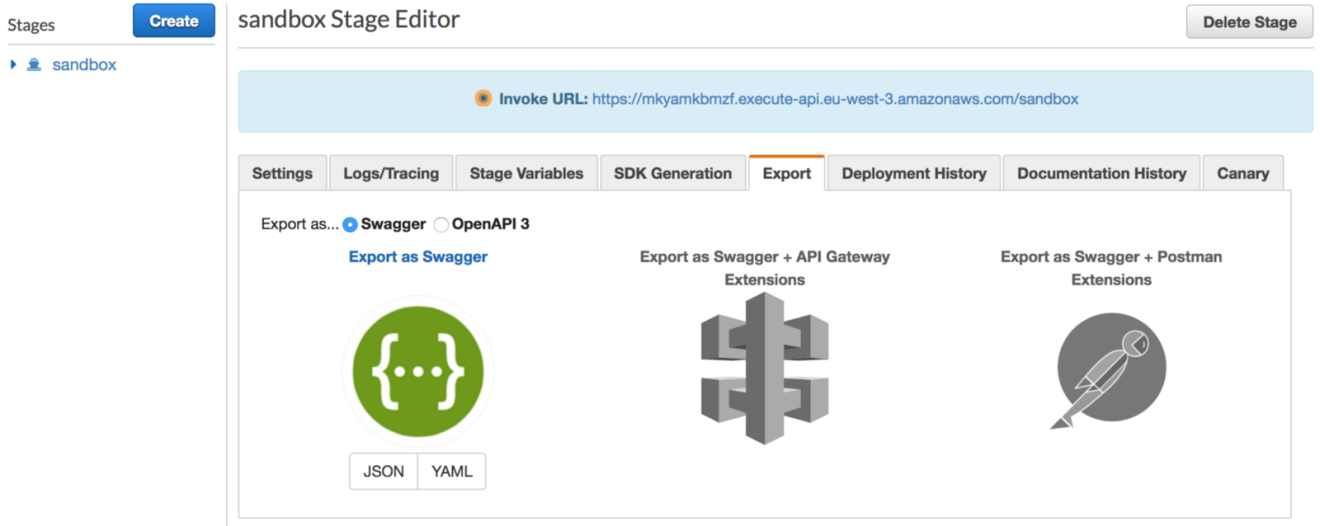
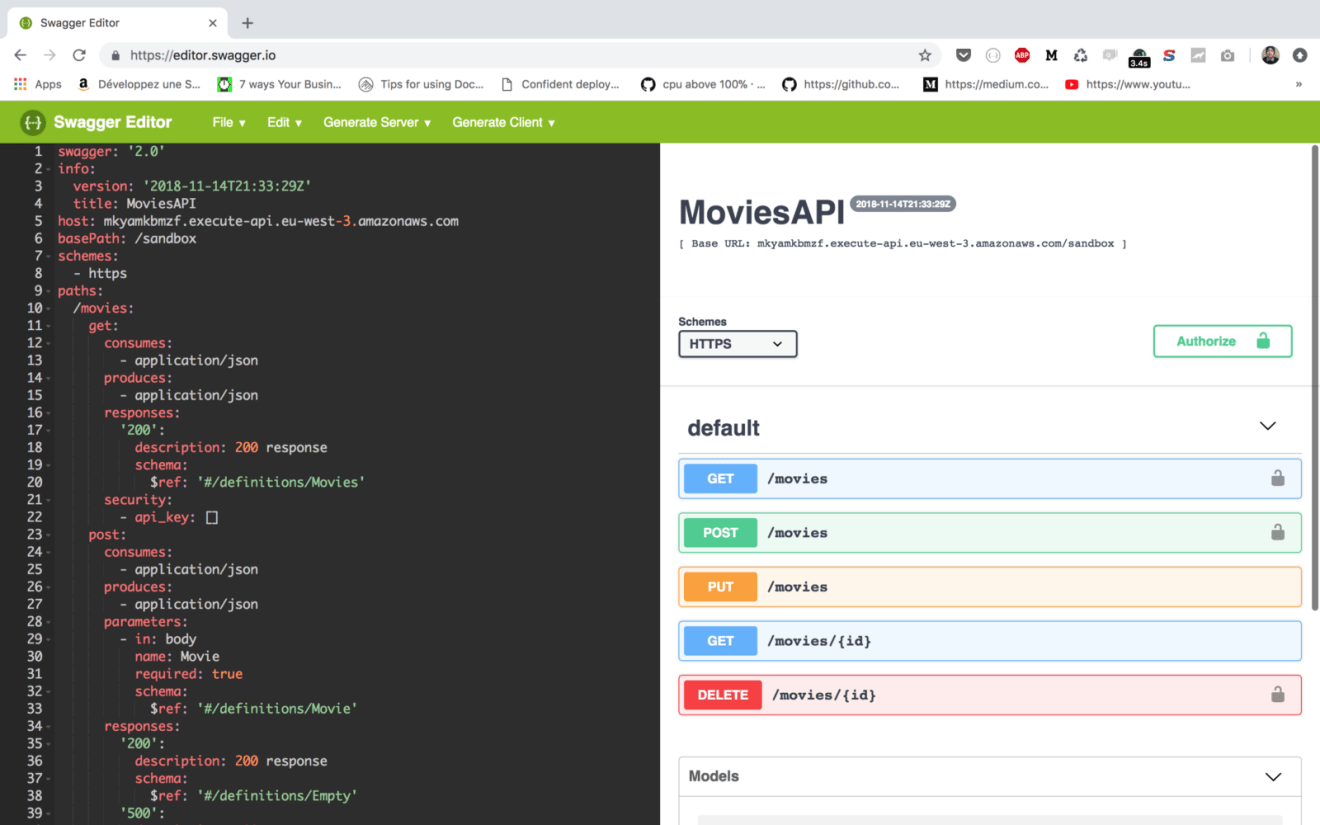
On the API Gateway console, select the deployment stage that you’re interested in generating documentation for. In the following example, I chose the sandbox environment. Then, click on the Export tab and click on the Export as Swagger section:
Swagger is an implementation of the OpenAPI, which is a standard defined by the Linux Foundation on how to describe and define APIs. This definition is called the OpenAPI specification document.
You can save the document in either a JSON or YAML file. Then, navigate to https://editor.swagger.io/ and paste the content on the website editor, it will be compiled and an HTML page will be generated as follows:
Like what you’re reading? Check out my book and learn how to build, secure, deploy and manage production-ready Serverless applications in Golang with AWS Lambda.
Drop your comments, feedback, or suggestions below — or connect with me directly on Twitter @mlabouardy.
Serverless architecture is popular in the tech community due to AWS Lambda. Go is simple to learn, straightforward to work with, and easy to read for other developers; and now it’s been heralded as a supported language for AWS Lambda. This book is your optimal guide to designing a Go serverless application and deploying it to Lambda.
This book starts with a quick introduction to the world of serverless architecture and its benefits, and then delves into AWS Lambda using practical examples. You’ll then learn how to design and build a production-ready application in Go using AWS serverless services with zero upfront infrastructure investment. The book will help you learn how to scale up serverless applications and handle distributed serverless systems in production. You will also learn how to log and test your application.
Along the way, you’ll also discover how to set up a CI/CD pipeline to automate the deployment process of your Lambda functions. Moreover, you’ll learn how to troubleshoot and monitor your apps in near real-time with services such as AWS CloudWatch and X-ray. This book will also teach you how to secure the access with AWS Cognito.
By the end of this book, you will have mastered designing, building, and deploying a Go serverless application.
Hands-On Serverless Applications with Go is available at the online stores below:
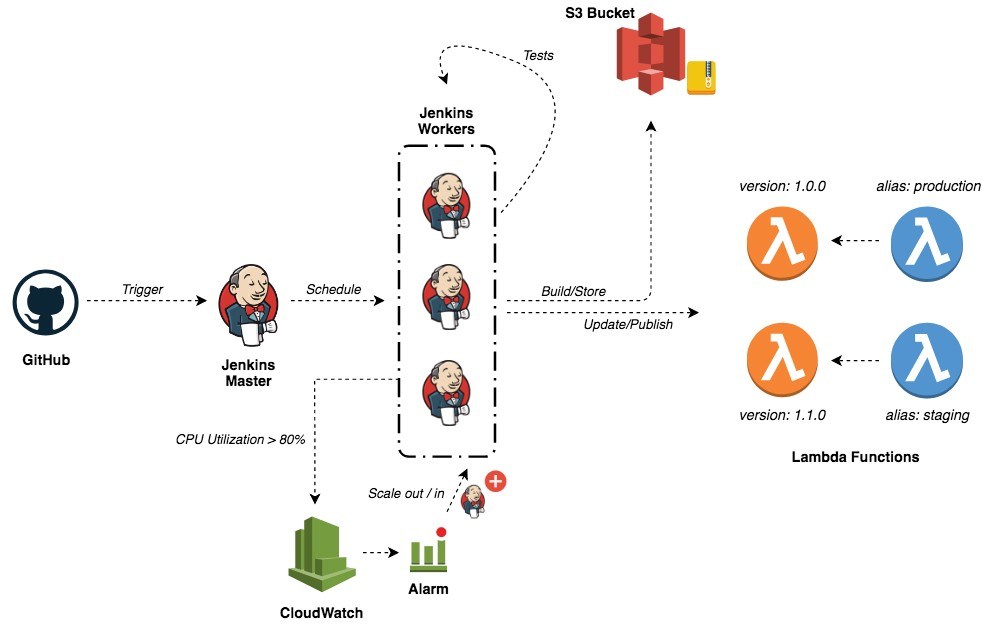
The following post will walk you through how to build a CI/CD pipeline to automate the deployment process of your Serverless applications and how to use features like code promotion, rollbacks, versions, aliases and blue/green deployment. At the end of this post, you will be able to build a pipeline similar to the following figure:
For the sake of simplicity, I wrote a simple Go based Lambda function that calculates the Fibonacci number:
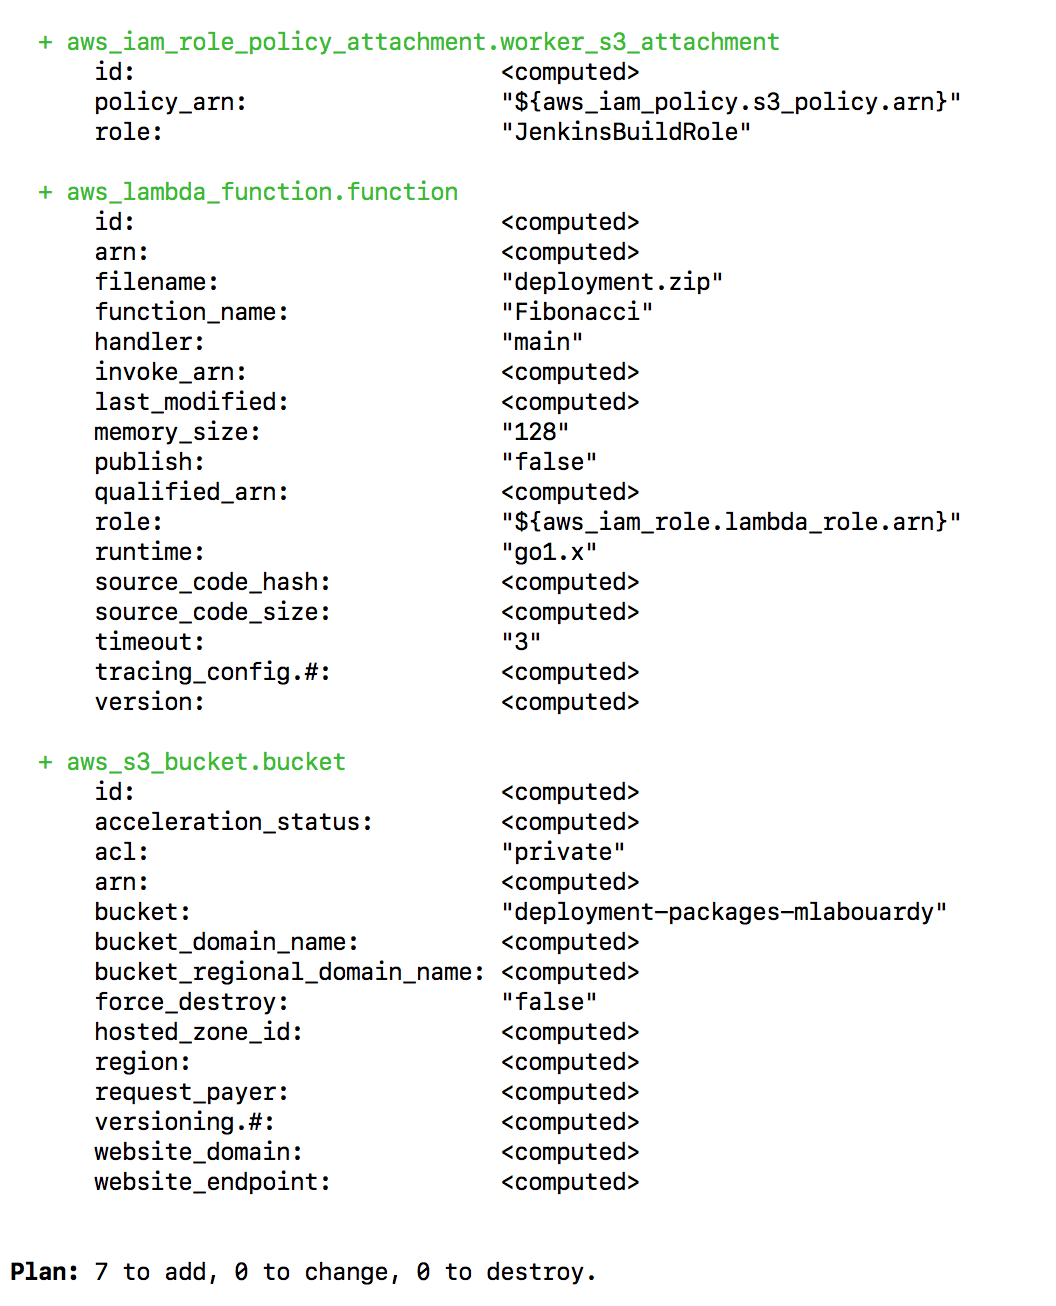
To create the function in AWS Lambda and all the necessary AWS services, I used Terraform. An S3 bucket is needed to store all the deployment packages generated through the development lifecycle of the Lambda function:
The build server needs to interact with S3 bucket and Lambda functions. Therefore, an IAM instance role must be created with S3 and Lambda permissions:
Next, build the deployment package with the following commands:
1 2 3 4
# Build linux binary GOOS=linux go build -o main main.go # Create a zip file zip deployment.zip main
Then, issue the terraform apply command to create the resources:
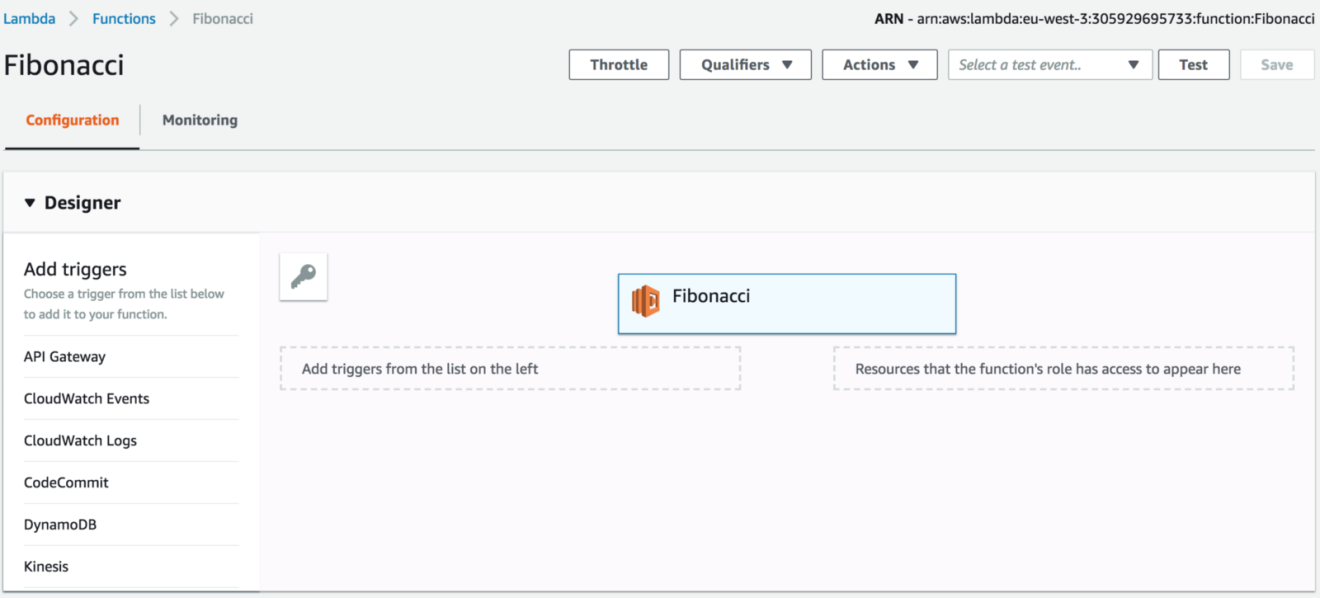
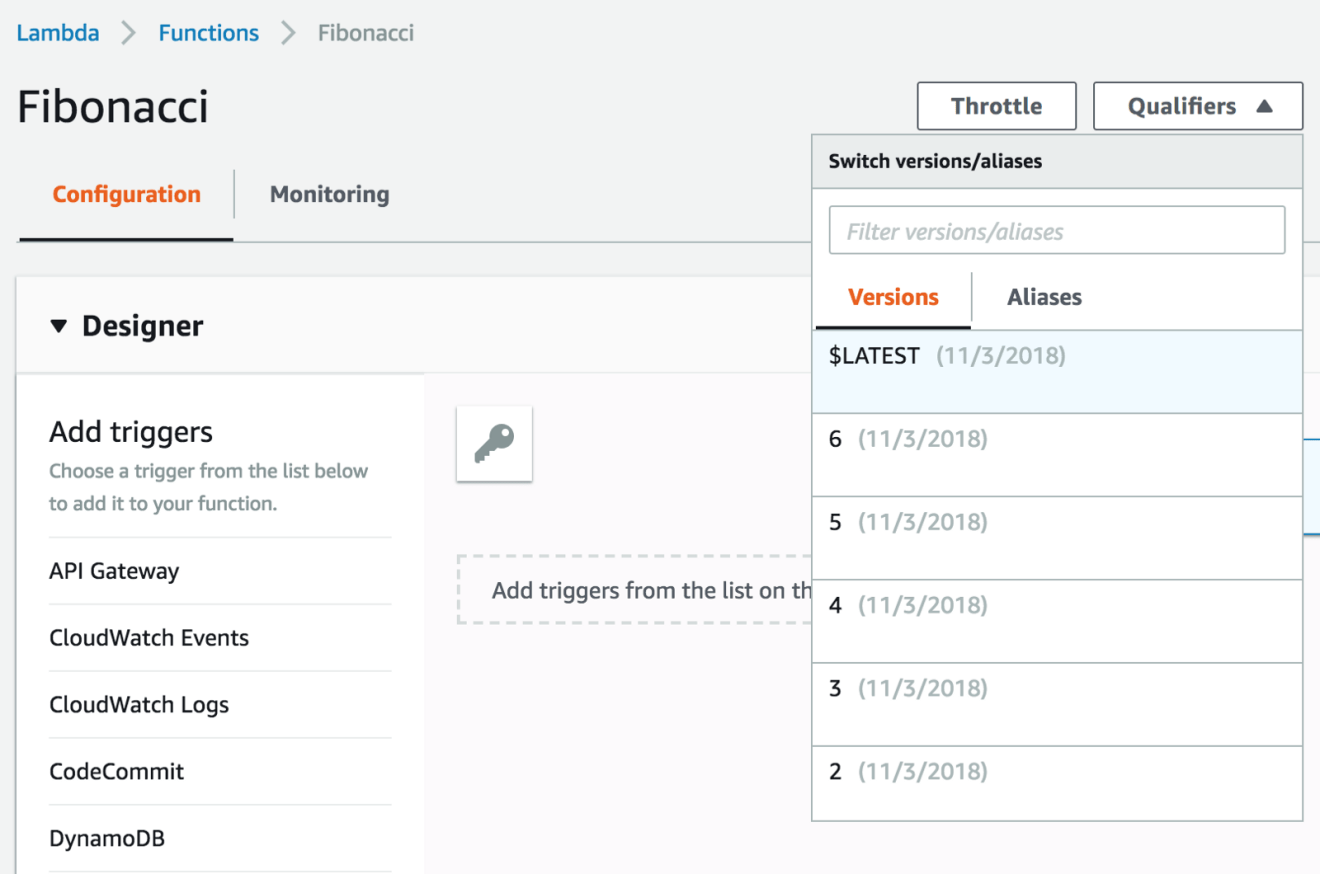
Sign in to AWS Management Console and navigate to Lambda Console, a new function called “Fibonacci” should be created:
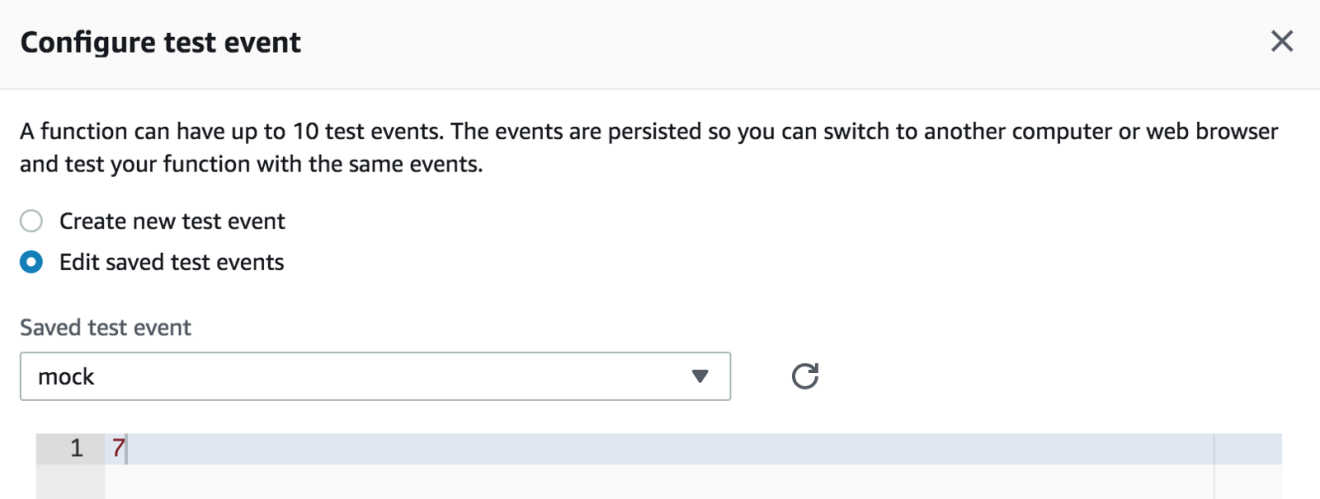
You can test it out, by mocking the input from the “Select a test event” dropdown list:
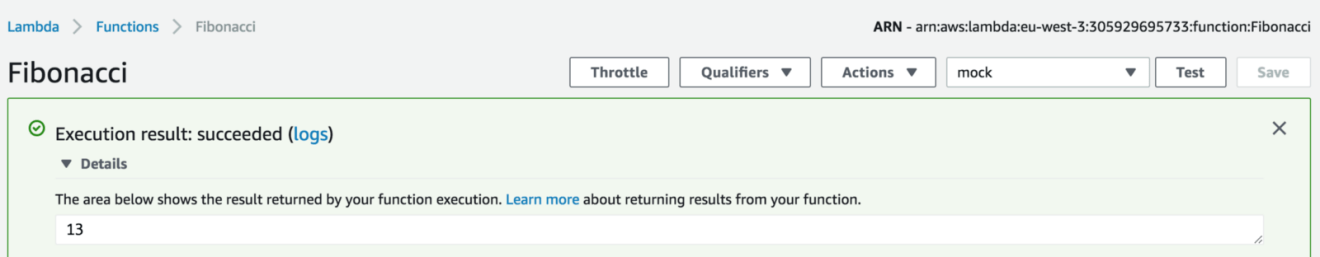
If you click on “Test” button the Fibonacci number of 7 will be returned:
So far our function is working as expected. However, how can we ensure each changes to our codebase doesn’t break things ? That’s where CI/CD comes into play, the idea is making all code changes and features go through a complex pipeline before integrating them to the master branch and deploying it to production.
You need a Jenkins cluster with at least a single worker (with Go preinstalled), you can follow my previous post for a step by step guide on how to build a Jenkins cluster on AWS from scratch.
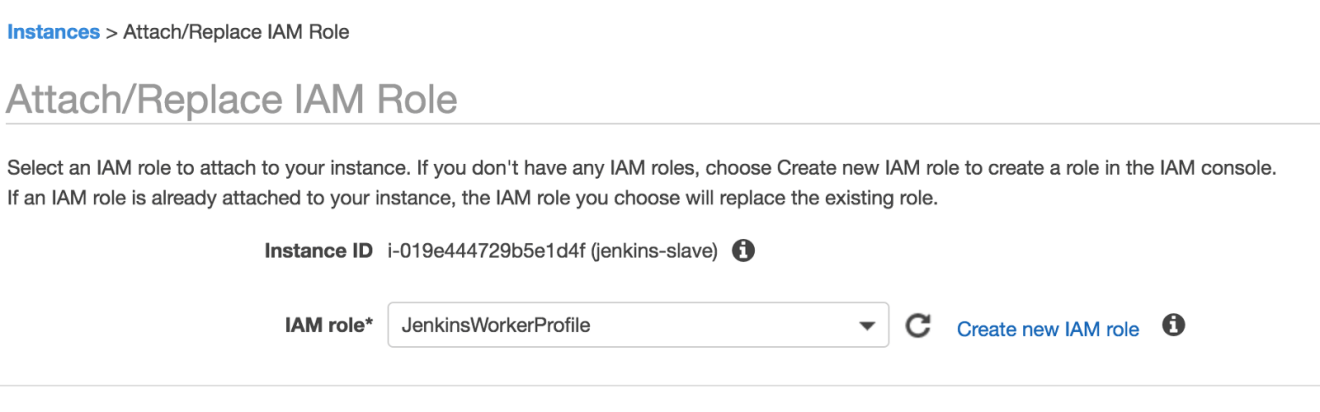
Prior to the build, the IAM instance role (created with Terraform) with the write access to S3 and the update operations to Lambda must be configured on the Jenkins workers:
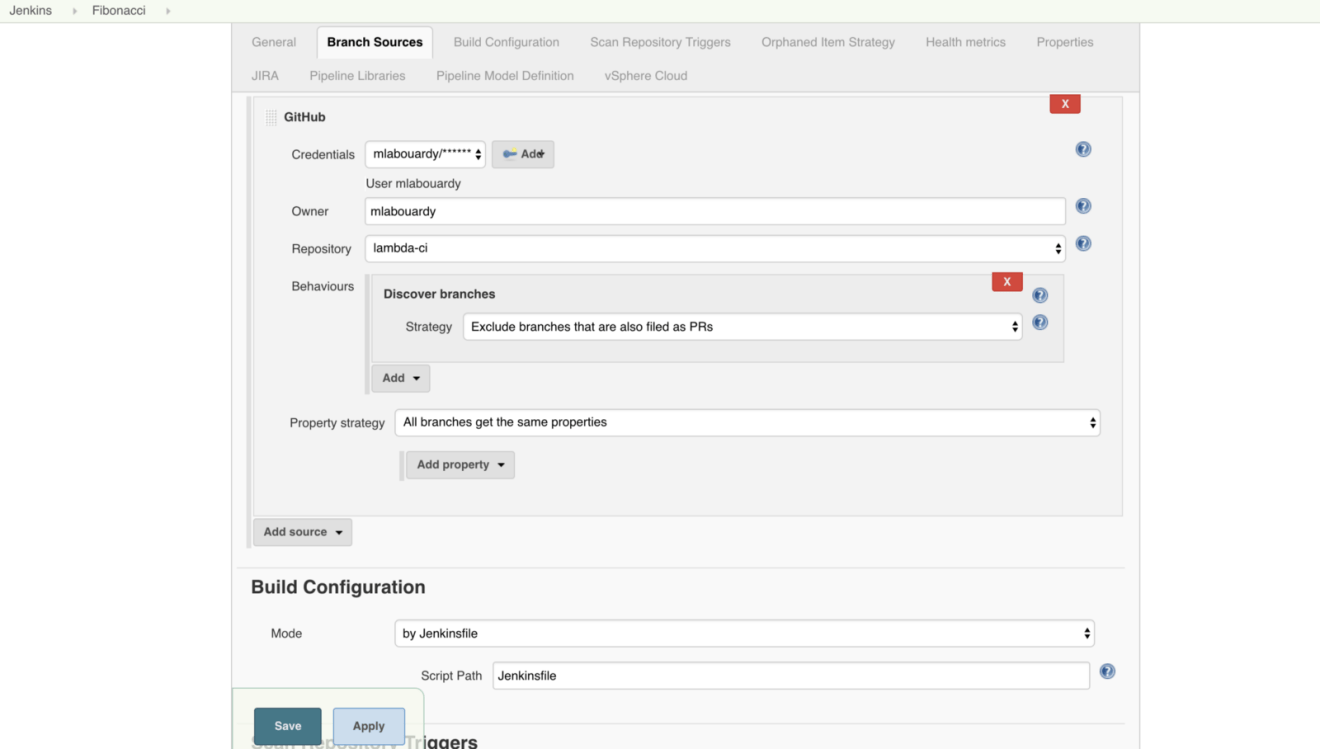
Jump back to Jenkins Dashboard and create new multi-branch project and configure the GitHub repository where the code source is versioned as follows:
Create a new file called Jenkinsfile, it defines a set of steps that will be executed on Jenkins (This definition file must be committed to the Lambda function’s code repository):
Test: check whether our code is well formatted and follows Go best practices and run unit tests.
Build: build a binary and create the deployment package.
Push: store the deployment package (.zip file) to an S3 bucket.
Deploy: update the Lambda function’s code with the new artifact.
Note the usage of the git commit ID as a name for the deployment package to give a meaningful and significant name for each release and be able to roll back to a specific commit if things go wrong.
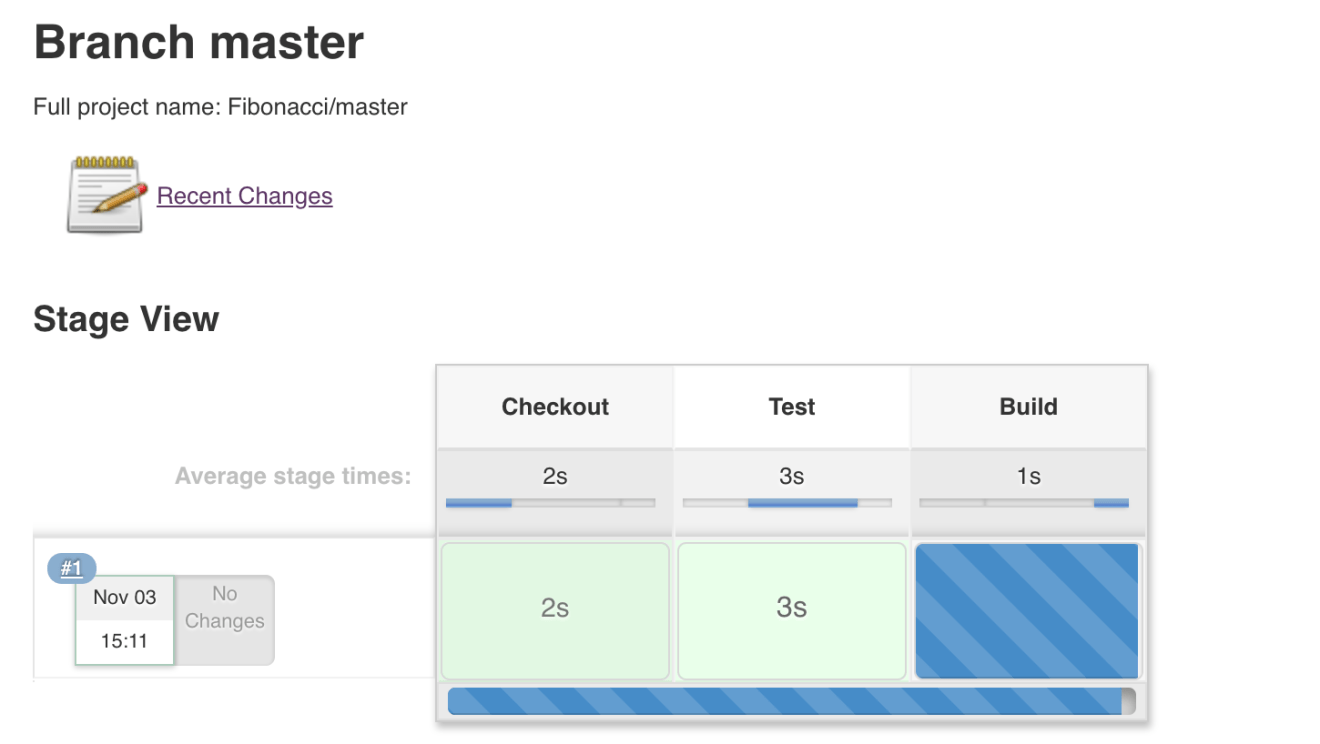
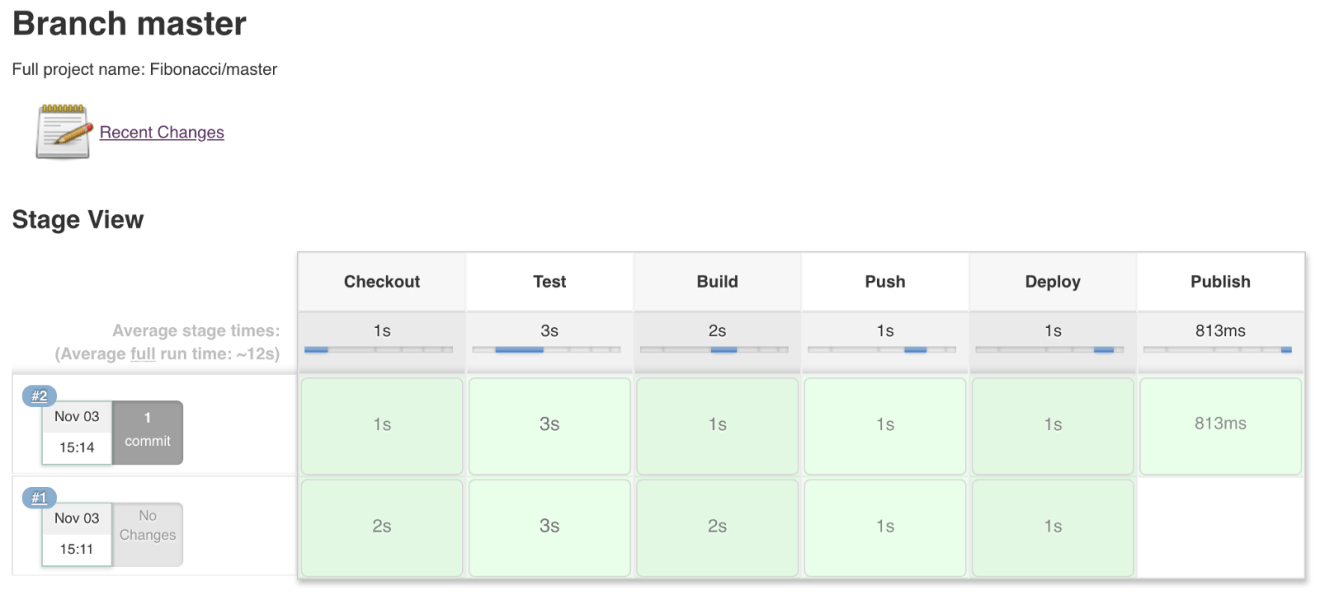
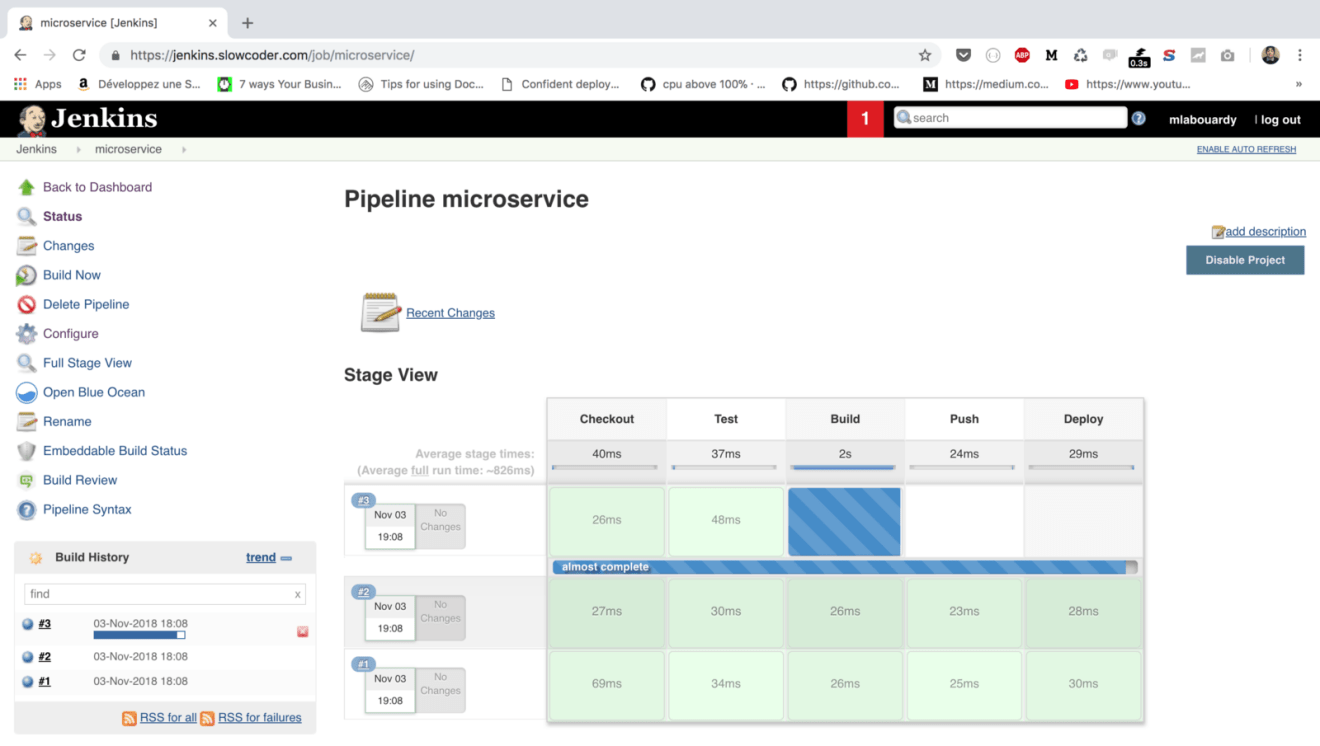
Once the project is saved, a new pipeline should be created as follows:
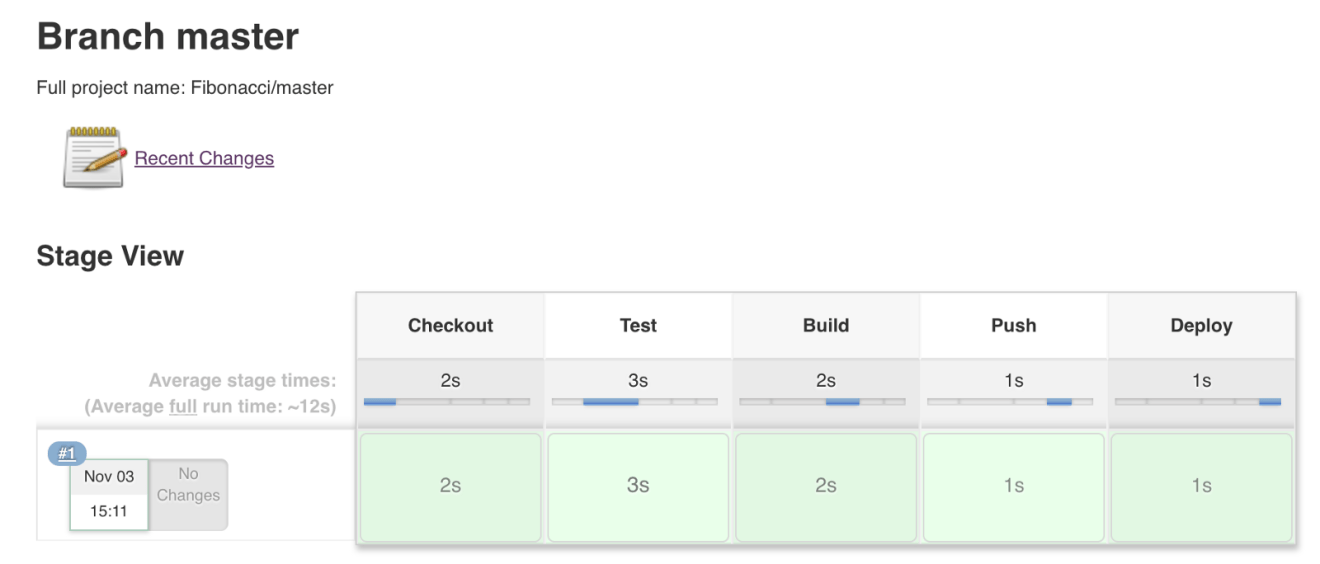
Once the pipeline is completed, all stages should be passed, as shown in the next screenshot:
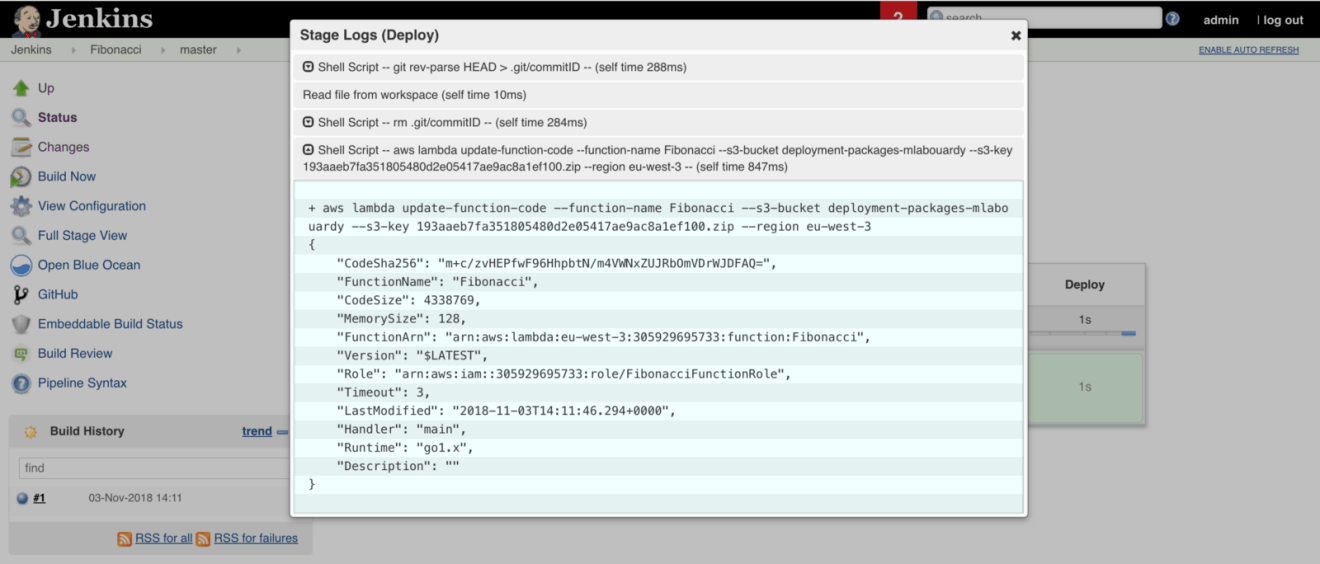
At the end, Jenkins will update the Lambda function’s code with the update-function-code command:
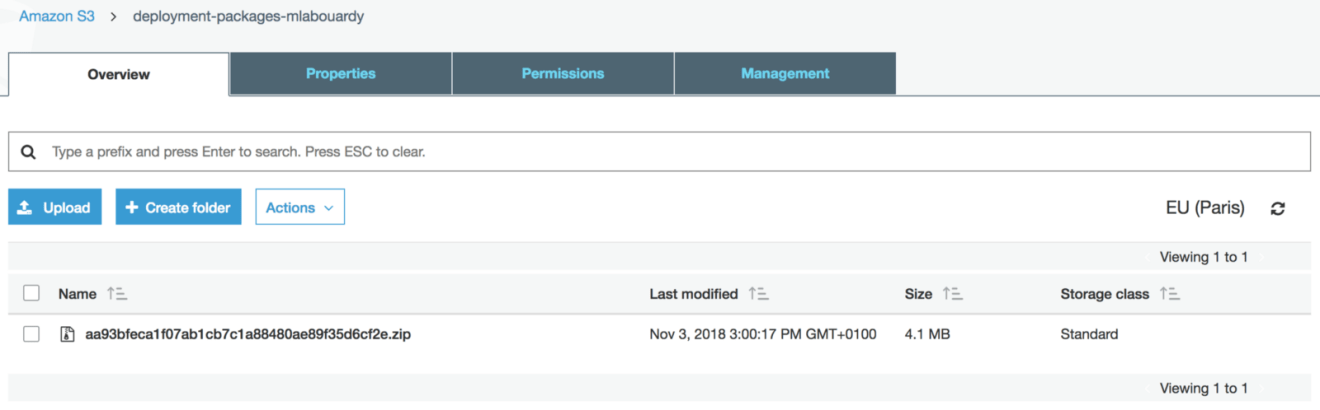
If you open the S3 Console, then click on the bucket used by the pipeline, a new deployment package should be stored with a key name identical to the commit ID:
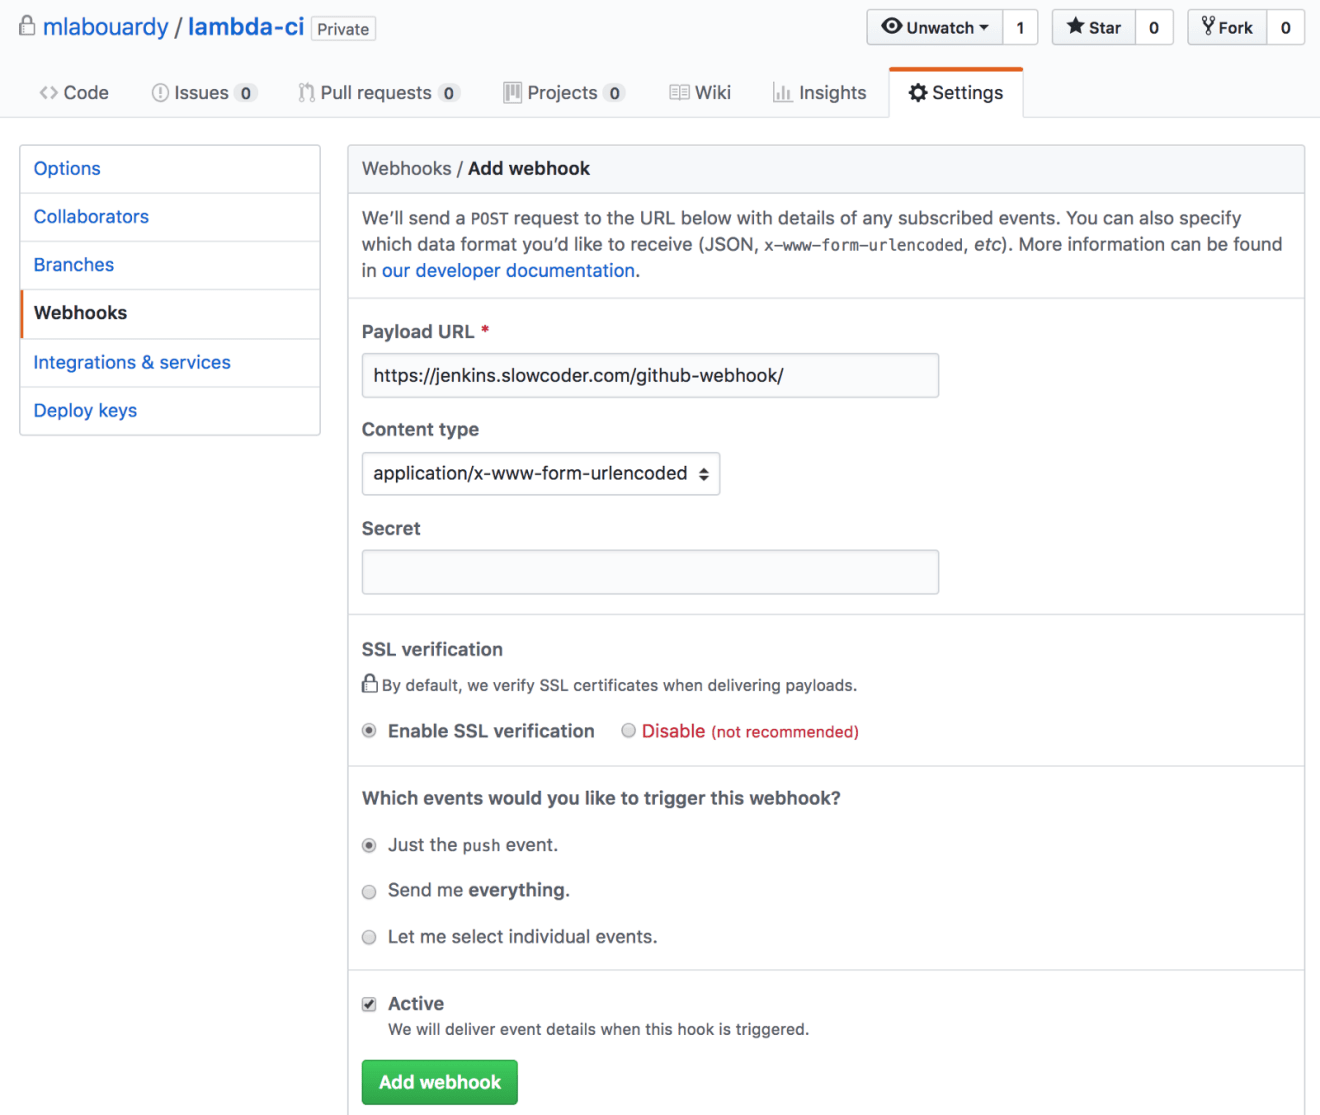
Finally, to make Jenkins trigger the build when you push to the code repository, click on “Settings” from your GitHub repository, then create a new webhook from “Webhooks”, and fill it in with a URL similar to the following:
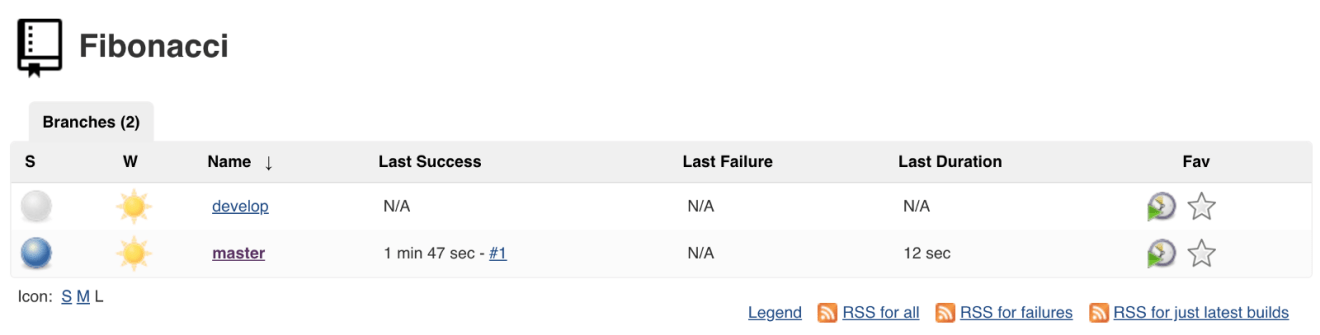
In case you’re using Git branching workflows (you should), Jenkins will discover automatically the new branches:
Hence, you must separate your deployment environments to test new changes without impacting your production. Therefore, having multiple versions of your Lambda functions makes sense.
Update the Jenkinsfile to add a new stage to publish a new Lambda function’s version, every-time you push (or merge) to the master branch:
if (env.BRANCH_NAME == 'master') { stage('Publish') { sh "aws lambda publish-version --function-name ${functionName} \ --region ${region}" } } }
def commitID() { sh 'git rev-parse HEAD > .git/commitID' def commitID = readFile('.git/commitID').trim() sh 'rm .git/commitID' commitID }
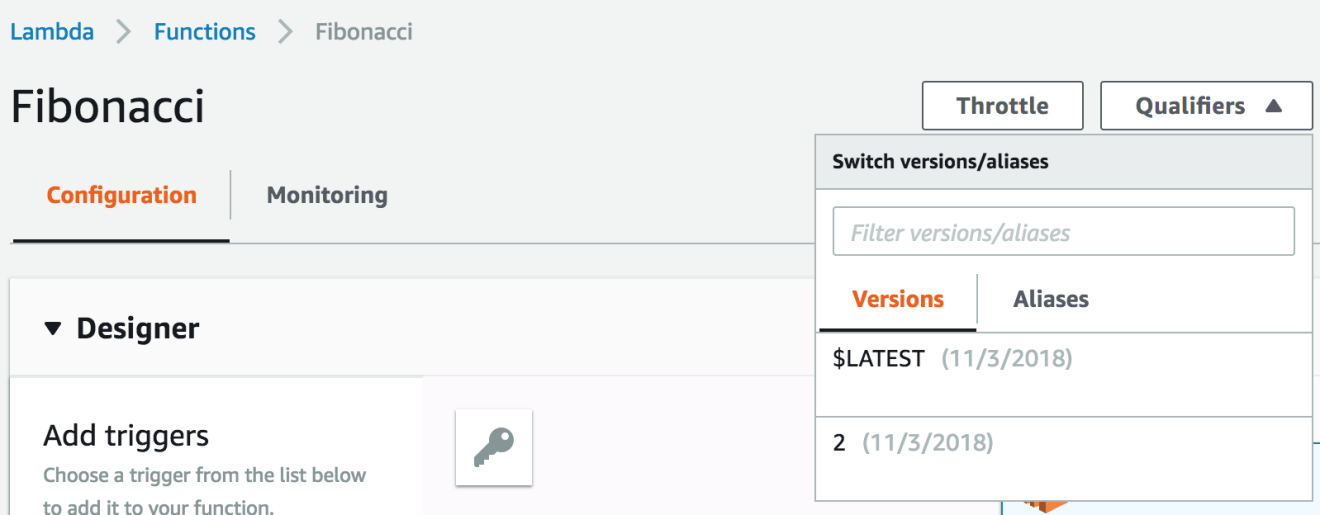
On the master branch, a new stage called “Published” will be added:
As a result, a new version will be published based on the master branch source code:
However, in agile based environment (Extreme programming). The development team needs to release iterative versions of the system often to help the customer to gain confidence in the progress of the project, receive feedback and detect bugs in earlier stage of development. As a result, small releases can be frequent:
AWS services using Lambda functions as downstream resources (API Gateway as an example) need to be updated every-time a new version is published -> operational overhead and downtime. USE aliases !!!
The alias is a pointer to a specific version, it allows you to promote a function from one environment to another (such as staging to production). Aliases are mutable, unlike versions, which are immutable.
That being said, create an alias for the production environment that points to the latest version published using the AWS command line:
def commitID() { sh 'git rev-parse HEAD > .git/commitID' def commitID = readFile('.git/commitID').trim() sh 'rm .git/commitID' commitID }
Like what you’re reading? Check out my book and learn how to build, secure, deploy and manage production-ready Serverless applications in Golang with AWS Lambda.
Drop your comments, feedback, or suggestions below — or connect with me directly on Twitter @mlabouardy.
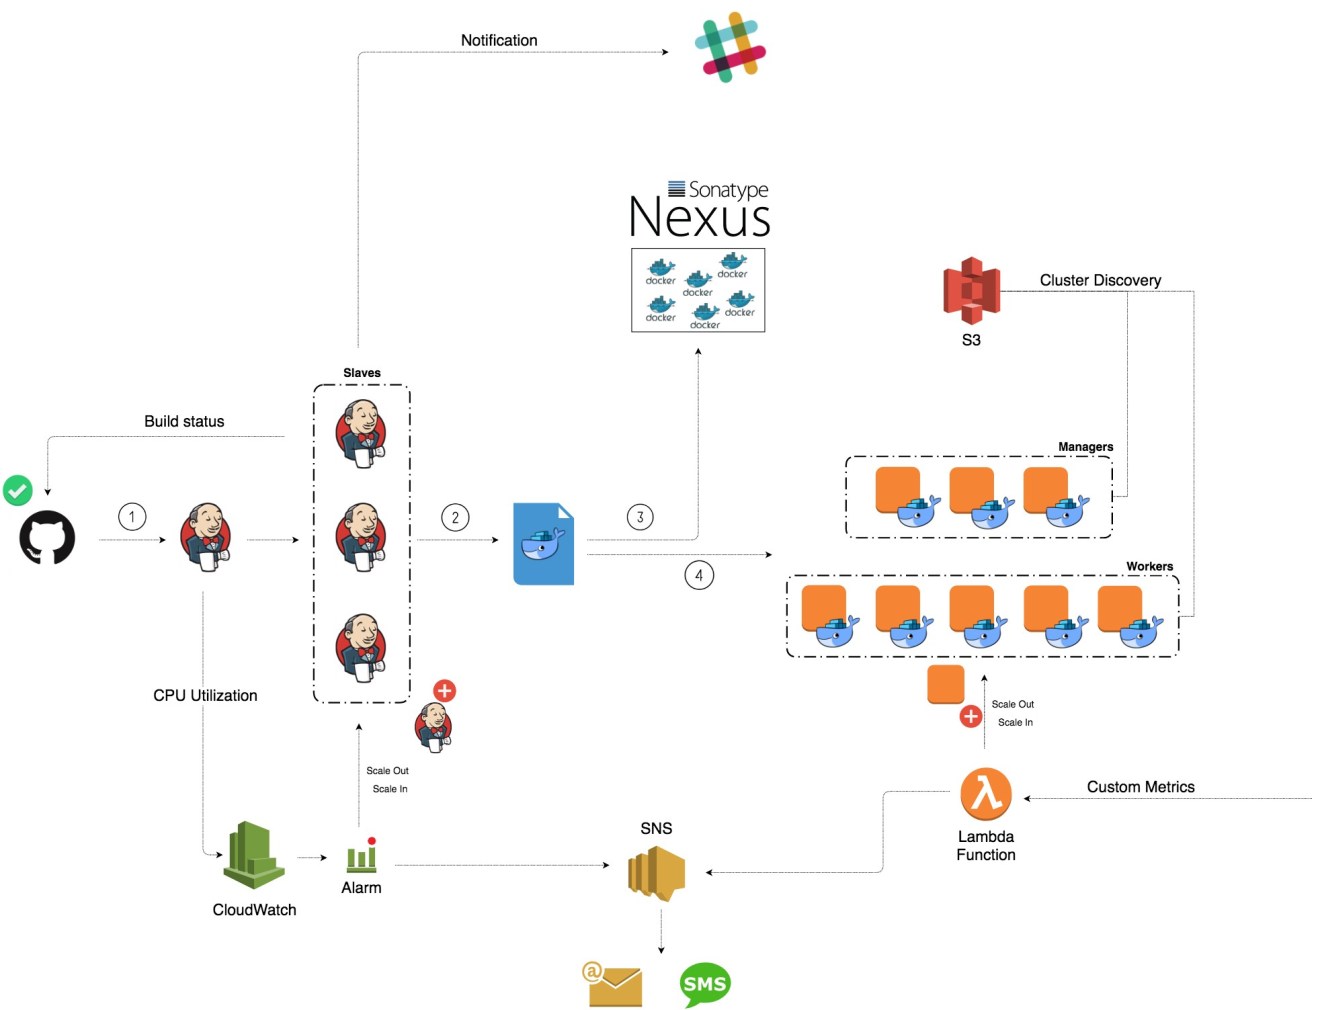
Few months ago, I gave a talk at Nexus User Conference 2018 on how to build a fully automated CI/CD platform on AWS using Terraform, Packer & Ansible. I illustrated how concepts like infrastructure as code, immutable infrastructure, serverless, cluster discovery, etc can be used to build a highly available and cost-effective pipeline. The platform I built is given in the following diagram:
The platform has a Jenkins cluster with a dedicated Jenkins master and workers inside an autoscaling group. Each push event to the code repository will trigger the Jenkins master which will schedule a new build on one of the available slaves. The slave will be responsible of running the unit and pre-integration tests, building the Docker image, storing the image to a private registry and deploying a container based on that image to Docker Swarm cluster.
On this post, I will walk through how to deploy the Jenkins cluster on AWS using top trending automation tools.
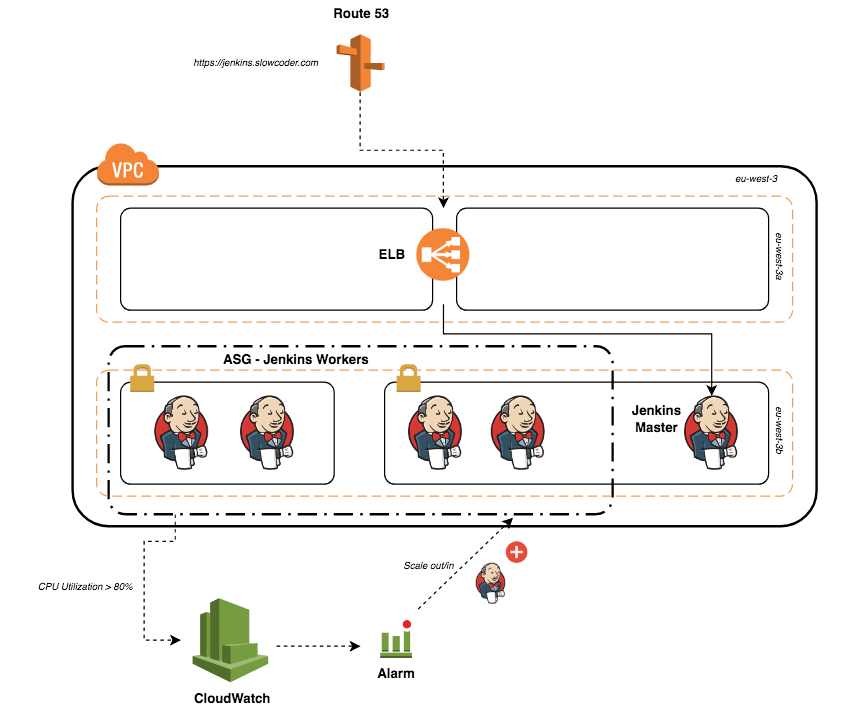
The cluster will be deployed into a VPC with 2 public and 2 private subnets across 2 availability zones. The stack will consists of an autoscaling group of Jenkins workers in a private subnets and a private instance for the Jenkins master sitting behind an elastic Load balancer. To add or remove Jenkins workers on-demand, the CPU utilisation of the ASG will be used to trigger a scale out (CPU > 80%) or scale in (CPU < 20%) event. (See figure below)
To get started, we will create 2 AMIs (Amazon Machine Image) for our instances. To do so, we will use Packer, which allows you to bake your own image.
The first AMI will be used to create the Jenkins master instance. The AMI uses the Amazon Linux Image as a base image and for provisioning part it uses a simple shell script:
It will install the latest stable version of Jenkins and configure its settings:
Create a Jenkins admin user.
Create a SSH, GitHub and Docker registry credentials.
Install all needed plugins (Pipeline, Git plugin, Multi-branch Project, etc).
Disable remote CLI, JNLP and unnecessary protocols.
Enable CSRF (Cross Site Request Forgery) protection.
Install Telegraf agent for collecting resource and Docker metrics.
The second AMI will be used to create the Jenkins workers, similarly to the first AMI, it will be using the Amazon Linux Image as a base image and a script to provision the instance:
A Jenkins worker requires the Java JDK environment and Git to be installed. In addition, the Docker community edition (building Docker images) and a data collector (monitoring) will be installed.
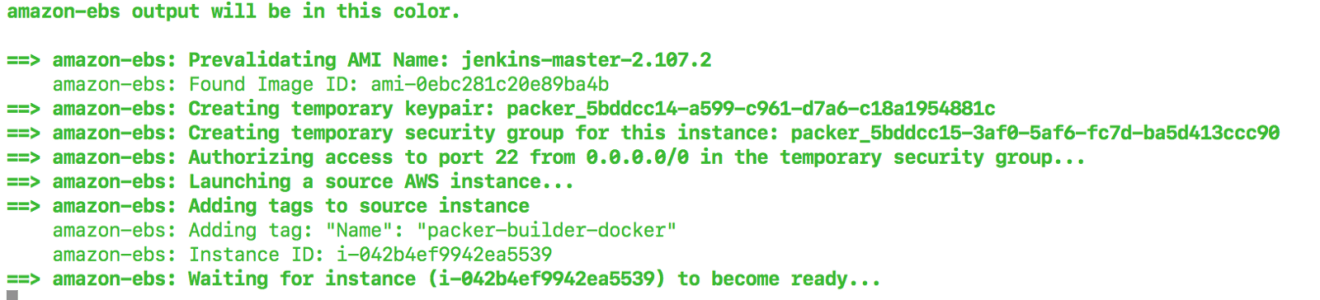
Now our Packer template files are defined, issue the following commands to start baking the AMIs:
Packer will launch a temporary EC2 instance from the base image specified in the template file and provision the instance with the given shell script. Finally, it will create an image from the instance. The following is an example of the output:
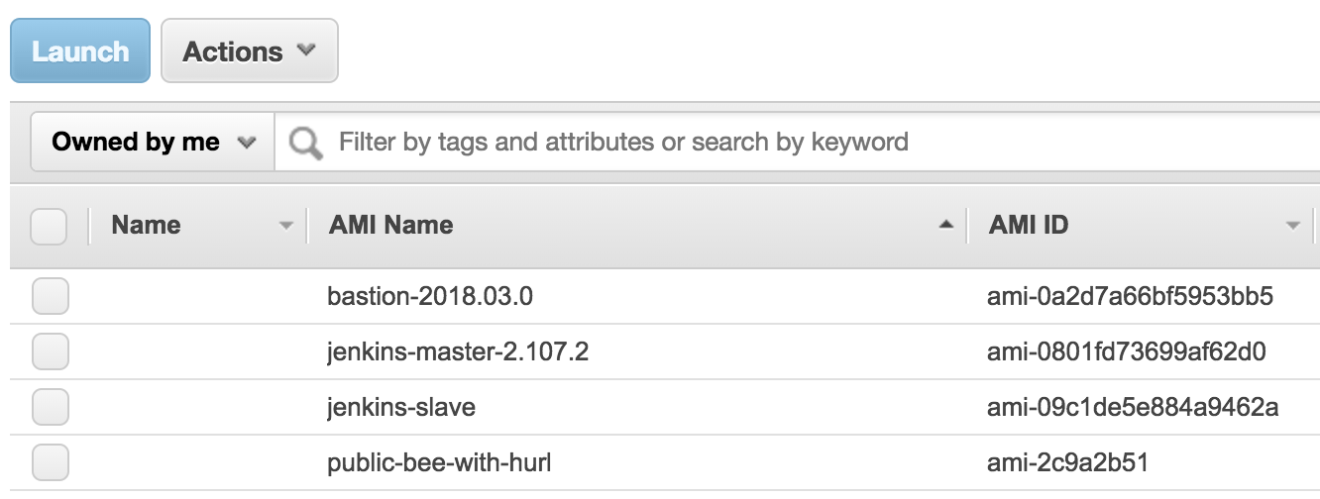
Sign in to AWS Management Console, navigate to “EC2 Dashboard” and click on “AMI”, 2 new AMIs should be created as below:
Now our AMIs are ready to use, let’s deploy our Jenkins cluster to AWS. To achieve that, we will use an infrastructure as code tool called Terraform, it allows you to describe your entire infrastructure in templates files.
I have divided each component of my infrastructure to a template file. The following template file is responsible of creating an EC2 instance from the Jenkins master’s AMI built earlier:
Another template file used as a reference to each AMI built with Packer:
1 2 3 4 5 6 7 8 9 10 11 12 13 14 15 16 17 18 19
data "aws_ami" "jenkins-master" { most_recent = true owners = ["self"]
filter { name = "name" values = ["jenkins-master-2.107.2"] } }
data "aws_ami" "jenkins-slave" { most_recent = true owners = ["self"]
filter { name = "name" values = ["jenkins-slave"] } }
The Jenkins workers (aka slaves) will be inside an autoscaling group of a minimum of 3 instances. The instances will be created from a launch configuration based on the Jenkins slave’s AMI:
At boot time, the user-data script above will be invoked and the instance private IP address will be retrieved from the instance meta-data and a groovy script will be executed to make the node join the cluster:
1 2 3 4 5 6 7 8 9 10
data "template_file" "user_data_slave" { template = "${file("scripts/join-cluster.tpl")}"
Moreover, to be able to scale out and scale in instances on demand, I have defined 2 CloudWatch metric alarms based on the CPU utilisation of the autoscaling group:
Finally, an Elastic Load Balancer will be created in front of the Jenkins master’s instance and a new DNS record pointing to the ELB domain will be added to Route 53:
1 2 3 4 5 6 7 8 9 10 11
resource "aws_route53_record" "jenkins_master" { zone_id = "${var.hosted_zone_id}" name = "jenkins.slowcoder.com" type = "A"
alias { name = "${aws_elb.jenkins_elb.dns_name}" zone_id = "${aws_elb.jenkins_elb.zone_id}" evaluate_target_health = true } }
Once the stack is defined, provision the infrastructure with terraform apply command:
1 2 3 4 5 6 7 8
# Install the AWS provider plugin terraform int
# Dry-run check terraform plan
# Provision the infrastructure terraform apply --var-file=variables.tfvars
The command takes an additional parameter, a variables file with the AWS credentials and VPC settings (You can create a new VPC with Terraform from here):
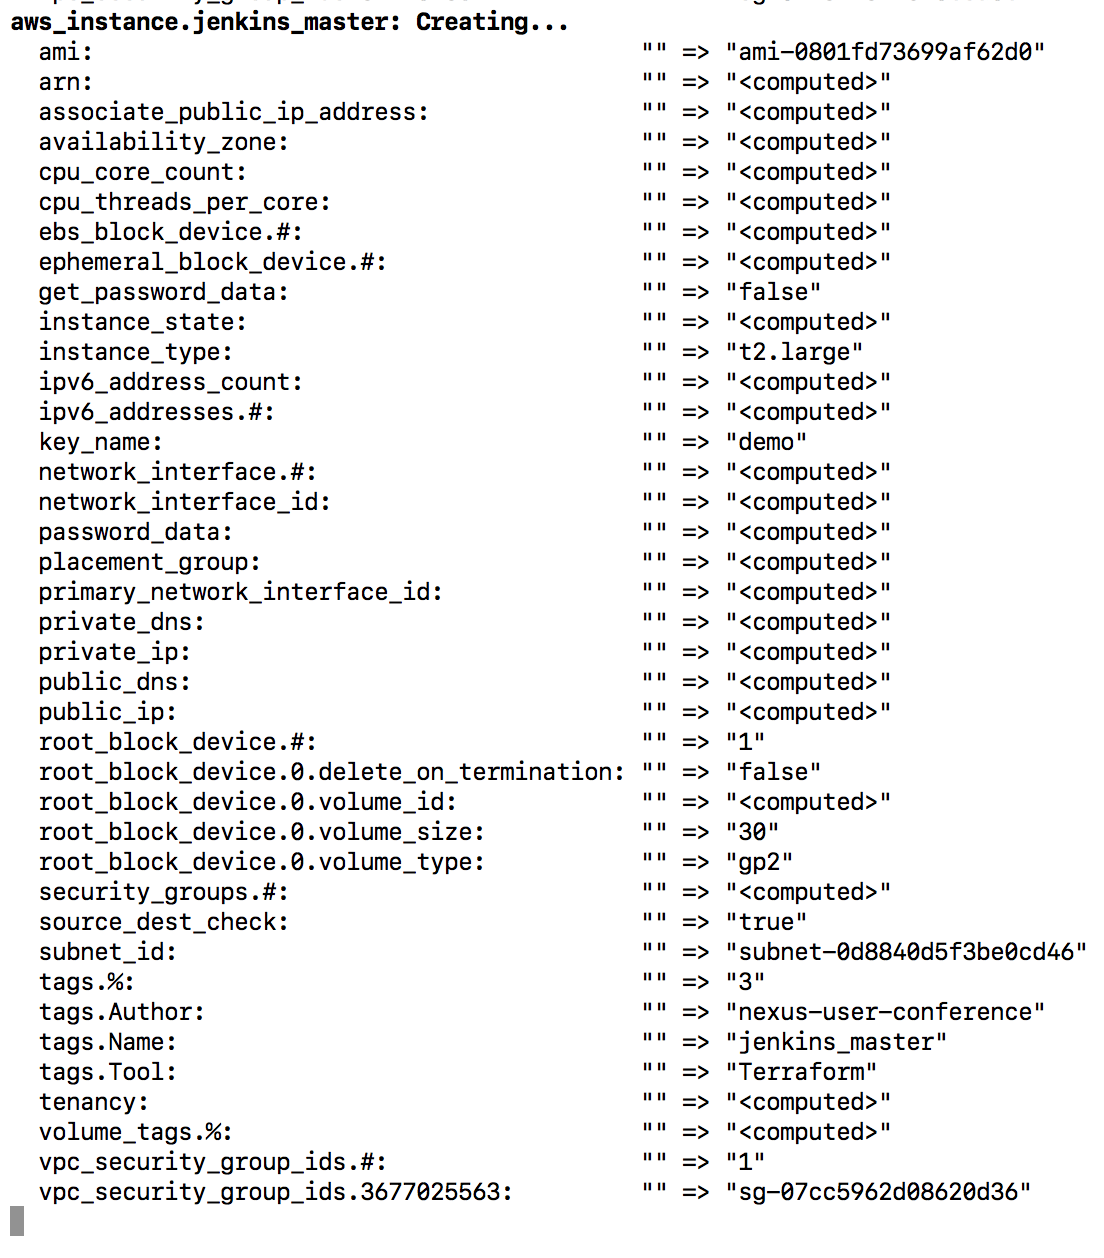
Terraform will display an execution plan (list of resources that will be created in advance), type yes to confirm and the stack will be created in few seconds:
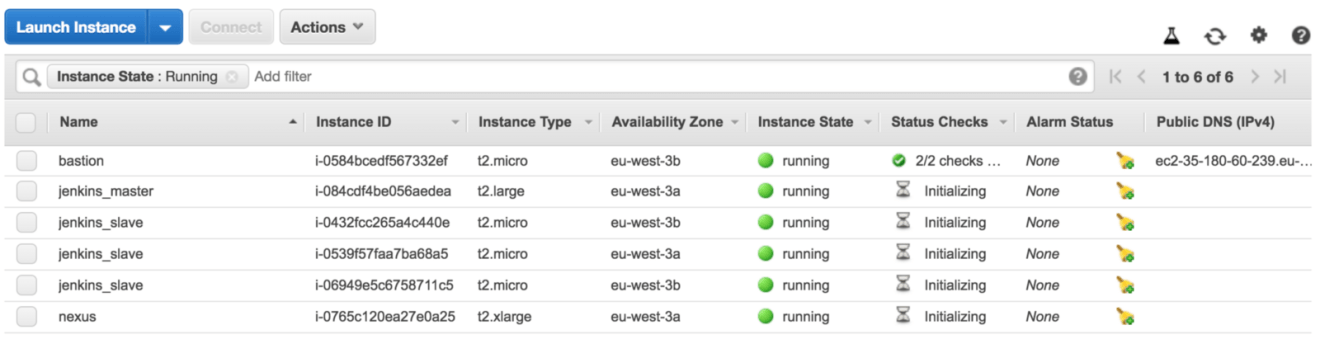
Jump back to EC2 dashboards, a list of EC2 instances will created:
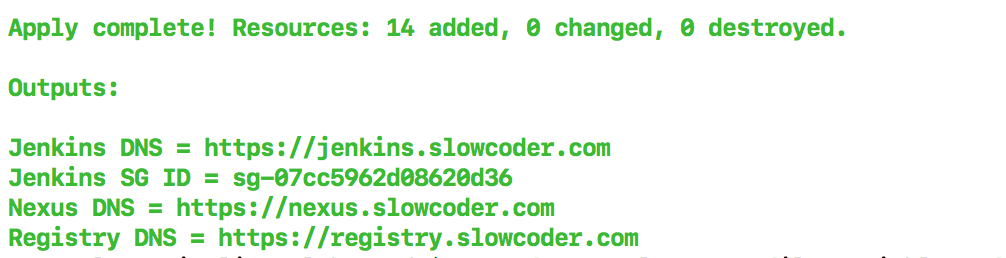
In the terminal session, under the Outputs section, the Jenkins URL will be displayed:
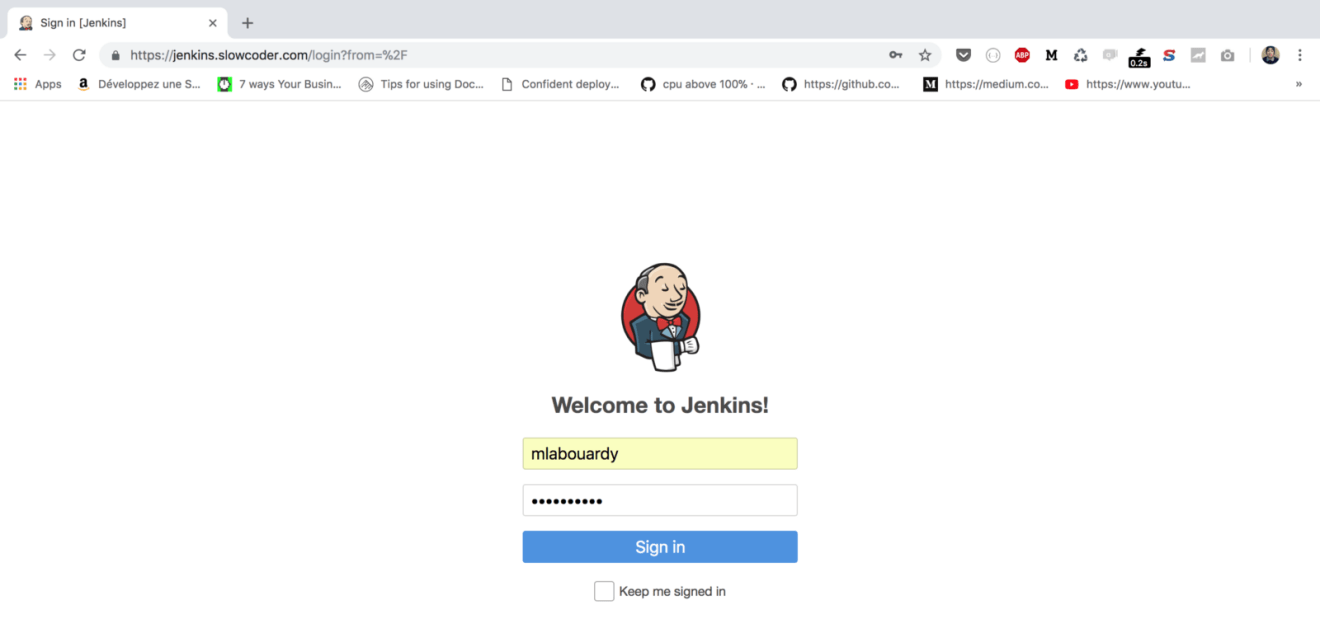
Point your favorite browser to the URL displayed, the Jenkins login screen will be displayed. Sign in using the credentials provided while baking the Jenkins master’s AMI:
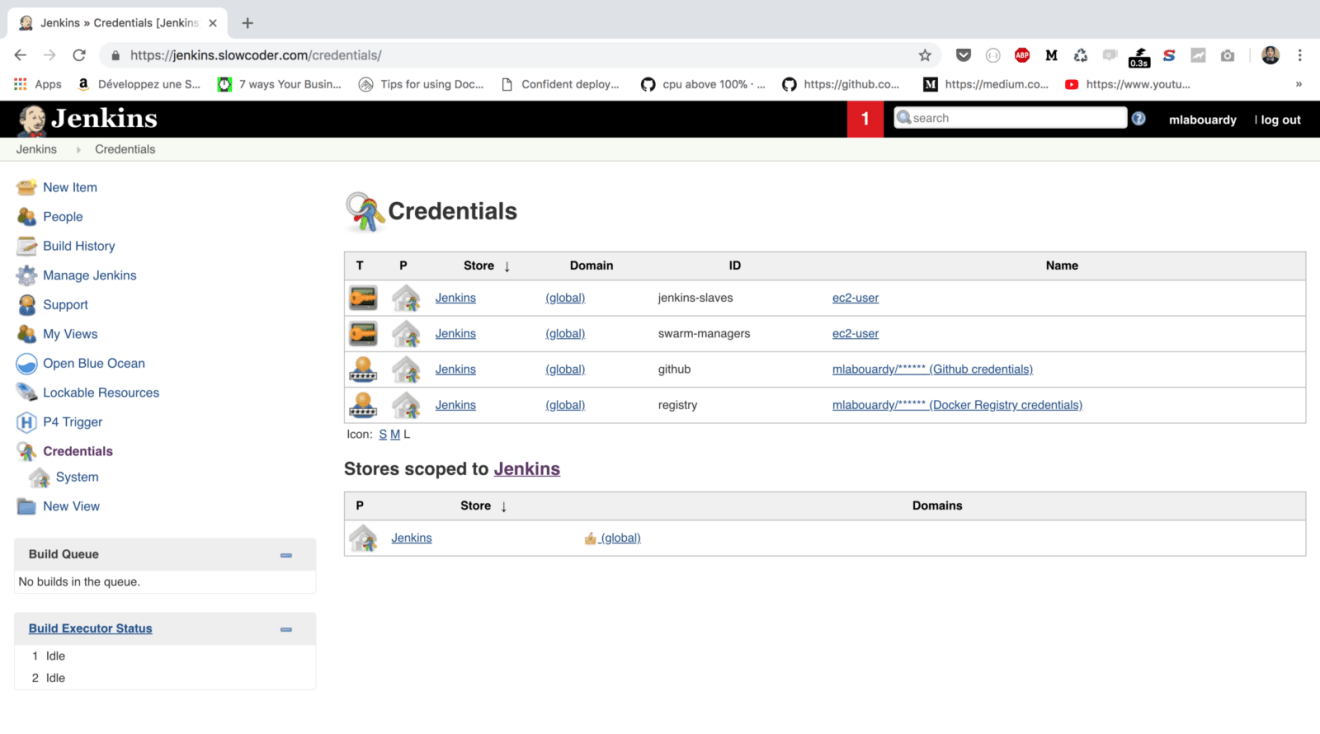
If you click on “Credentials” from the navigation pane, a set of credentials should be created out of the box:
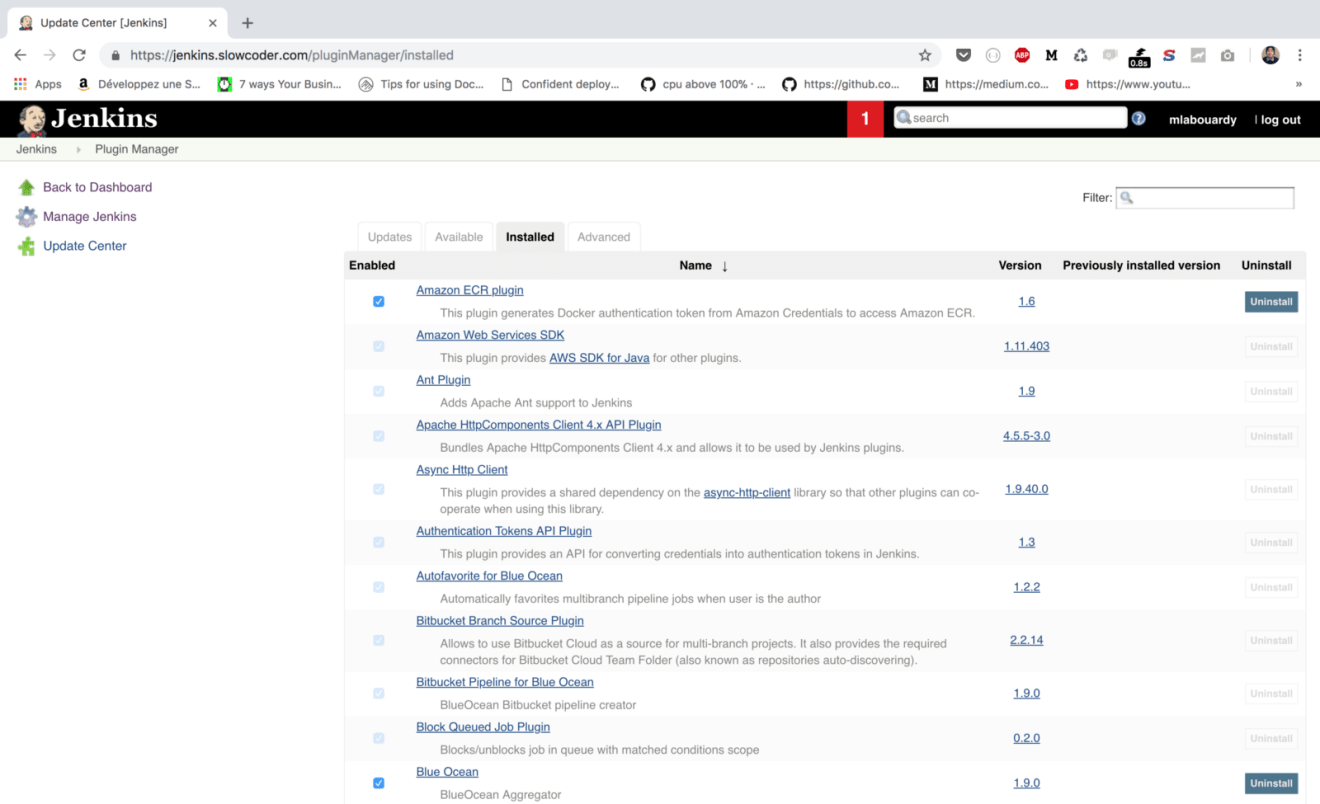
The same goes for “Plugins”, a list of needed packages will be installed also:
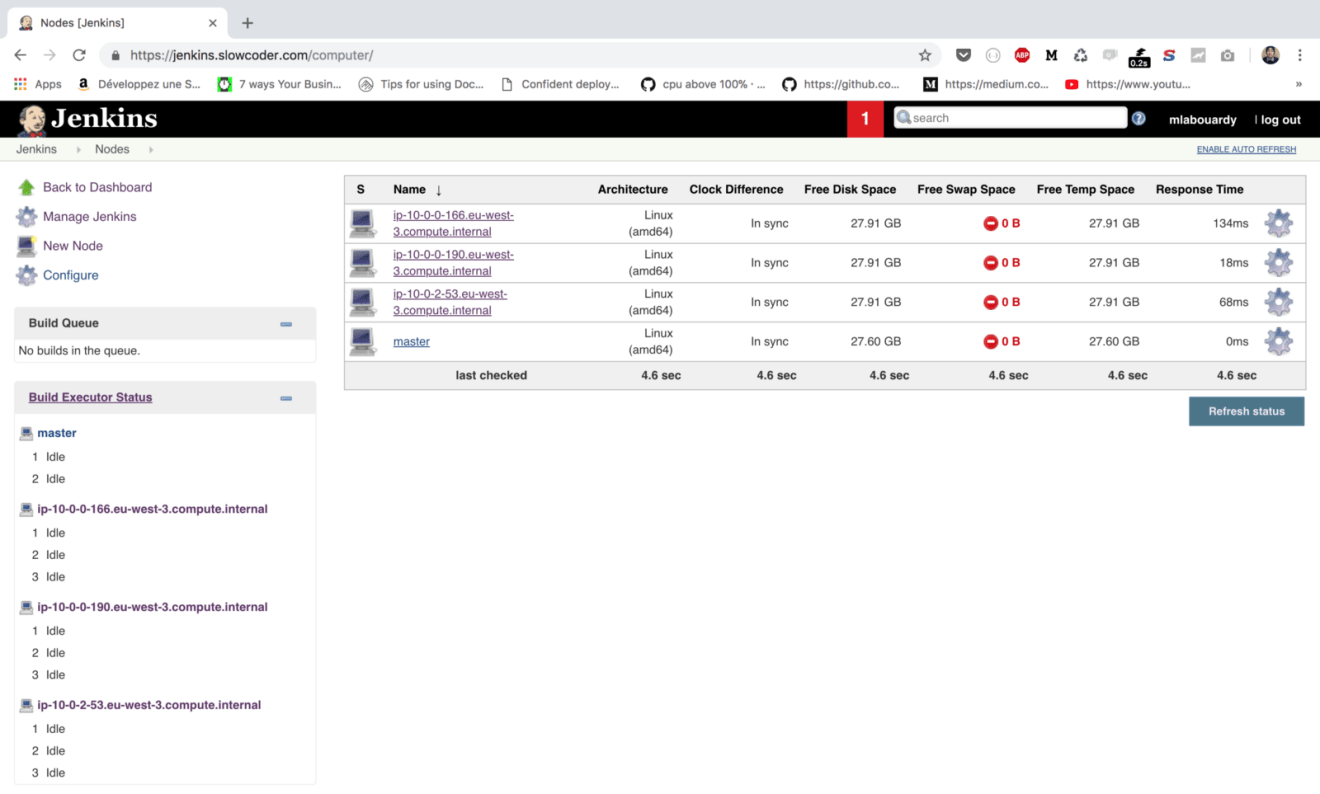
Once the Autoscaling group finished creating the EC2 instances, the instances will join the cluster automatically as you can see in the following screenshot:
You should now be ready to create your own CI/CD pipeline !
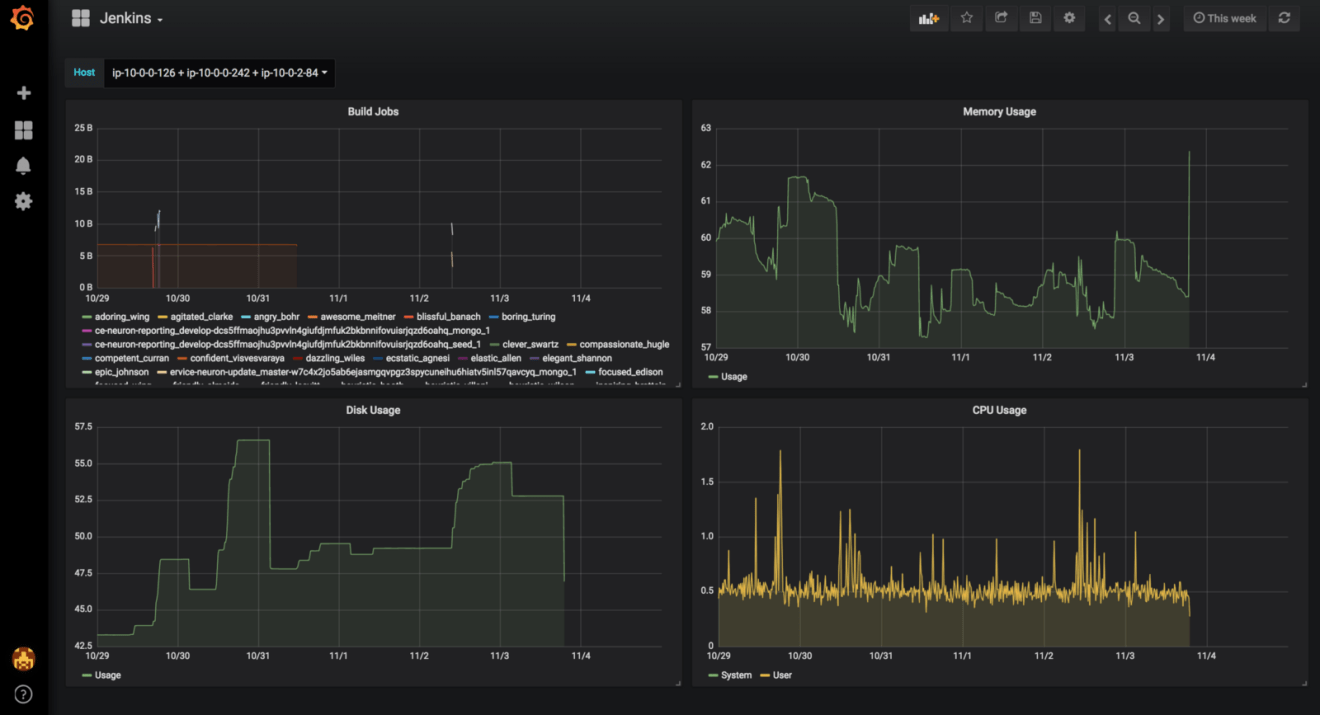
You can take this further and build a dynamic dashboard in your favorite visualisation tool like Grafana to monitor your cluster resource usage based on the metrics collected by the agent installed on each EC2 instance:
Drop your comments, feedback, or suggestions below — or connect with me directly on Twitter @mlabouardy.
Have you ever had short lived containers like the following use cases:
Batch and ETL (Extract, Transform & Load) Jobs.
Database backups and synchronisation.
Machine Learning algorithms for generation of learning and training models.
Integration & Sanity tests.
Web scrapers & crawlers.
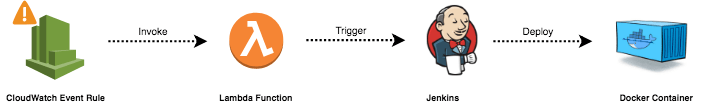
And you were wondering how you can deploy your container periodically or in response to an event ? The answer is by using Lambda itself, the idea is by making a Lambda function trigger a deployment of your container from the build server. The following figure illustrates how this process can be implemented:
I have wrote a simple application in Go to simulate a short time process using sleep method:
1 2 3 4 5 6 7 8 9 10 11 12
package main
import ( "fmt" "time" )
funcmain() { fmt.Println("Start working ...") time.Sleep(10 * time.Second) fmt.Println("Done") }
As Go is a complied language, I have used Docker multi-stage build feature to build a lightweight Docker image with the following Dockerfile:
1 2 3 4 5 6 7 8 9 10
FROM golang:1.10 WORKDIR /go/src/github.com/mlabouardy/lambda-oneshot-container COPY main.go . RUN CGO_ENABLED=0 GOOS=linux go build -a -installsuffix cgo -o app .
FROM alpine:latest RUN apk --no-cache add ca-certificates WORKDIR /root/ COPY --from=0 /go/src/github.com/mlabouardy/lambda-oneshot-container/app . CMD ["./app"]
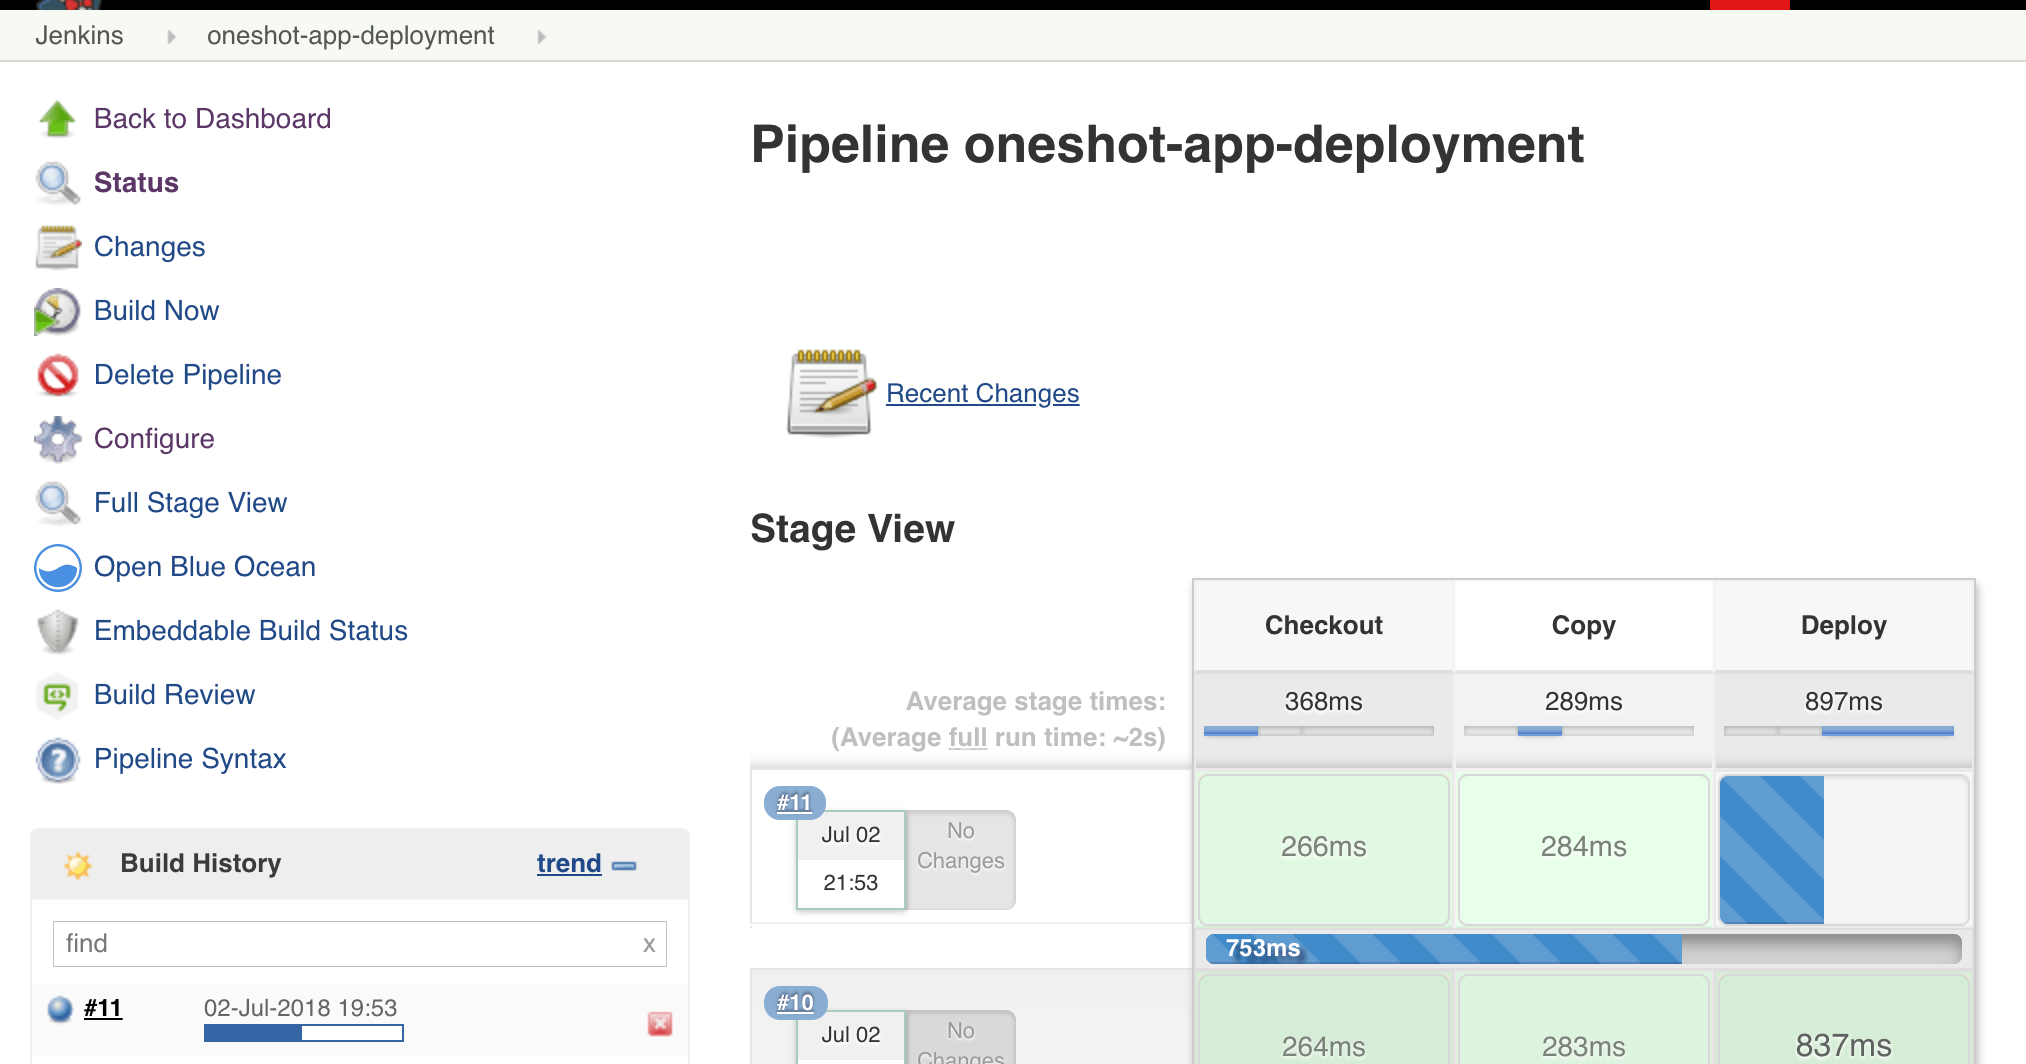
Next, I have a simple CI/CD workflow in Jenkins, the following is the Jenkinsfile used to build the pipeline:
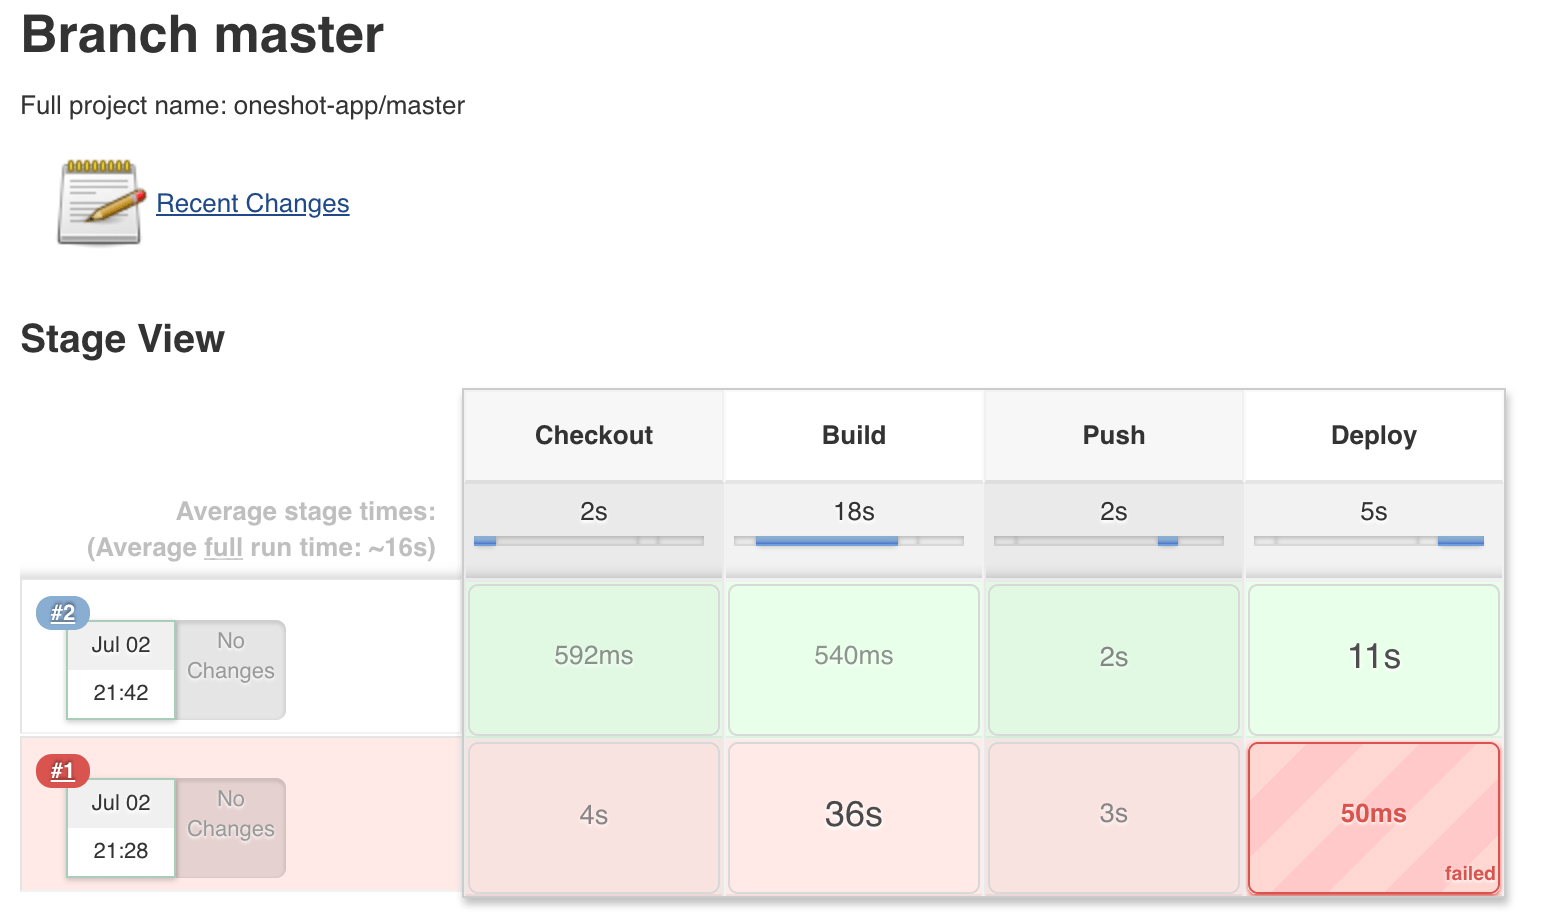
An example of the pipeline execution is given as follows:
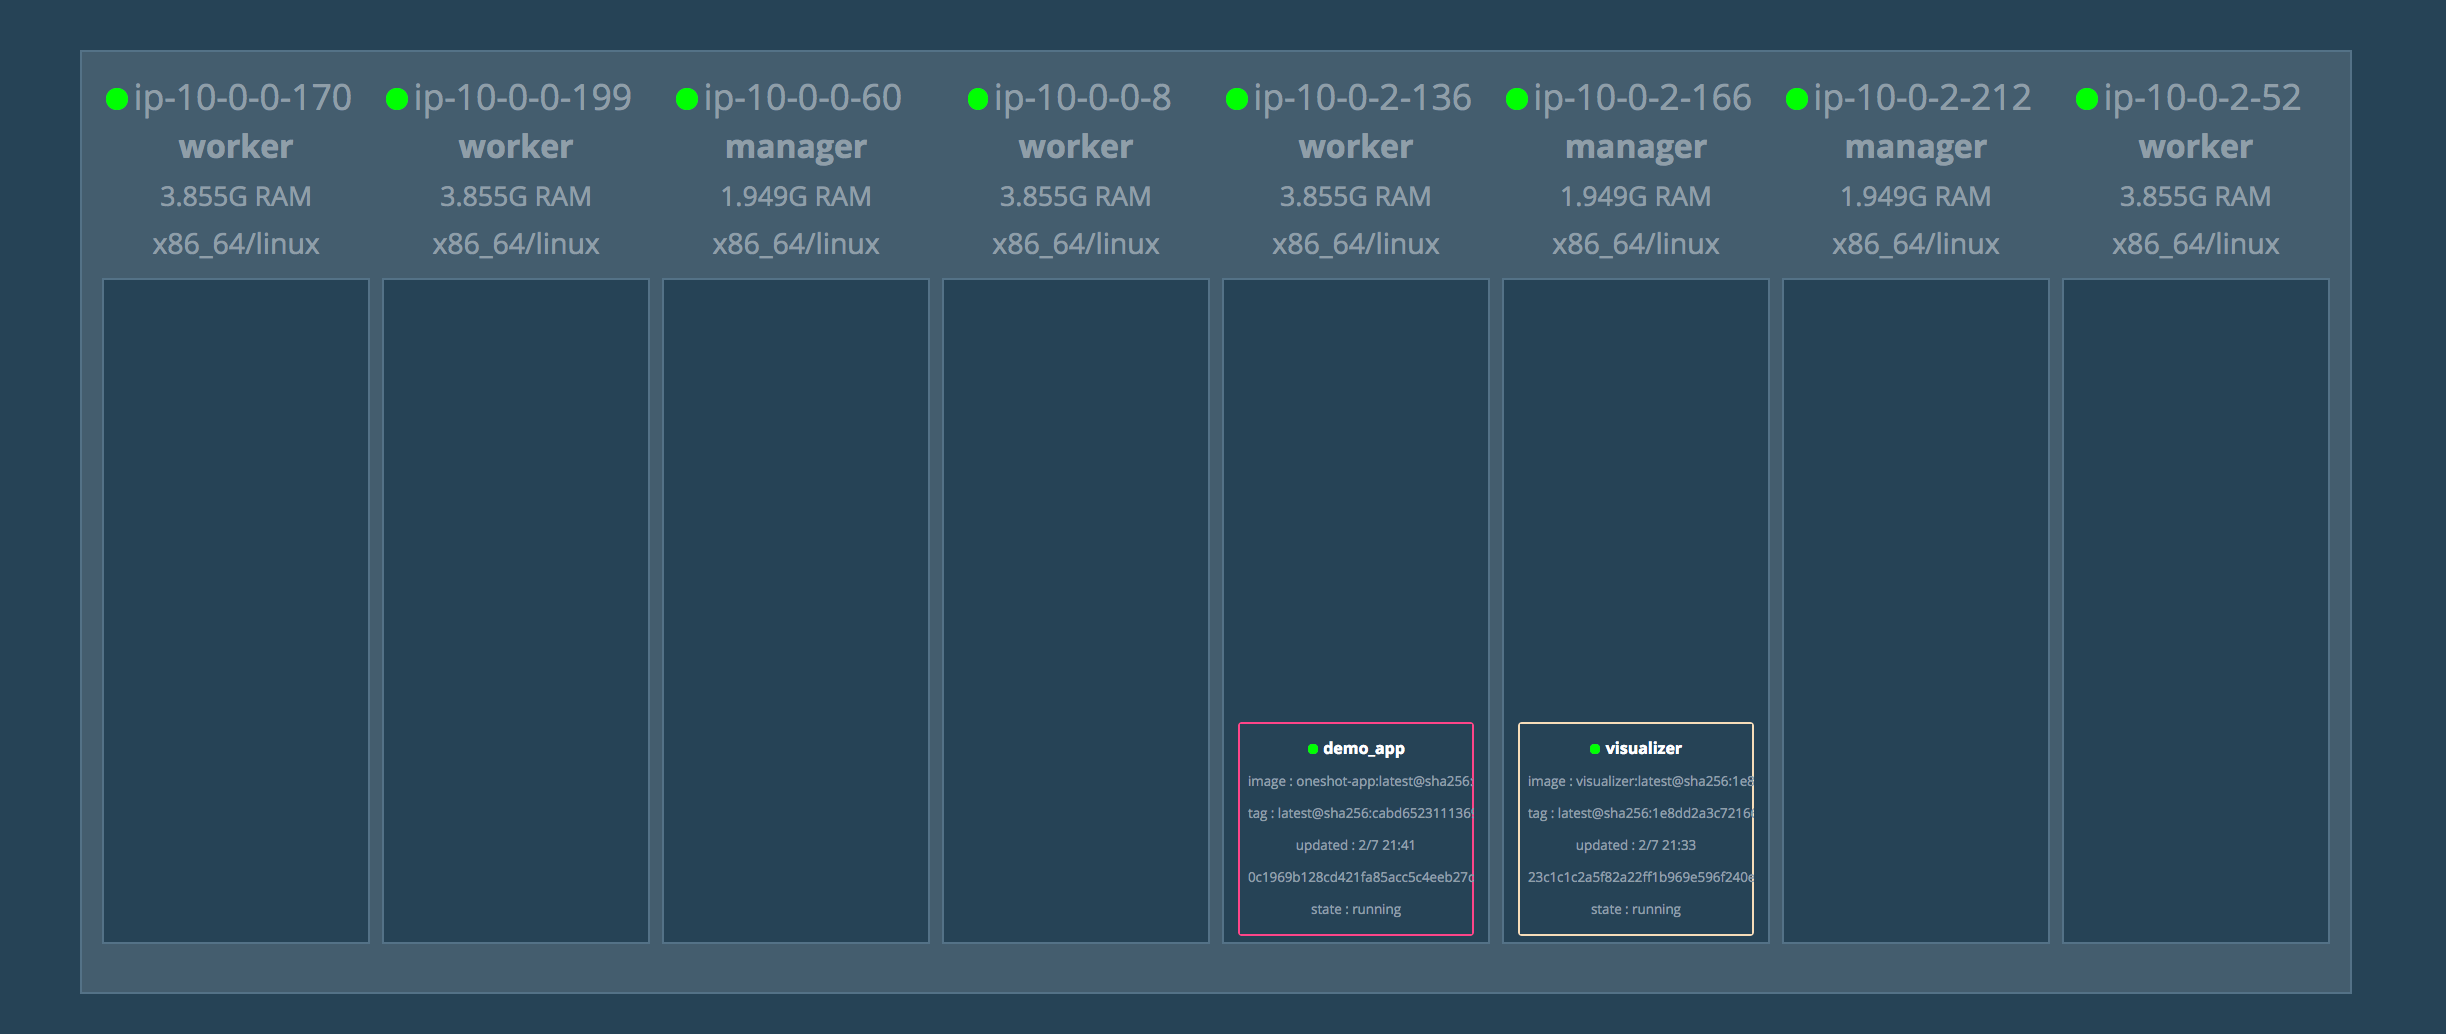
Now, all changes to the application will trigger a new build on Jenkins which will build the new Docker image, push the image to a private registry and deploy the new Docker image to the Swarm cluster:
If you issue the “docker service logs APP_NAME” on one of the cluster managers, your application should be working as expected:
Now our application is ready, let’s make execute everyday at 8am using a Lambda function. The following is the entrypoint (handler) that will be executed on each invocation of the function:
A new deployment should be triggered in Jenkins and your application should be deployed once again:
That’s it, it was a quick example on how you can use Serverless with Containers, you can go further and use Lambda functions to scale out/scale in your services in your Swarm/Kubernetes cluster by using either CloudWatch events for expected increasing traffic (Holidays, Black Friday …) or other AWS managed services like API Gateway in response to incoming client requests.
Full code can be found on my GitHub. Make sure to drop your comments, feedback, or suggestions below — or connect with me directly on Twitter @mlabouardy.
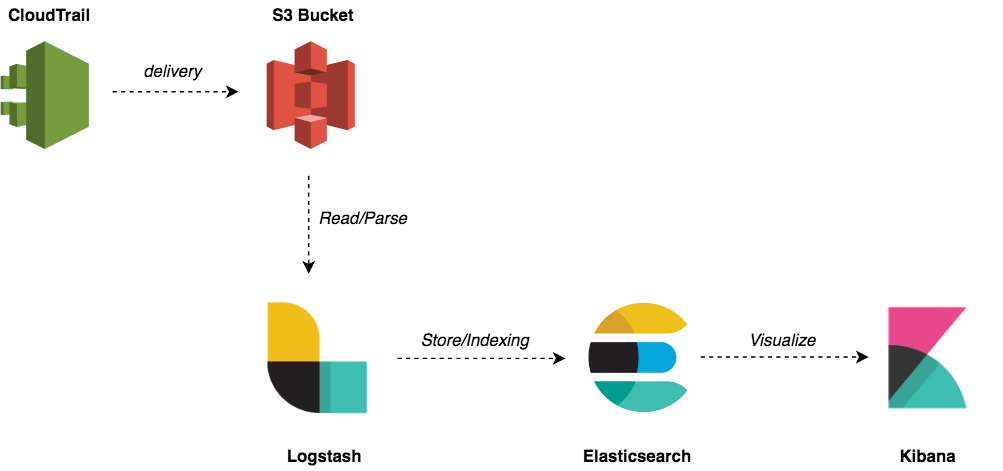
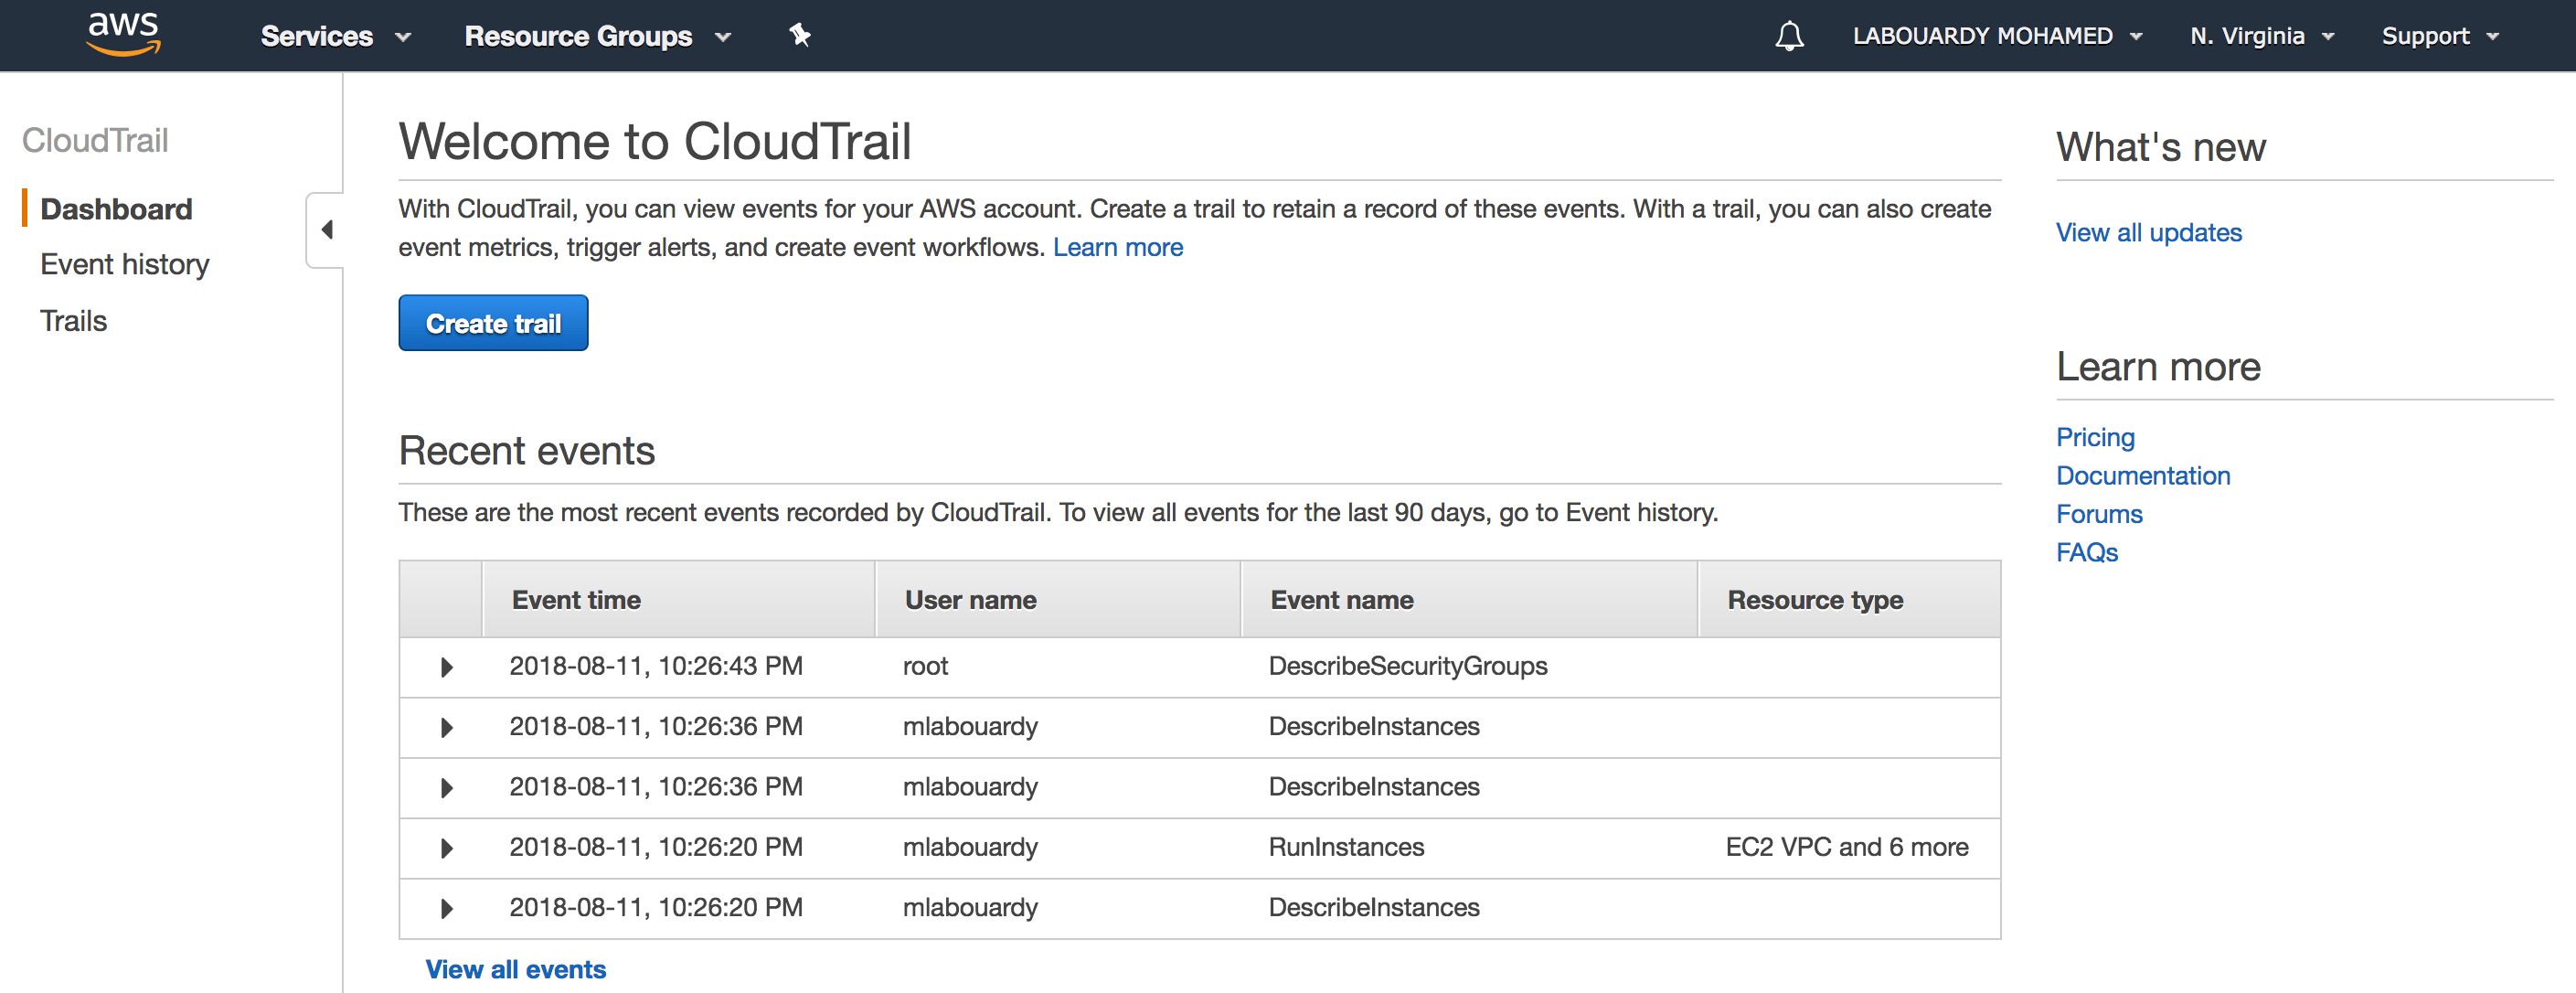
Recording your AWS environment activity is a must have. It can help you monitor your environment’s security continuously and detect suspicious or undesirable activity in real-time. Hence, saving thousands of dollars. Luckily, AWS offers a solution called CloudTrail that allow you to achieve that. It records all events in all AWS regions and logs every API calls in a single S3 bucket.
From there, you can setup an analysis pipeline using the popular logging stack ELK (ElasticSearch, Logstash & Kibana) to read those logs, parse, index and visualise them in a single dynamic dashboard and even take actions accordingly:
To get started, create an AMI with the ELK components installed and preconfigured. The AMI will be based on an Ubuntu image:
Now the template is defined, bake a new AMI with Packer:
1
packer build ami.json
Once the AMI is created, create a new EC2 instance based on the AMI with Terraform. Make sure to grant S3 permissions to the instance to be able to read CloudTrail logs from the bucket:
resource "aws_iam_role_policy" "cloudtrail_bucket_access_policy" { name = "CloudTrailEventsBucketFullAccessPolicy" role = "${aws_iam_role.cloudtrail_bucket_access_role.id}"
Issue the following command to provision the infrastructure:
1
terraform apply
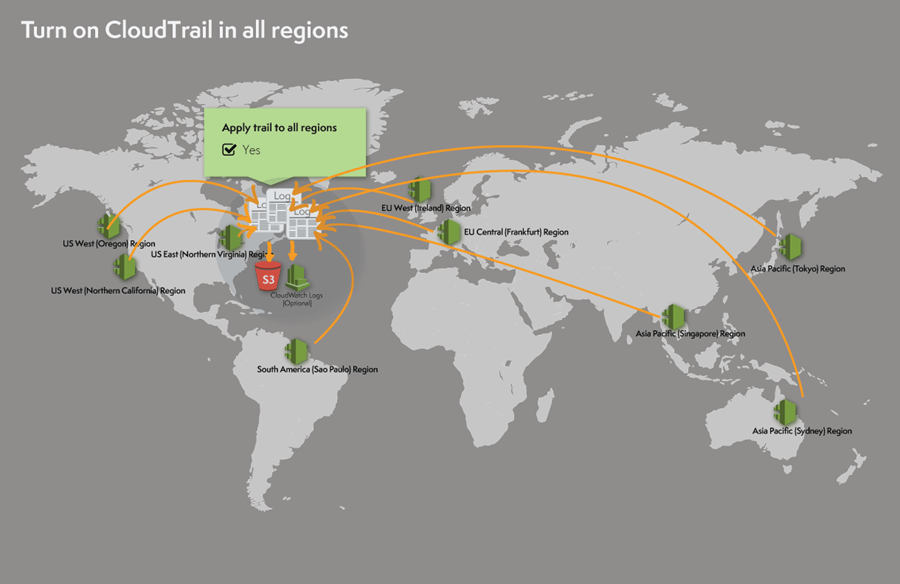
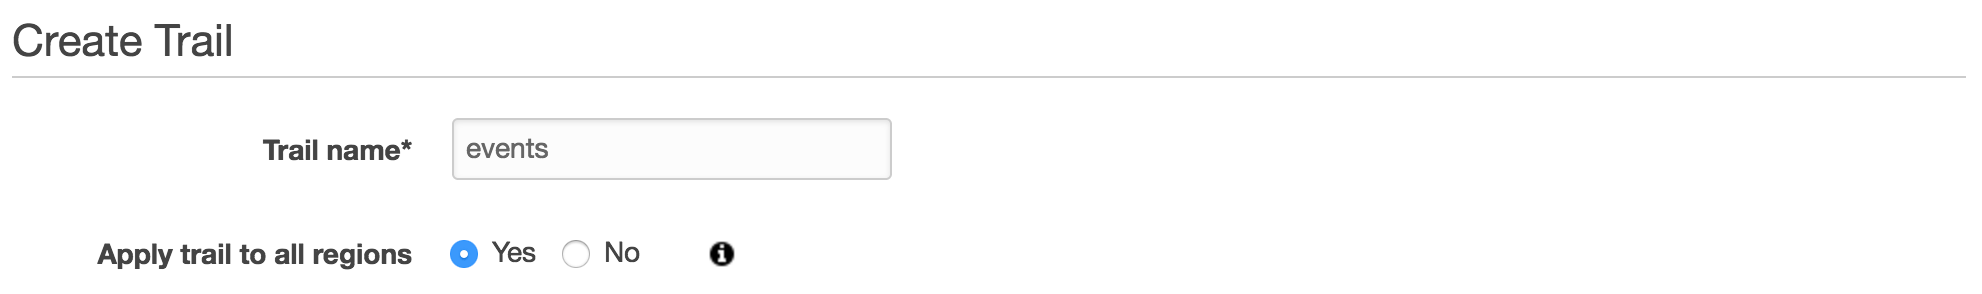
Head back to AWS Management Console, navigate to CloudTrail, and click on “Create Trail” button:
Give it a name and apply the trail to all AWS regions:
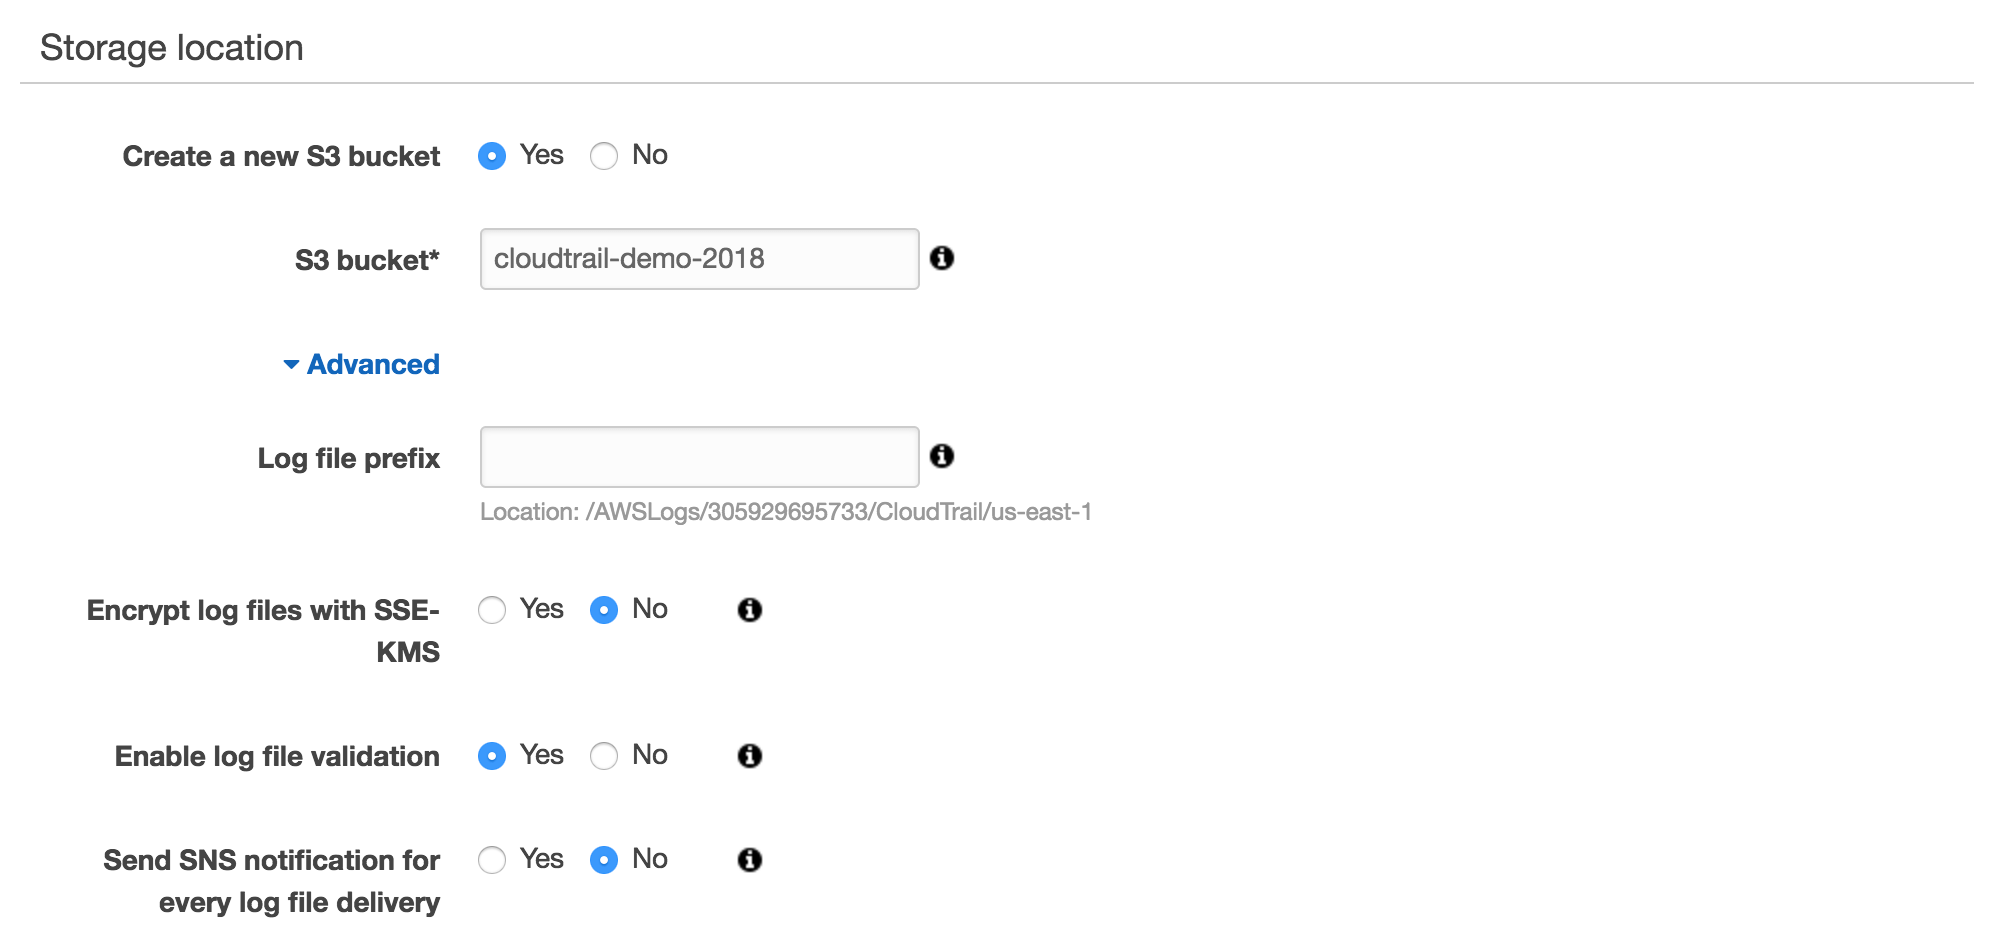
Next, create a new S3 bucket on which the events will be stored on:
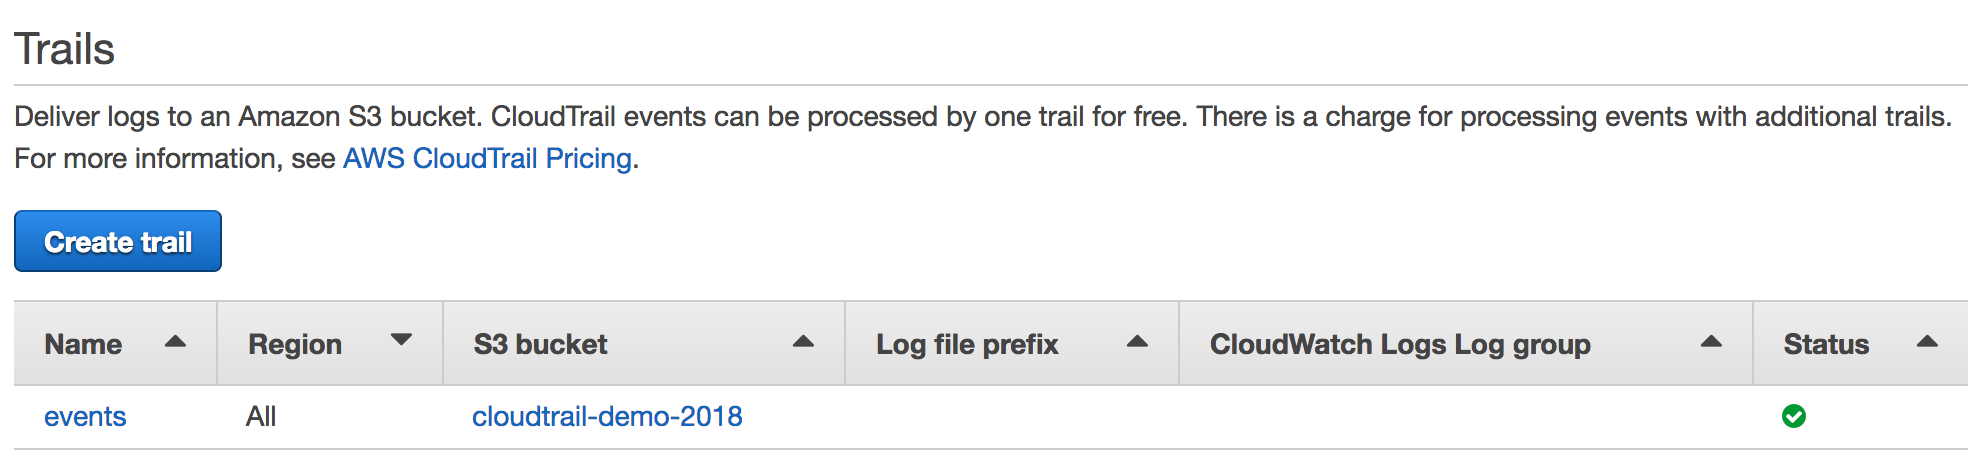
Click on “Create“, and the trail should be created as follows:
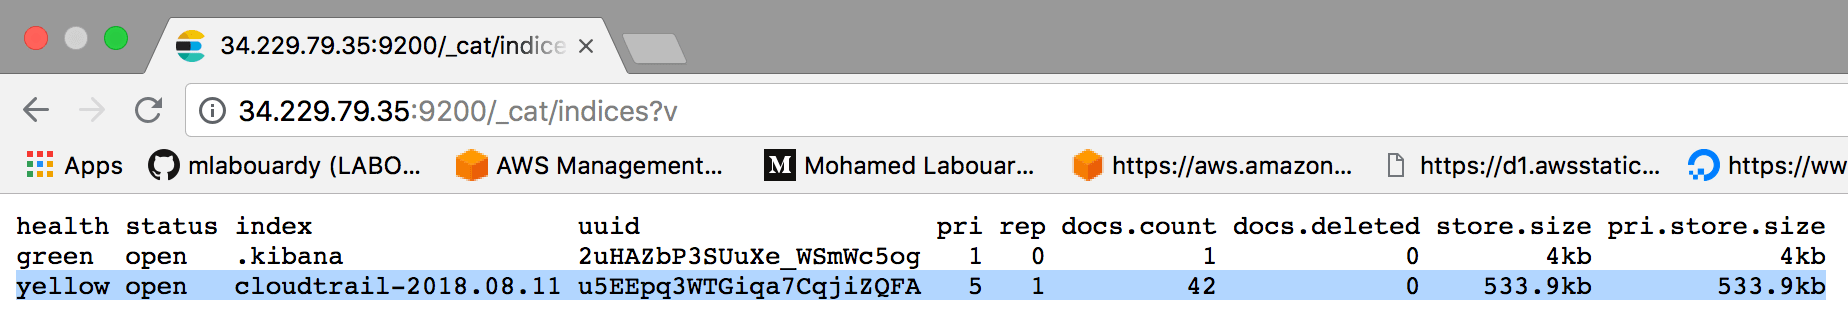
Next, configure Logstash to read CloudTrail logs on an interval basis. The geoip filter adds information about the geographical location of IP addresses, based on sourceIPAddress field. Then, it stores the logs to Elasticsearch automatically:
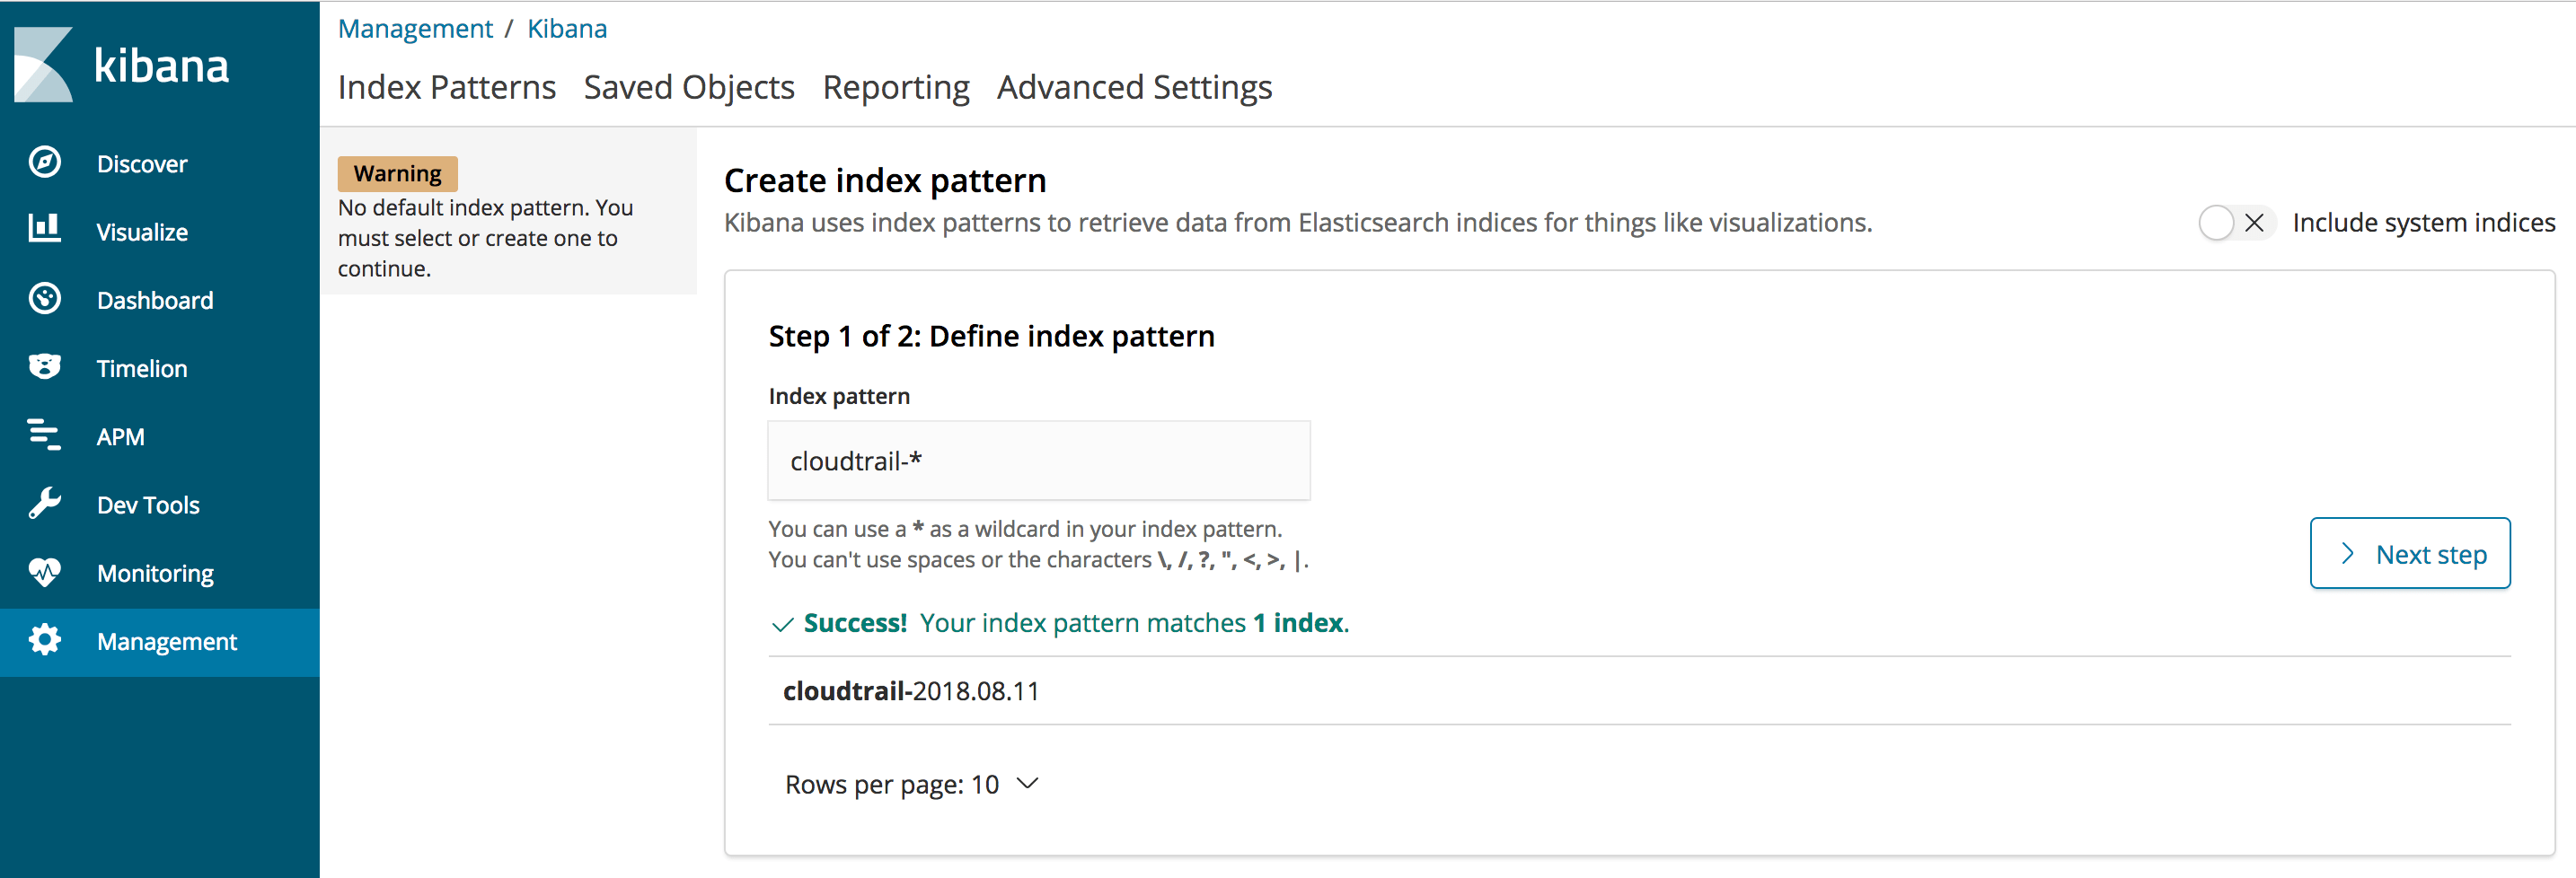
On Kibana, create a new index pattern that match the index format used to store the logs:
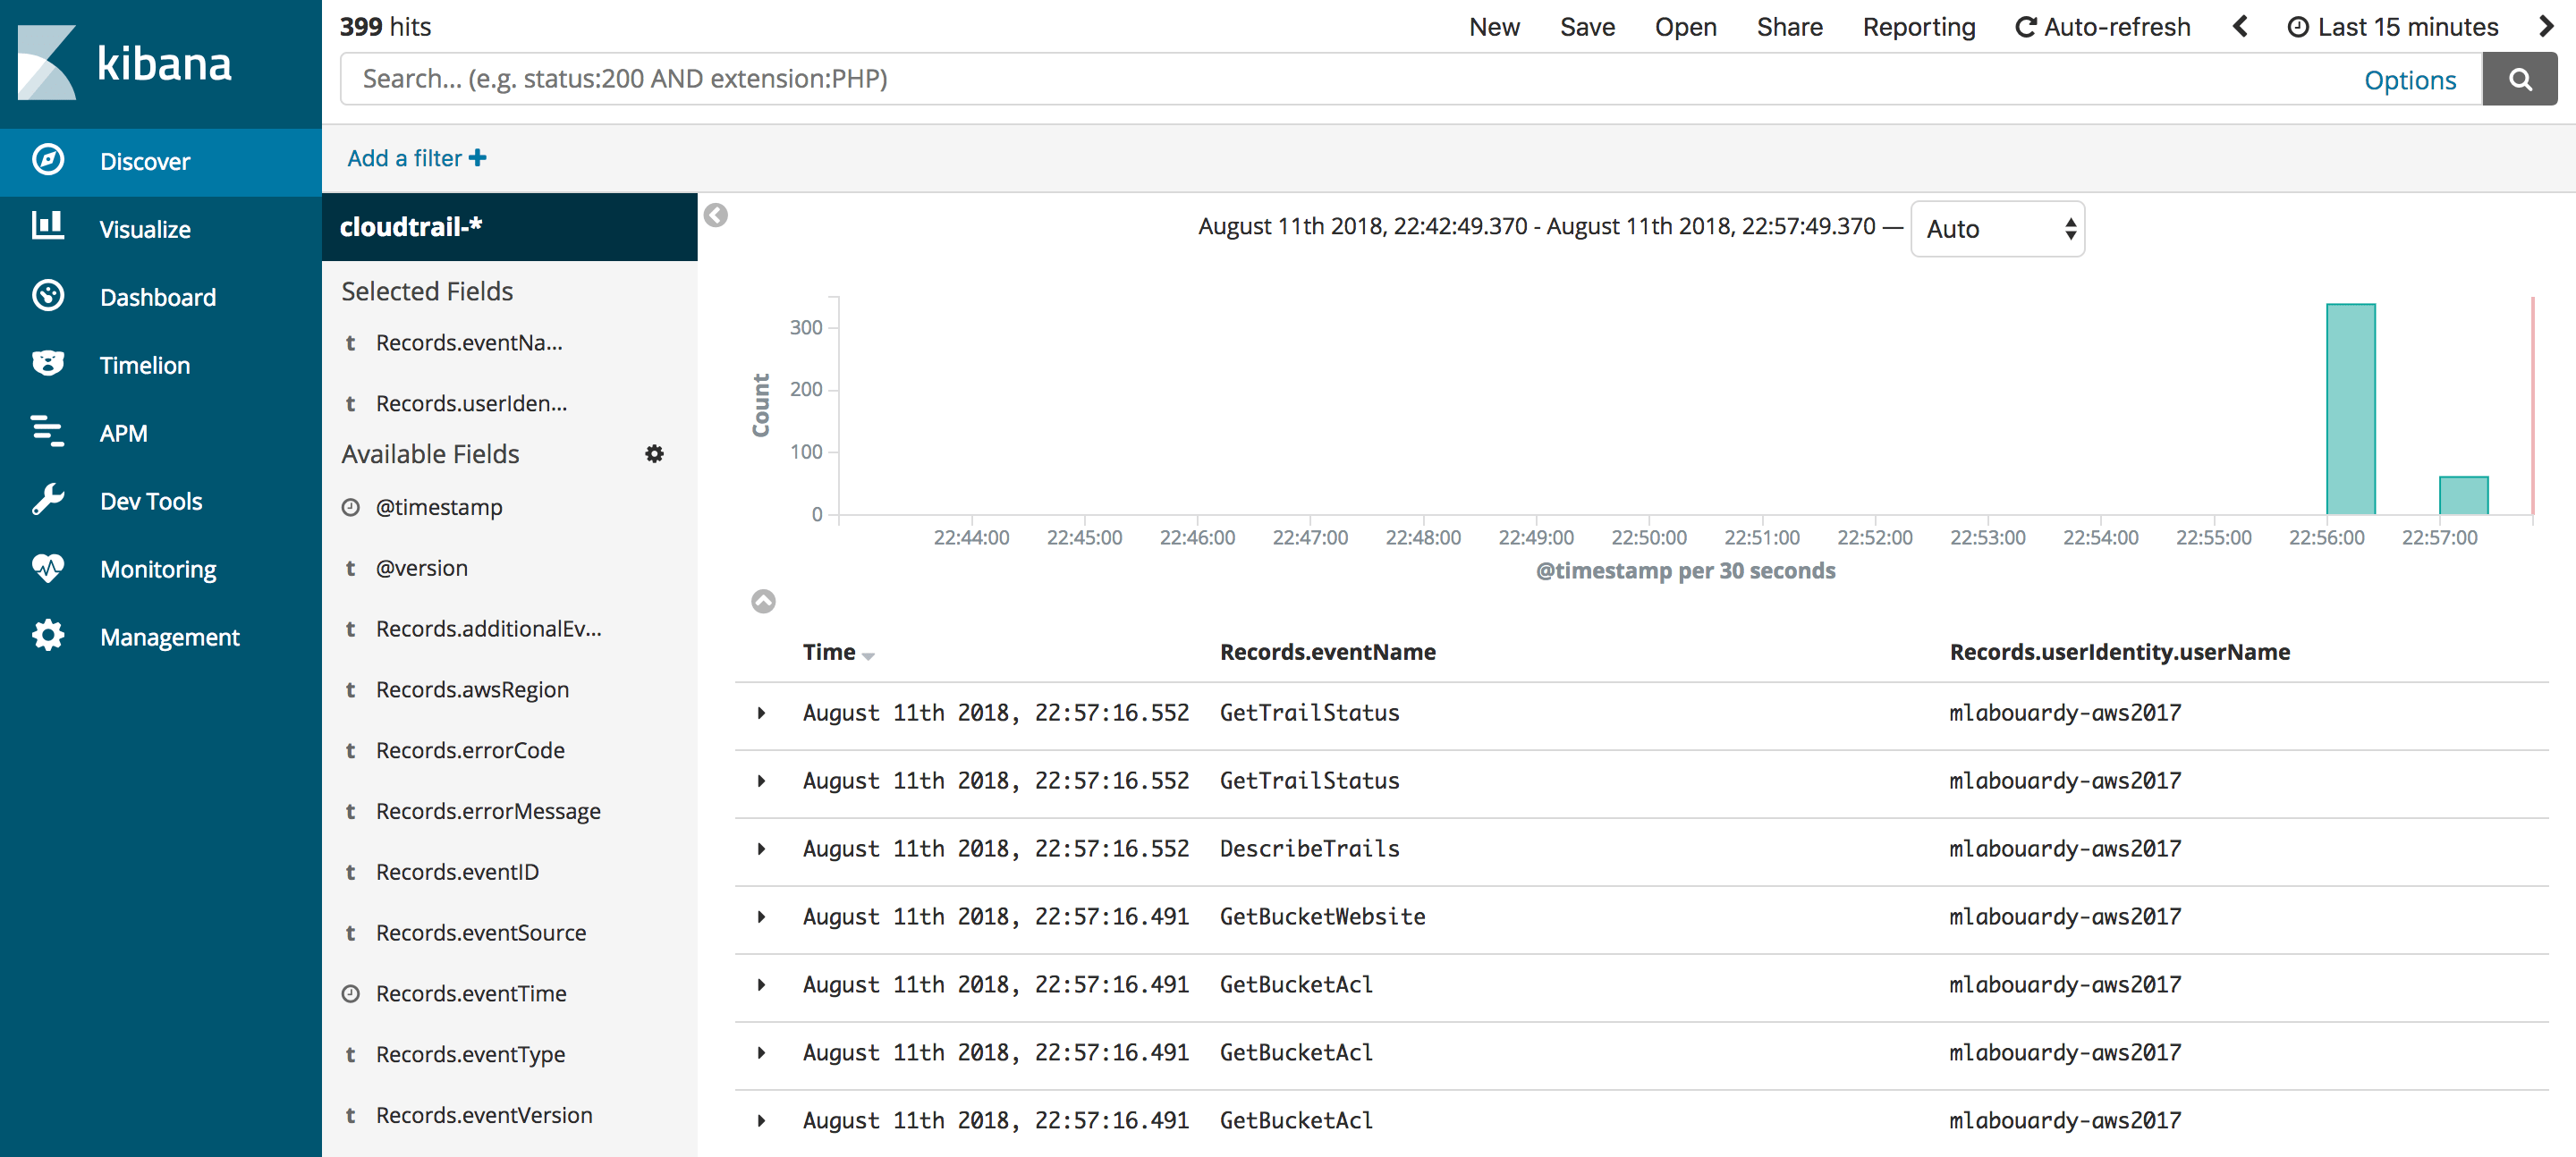
After creating index, we can start exploring our CloudTrail events:
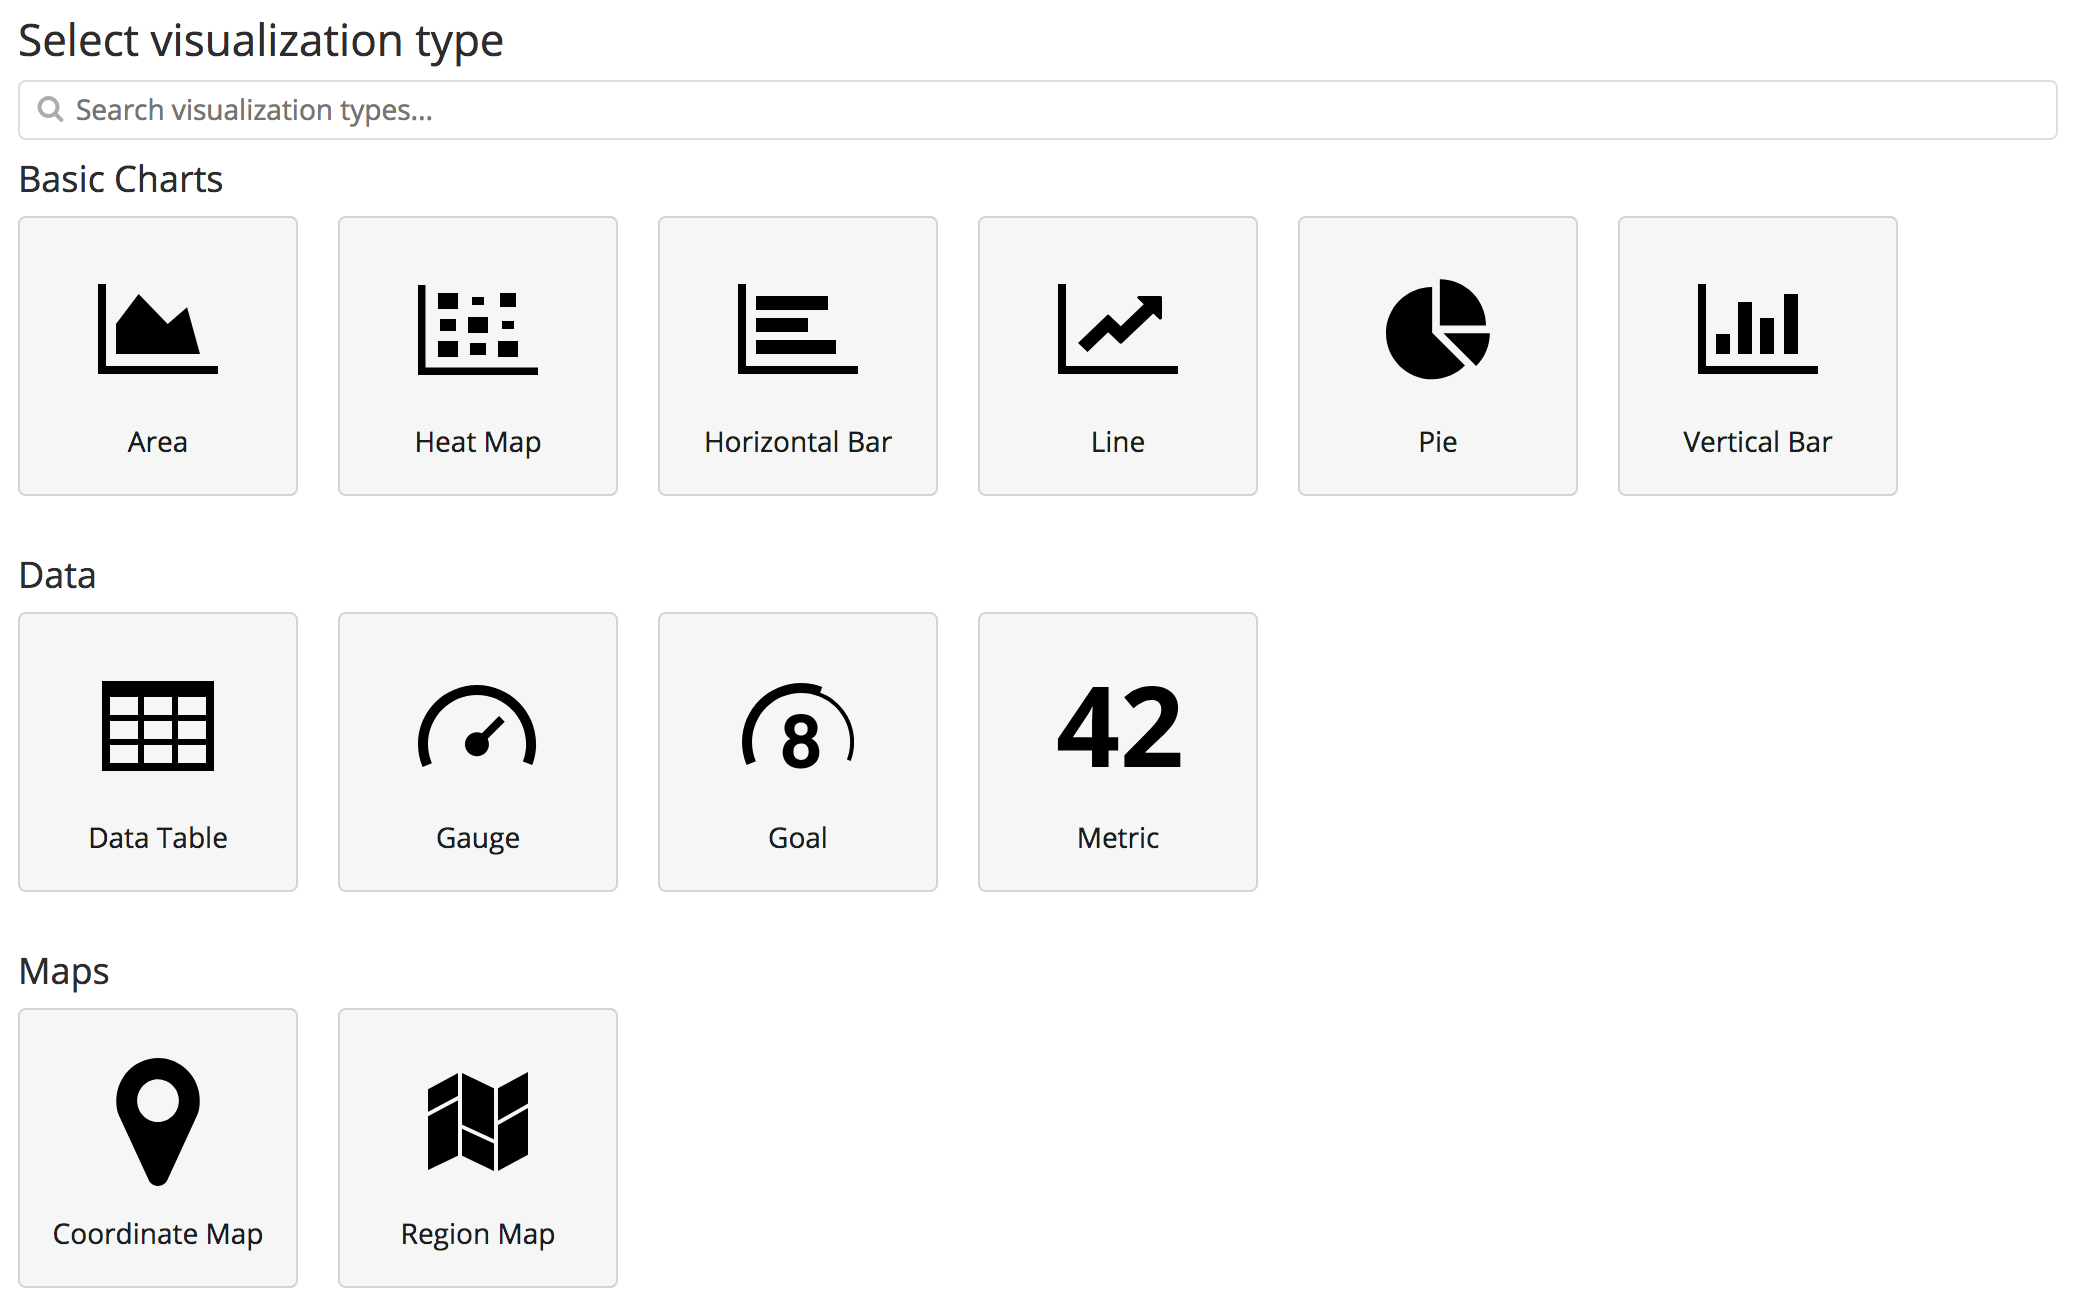
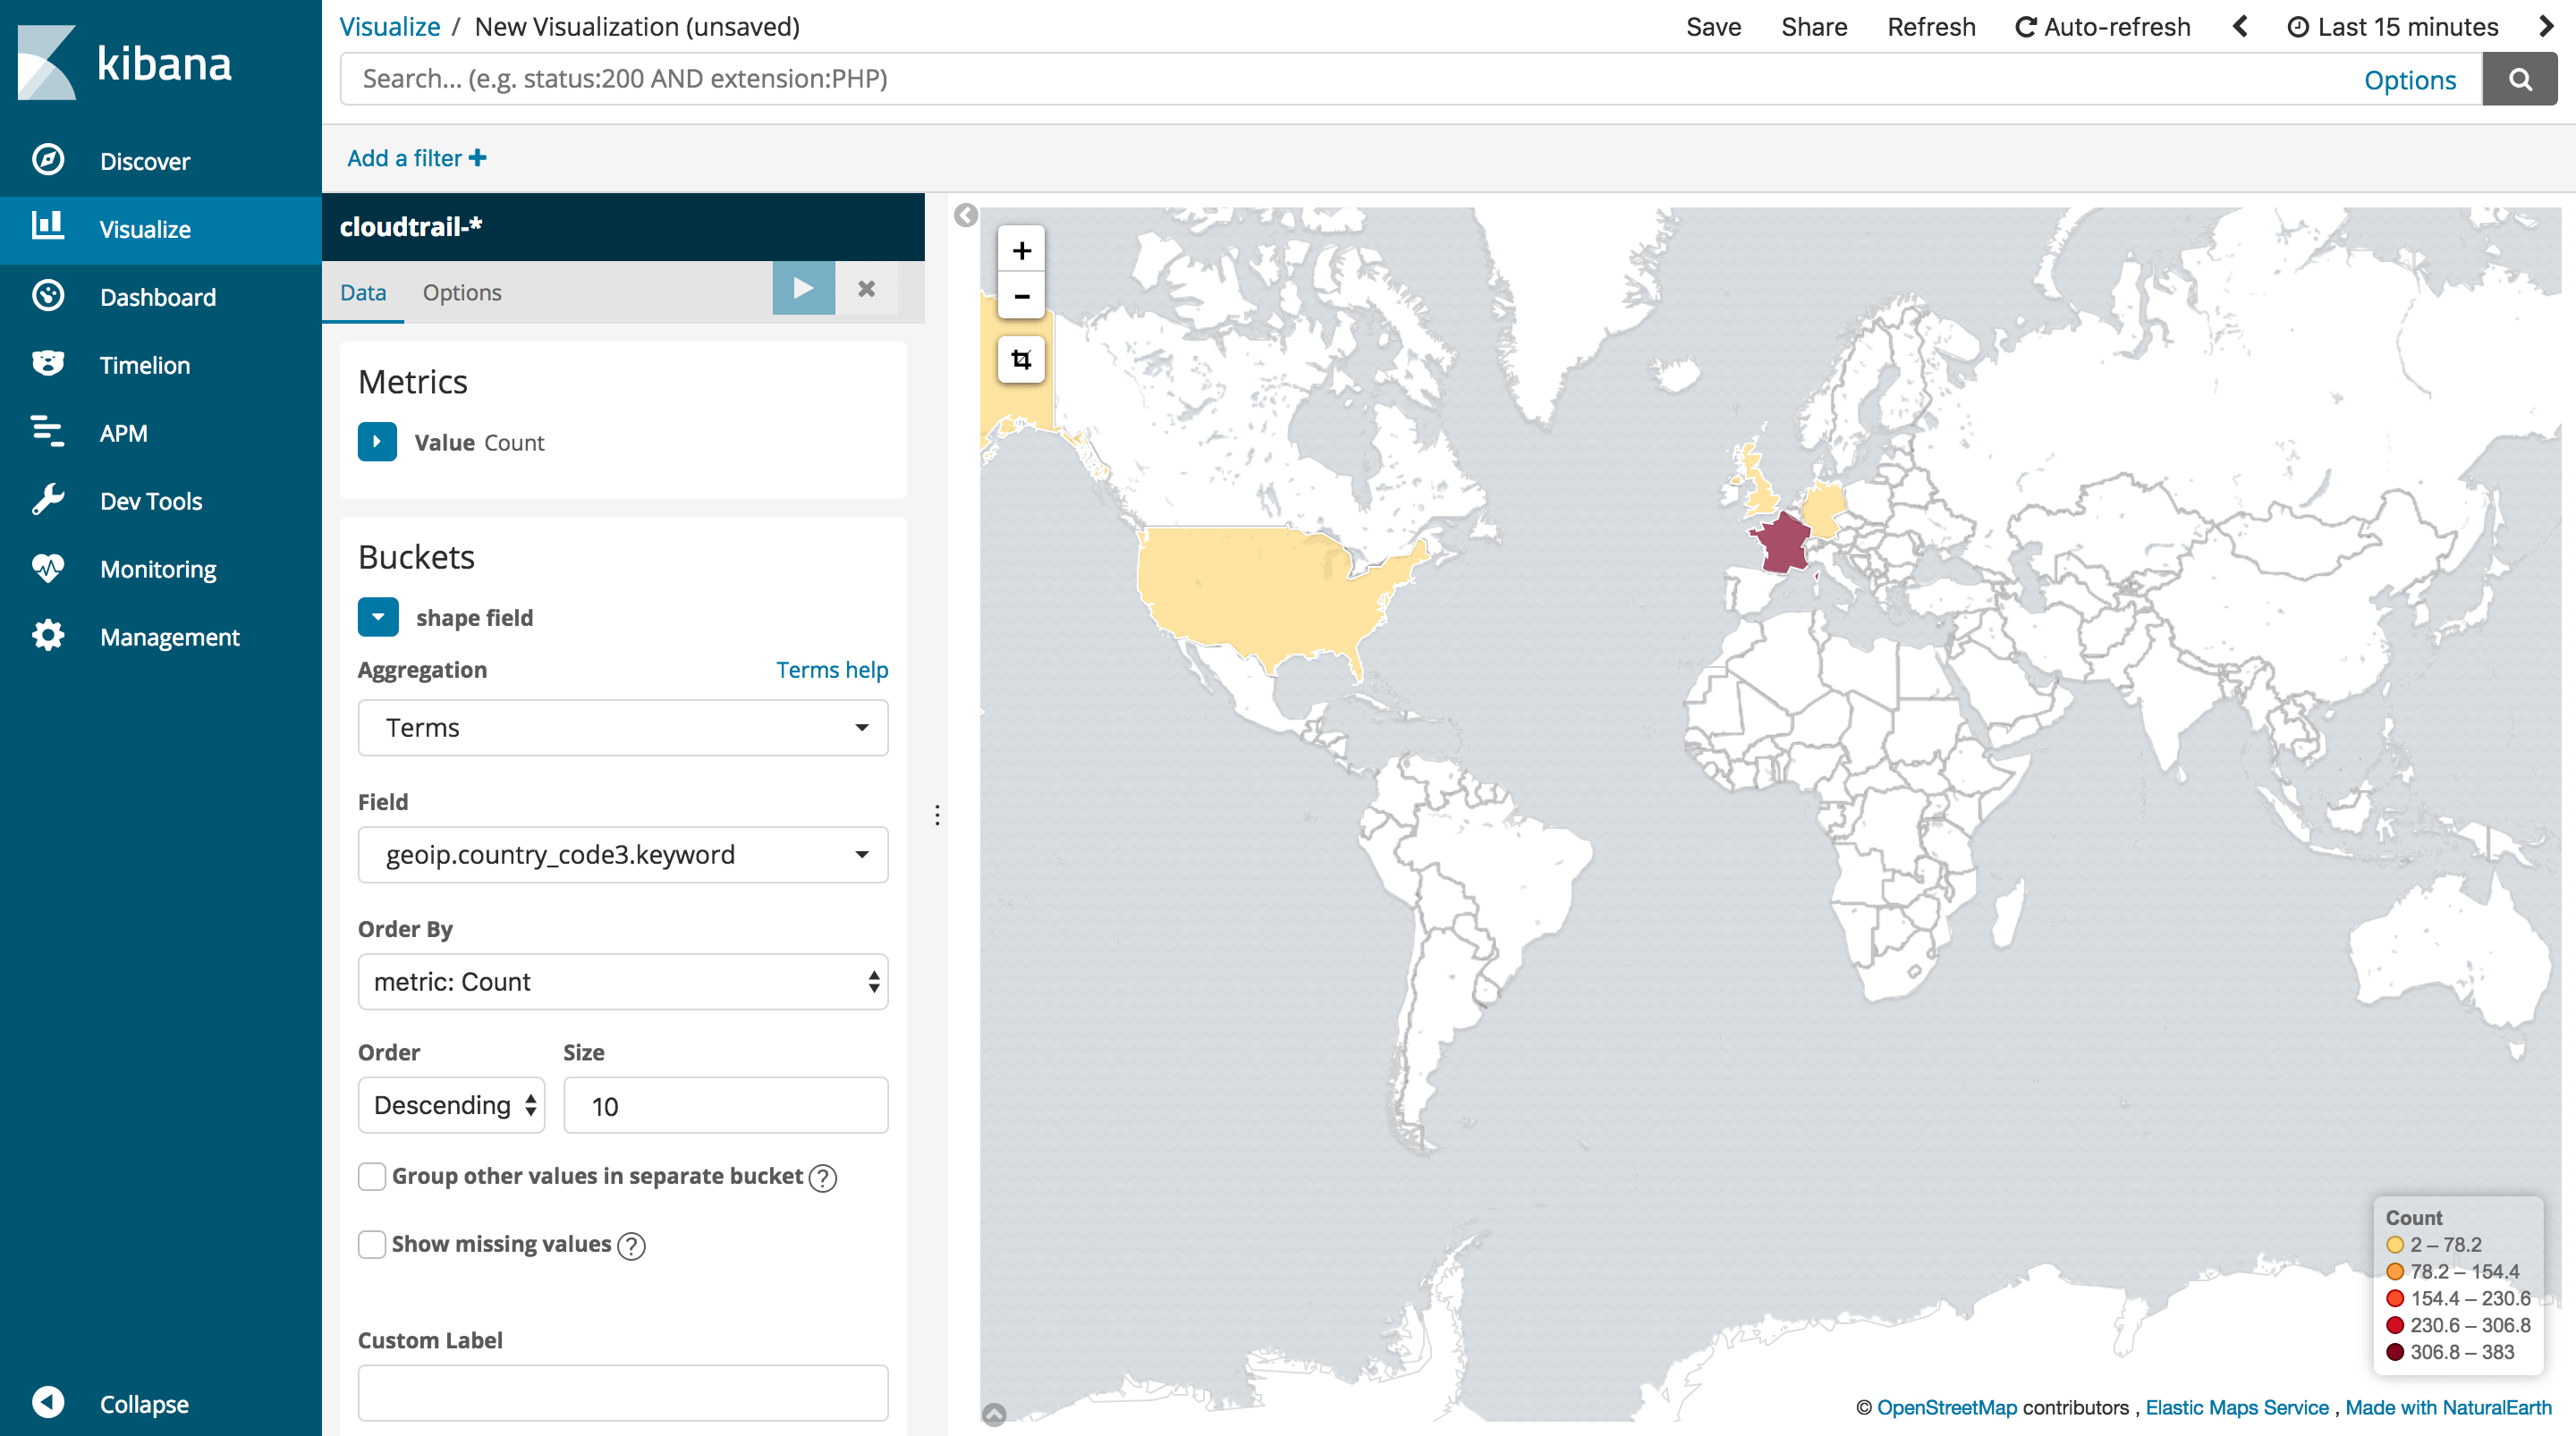
Now that we have processed data inside Elasticsearch, let’s build some graphs. We will use the Map visualization in Kibana to monitor geo access to our AWS environment:
You can now see where the environment is being accessed from:
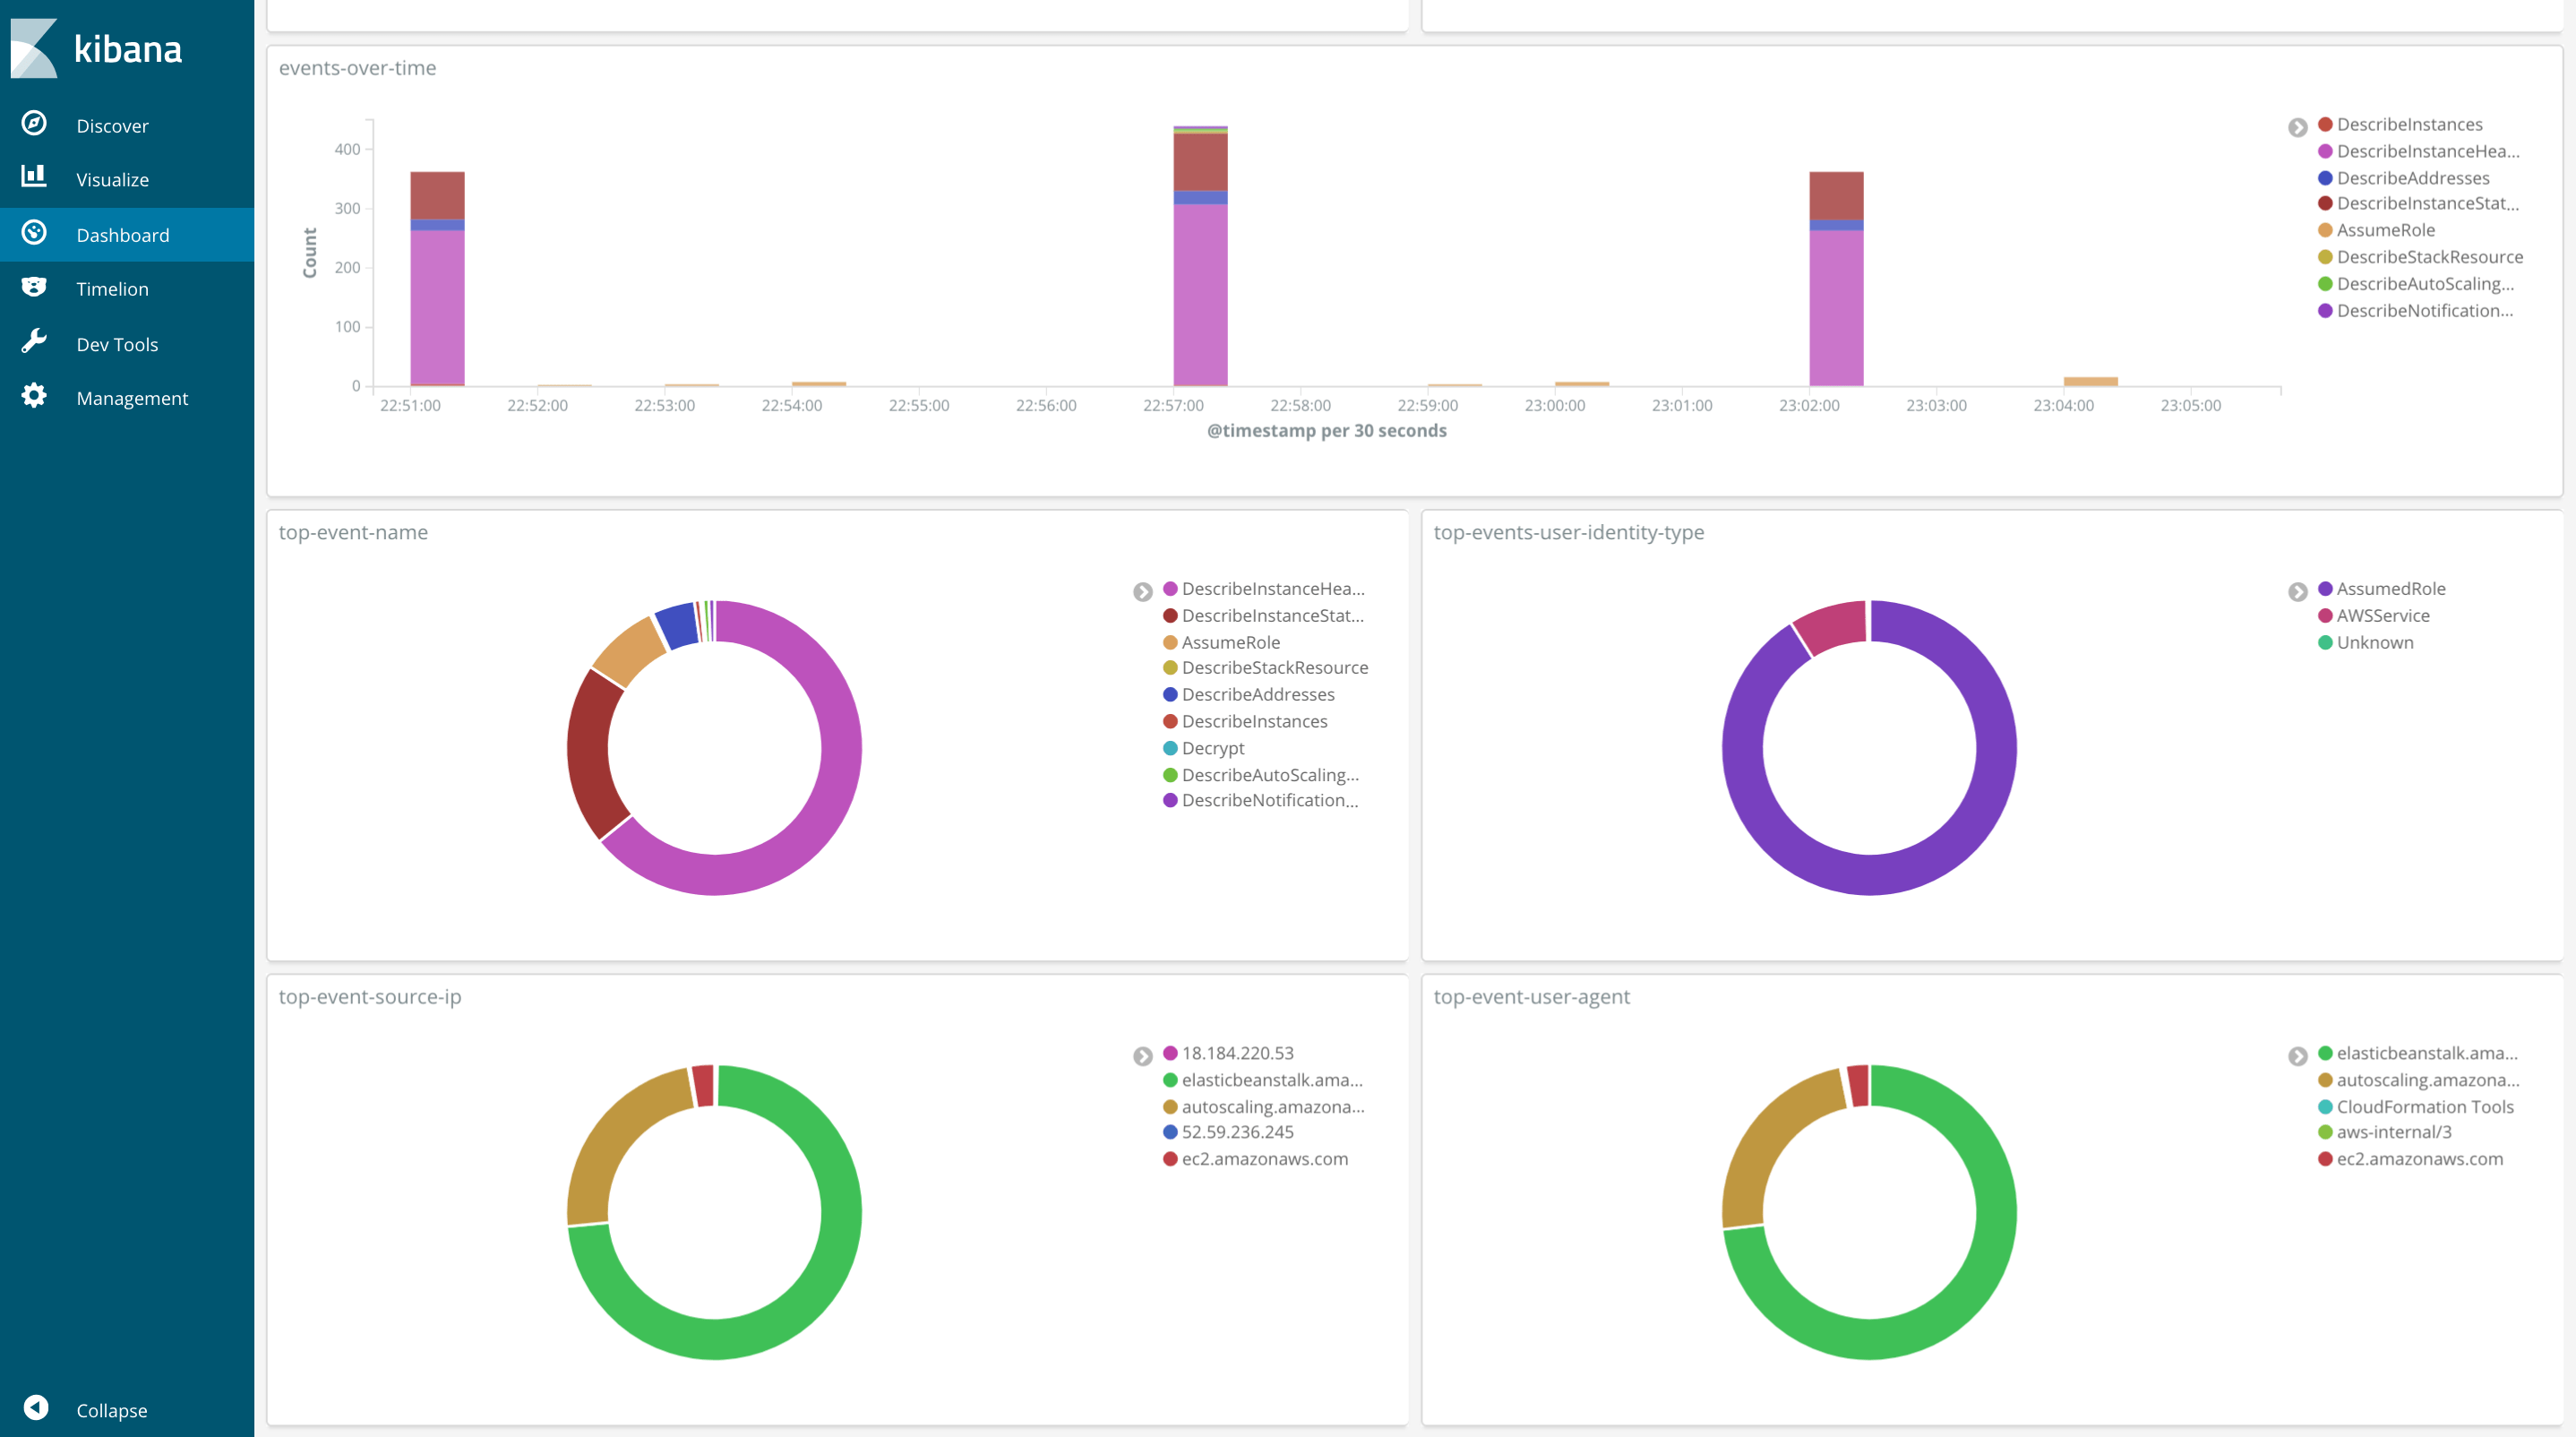
Next, create more widgets to display information about the identity of the user, the user agent and actions taken by the user. Which will look something like this:
You can take this further and setup alerts based on specific event (someone accesses your environment from an undefined location) to be alerted in near real-time.
Full code can be found on my GitHub. Make sure to drop your comments, feedback, or suggestions below — or connect with me directly on Twitter @mlabouardy.
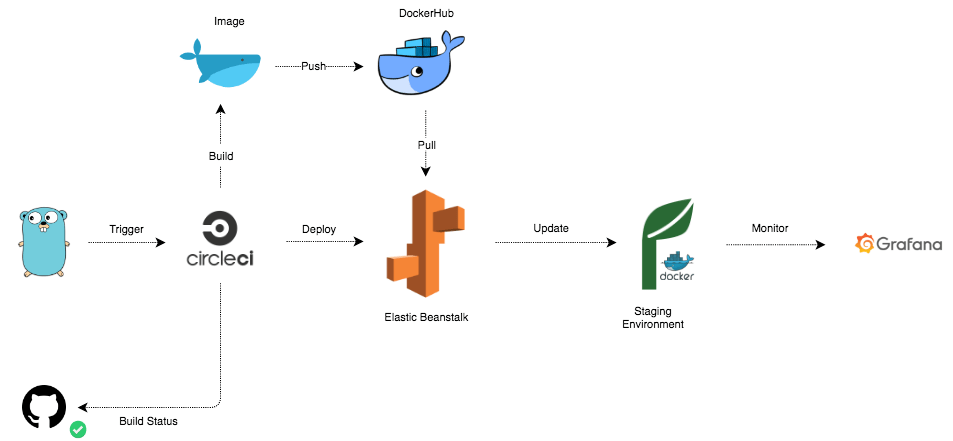
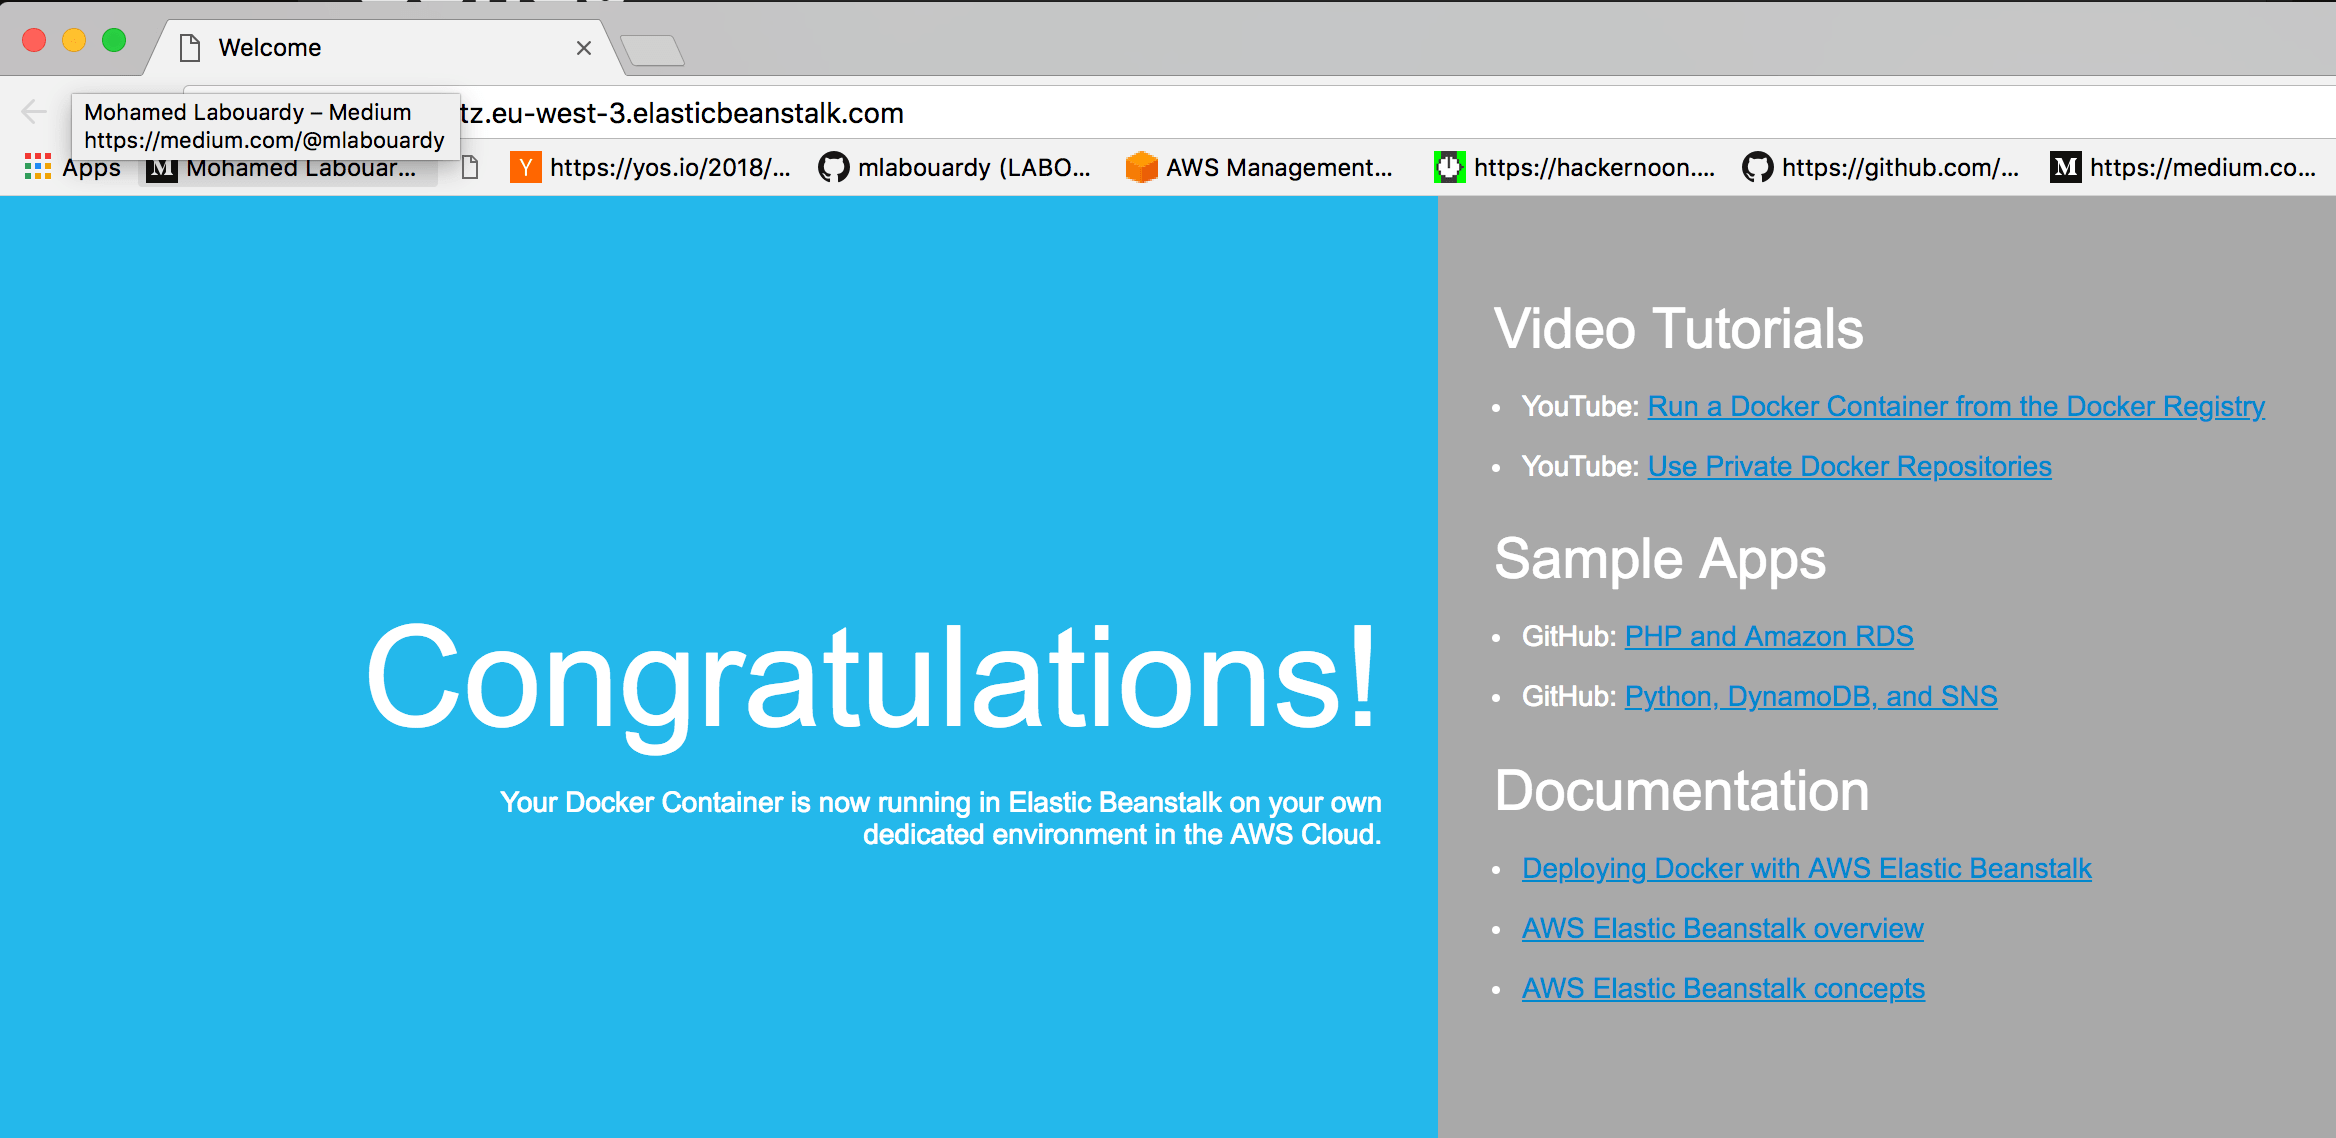
AWS Elastic Beanstalk is one of the most used PaaS today, it allows you to deploy your application without provisioning the underlying infrastructure while maintaining the high availability of your application. However, it’s painful to use due to the lack of documentation and real-world scenarios. In this post, I will walk you through how to use Elastic Beanstalk to deploy Docker containers from scratch. Followed by how to automate your deployment process with a Continuous Integration pipeline. At the end of this post, you should be familiar with advanced topics like debugging and monitoring of your applications in EB.
1 – Environment Setup
To get started, create a new Application using the following AWS CLI command:
Next, we will create a Dockerfile to build the Docker image. Go is a compiled language, therefore we can use the Docker multi-stage feature to build a lightweight Docker image:
1
2
3
4
5
6
7
8
9
10
11
12
13
FROM golang:1.10 as builder WORKDIR /go/src/github.com/mlabouardy/docker-eb-ci-mon COPY main.go . RUN CGO_ENABLED=0 GOOS=linux go build -a -installsuffix cgo -o app .
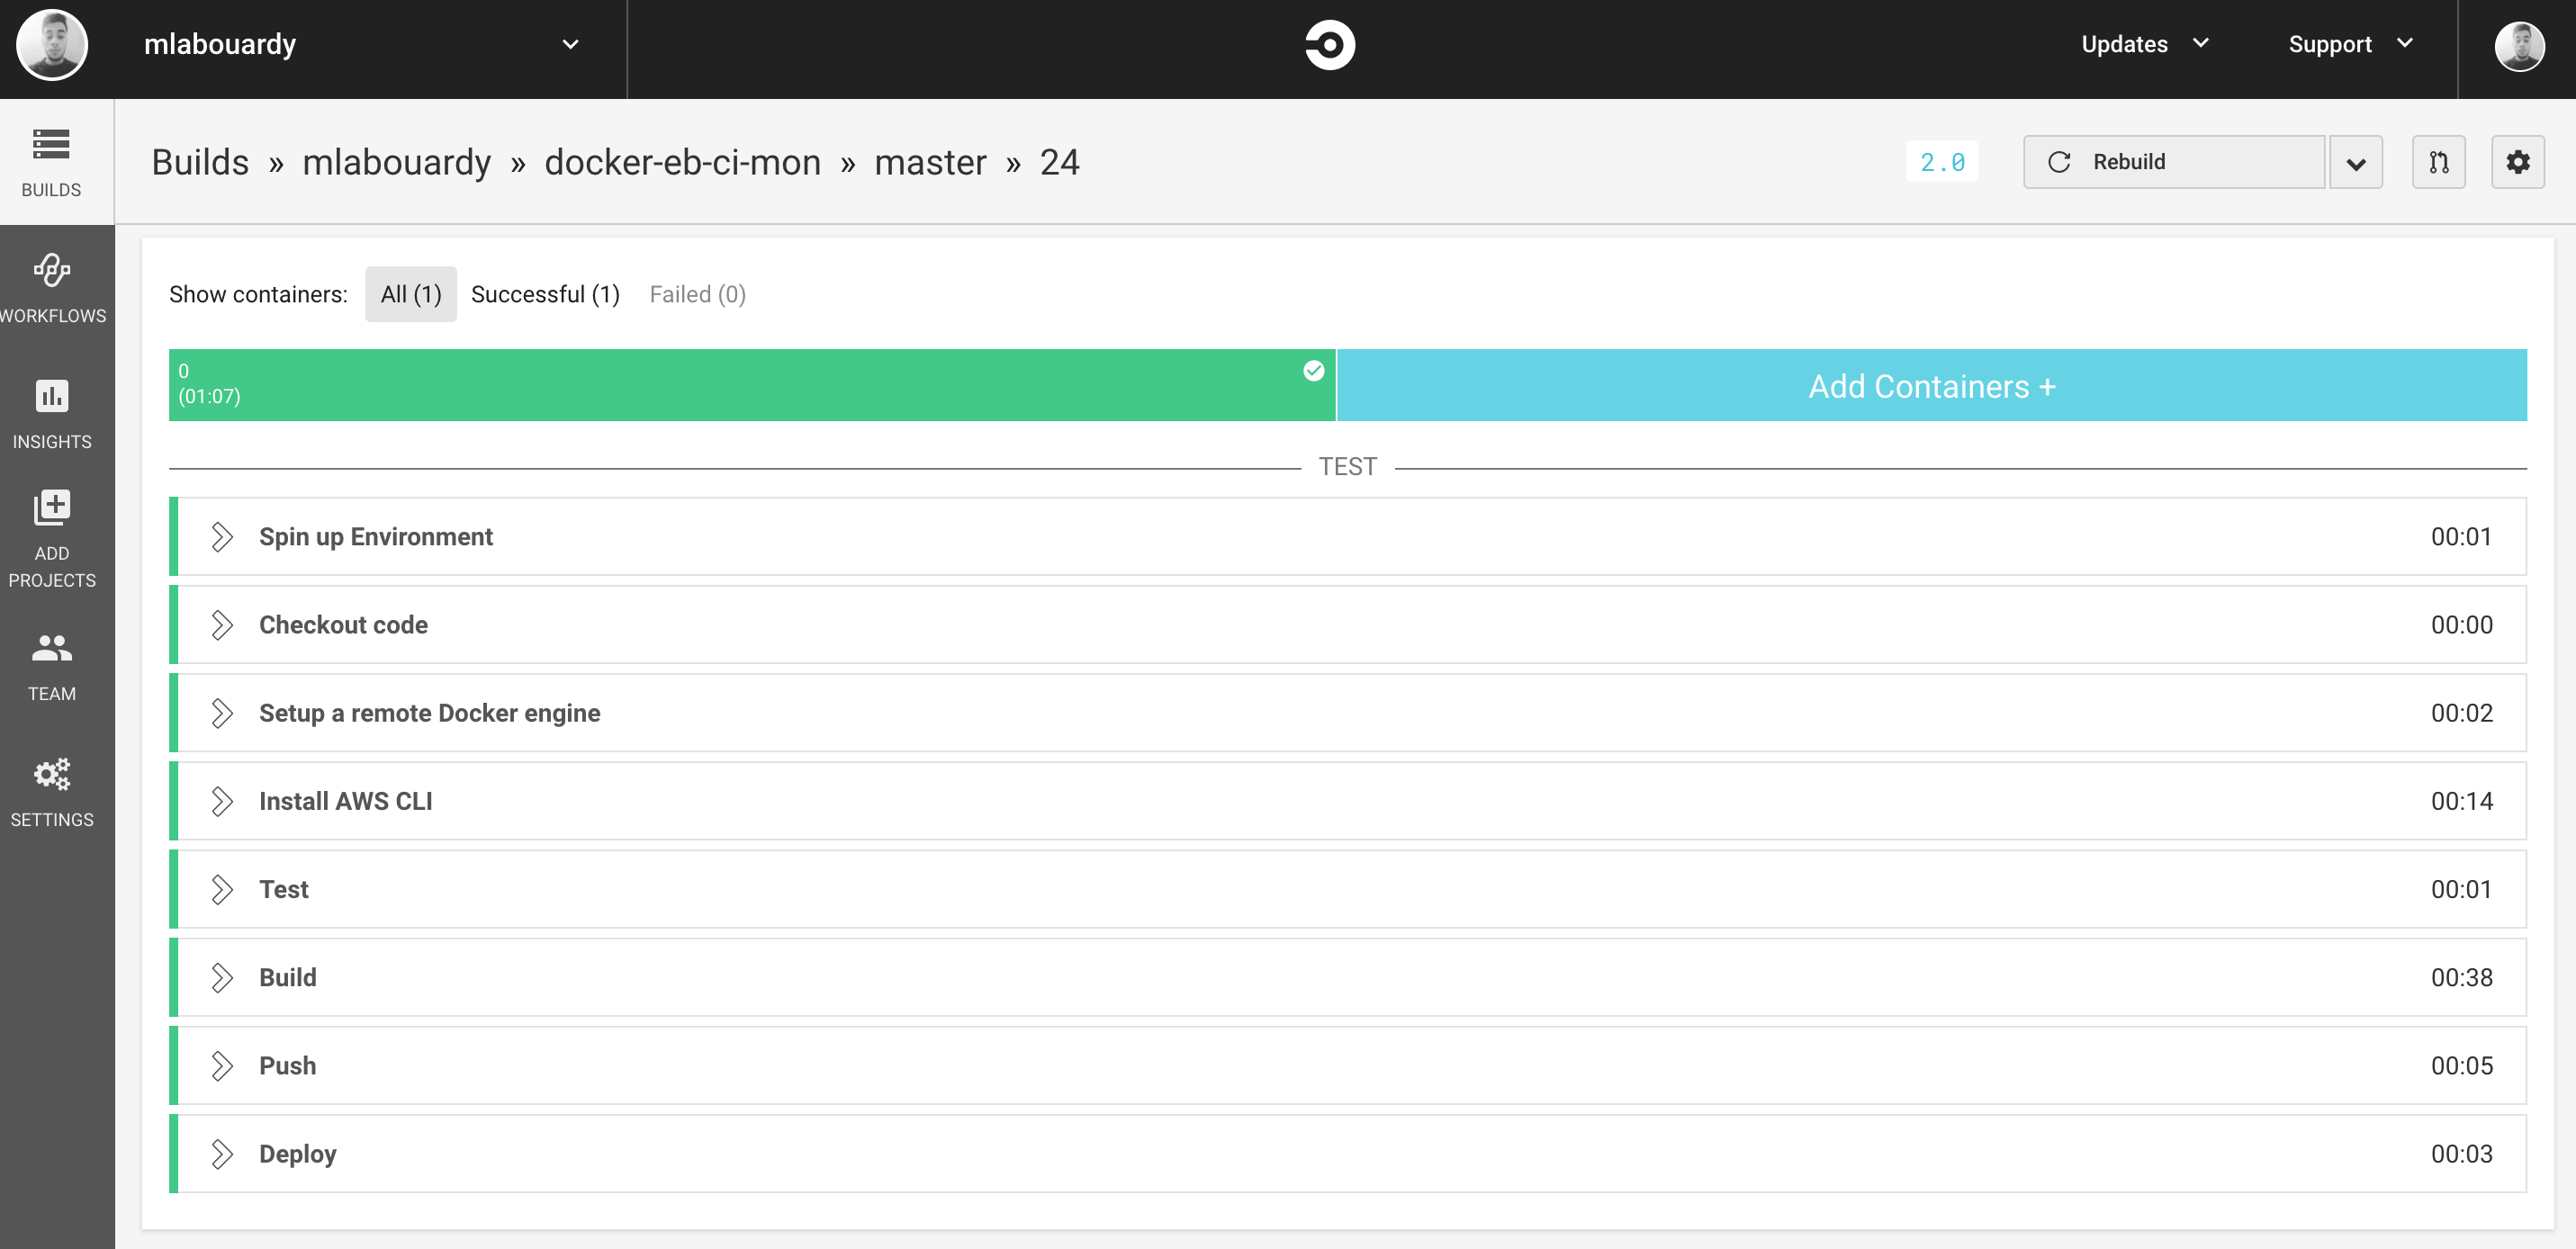
The pipeline will firstly prepare the environment, installing the AWS CLI. Then run unit tests. Next, a Docker image will be built, then pushed to DockerHub. Last step is creating a new application bundle and deploying the bundle to Elastic Beanstalk.
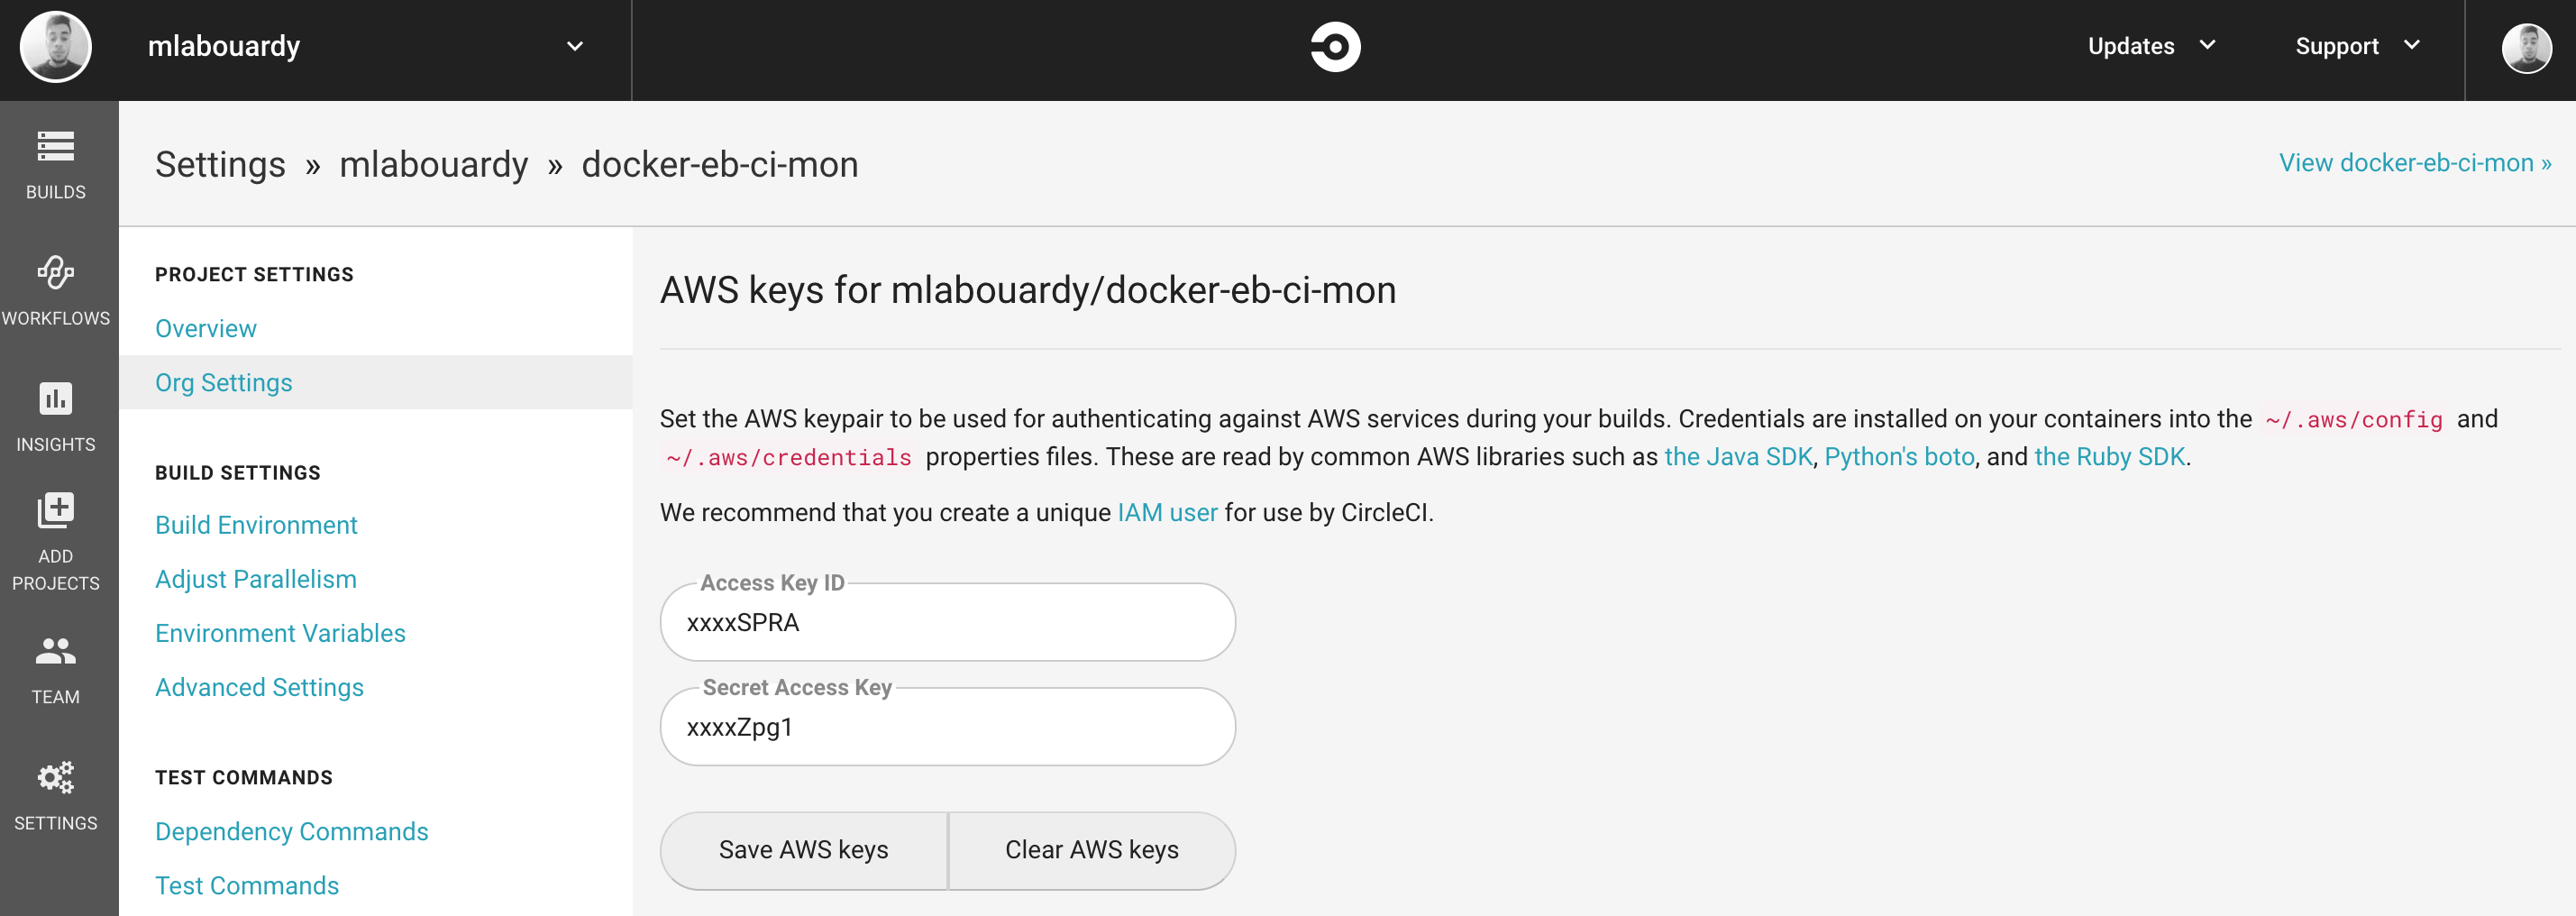
In order to grant Circle CI permissions to call AWS operations, we need to create a new IAM user with following IAM policy:
Generate AWS access & secret keys. Then, head back to Circle CI and click on the project settings and paste the credentials :
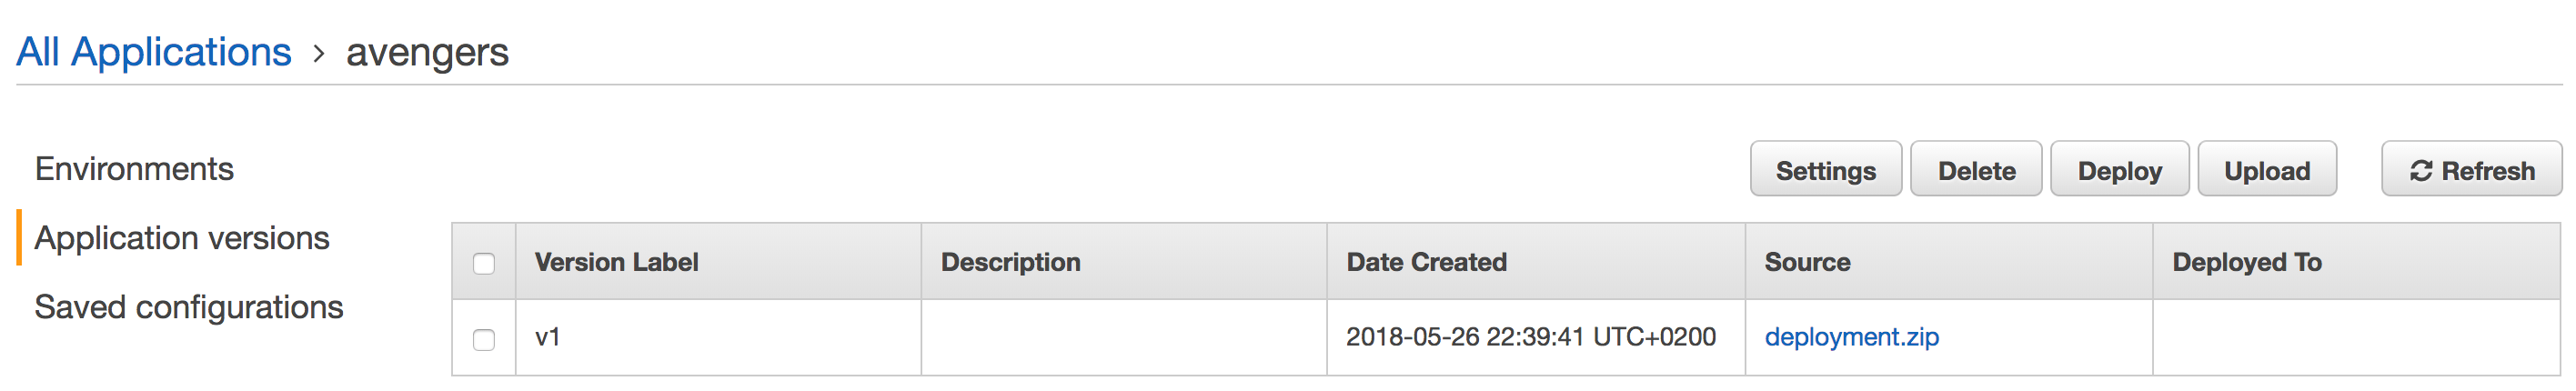
Now, everytime you push a change to your code repository, a build will be triggered:
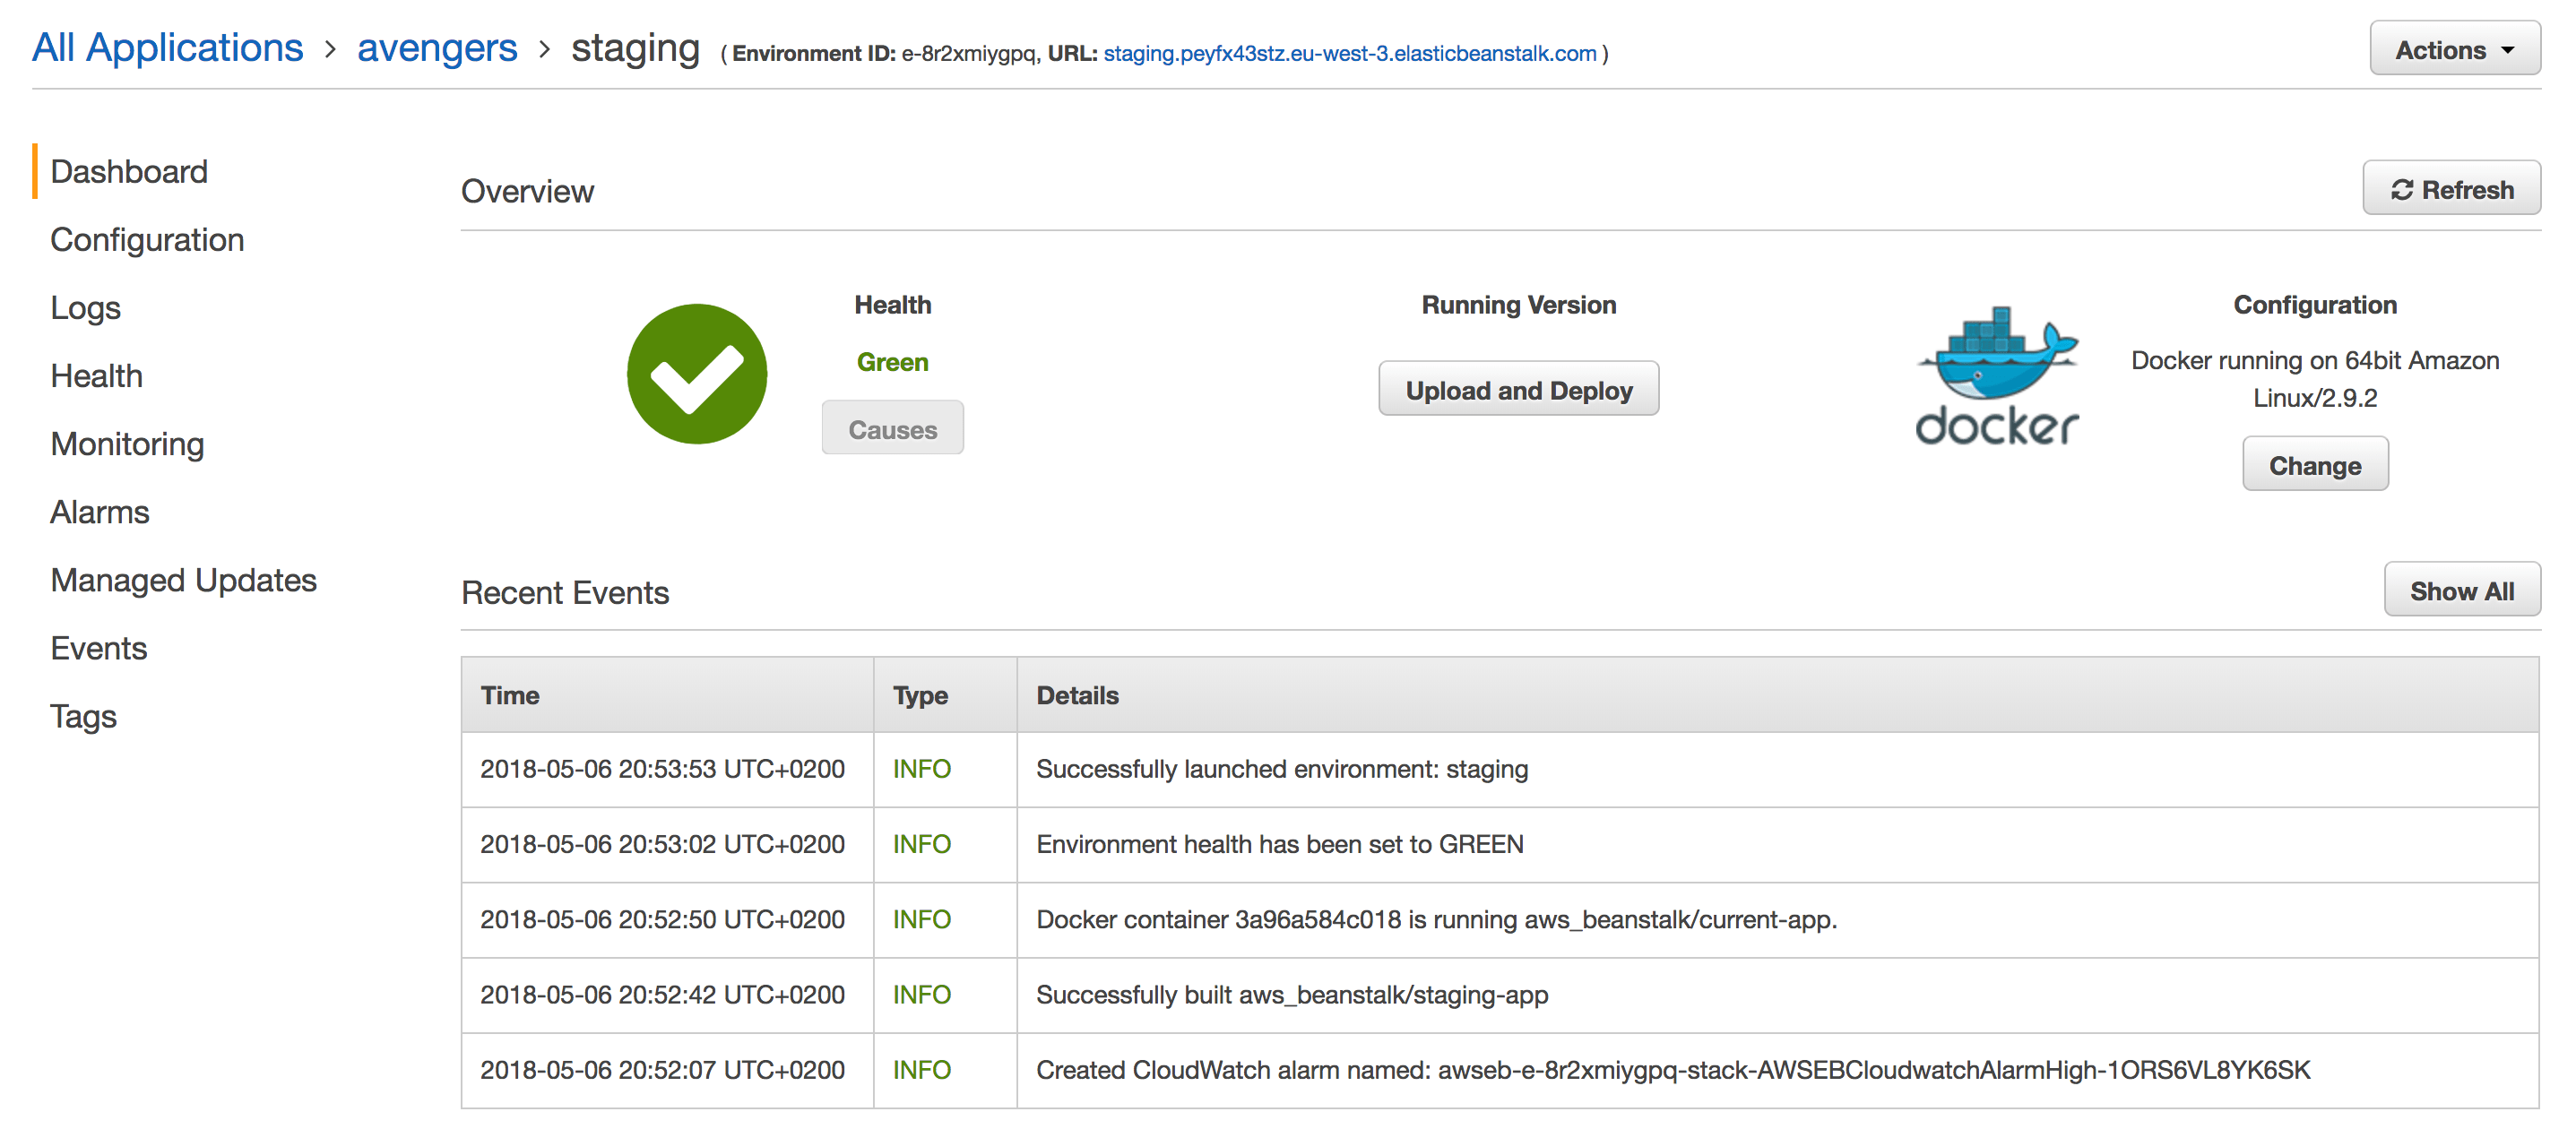
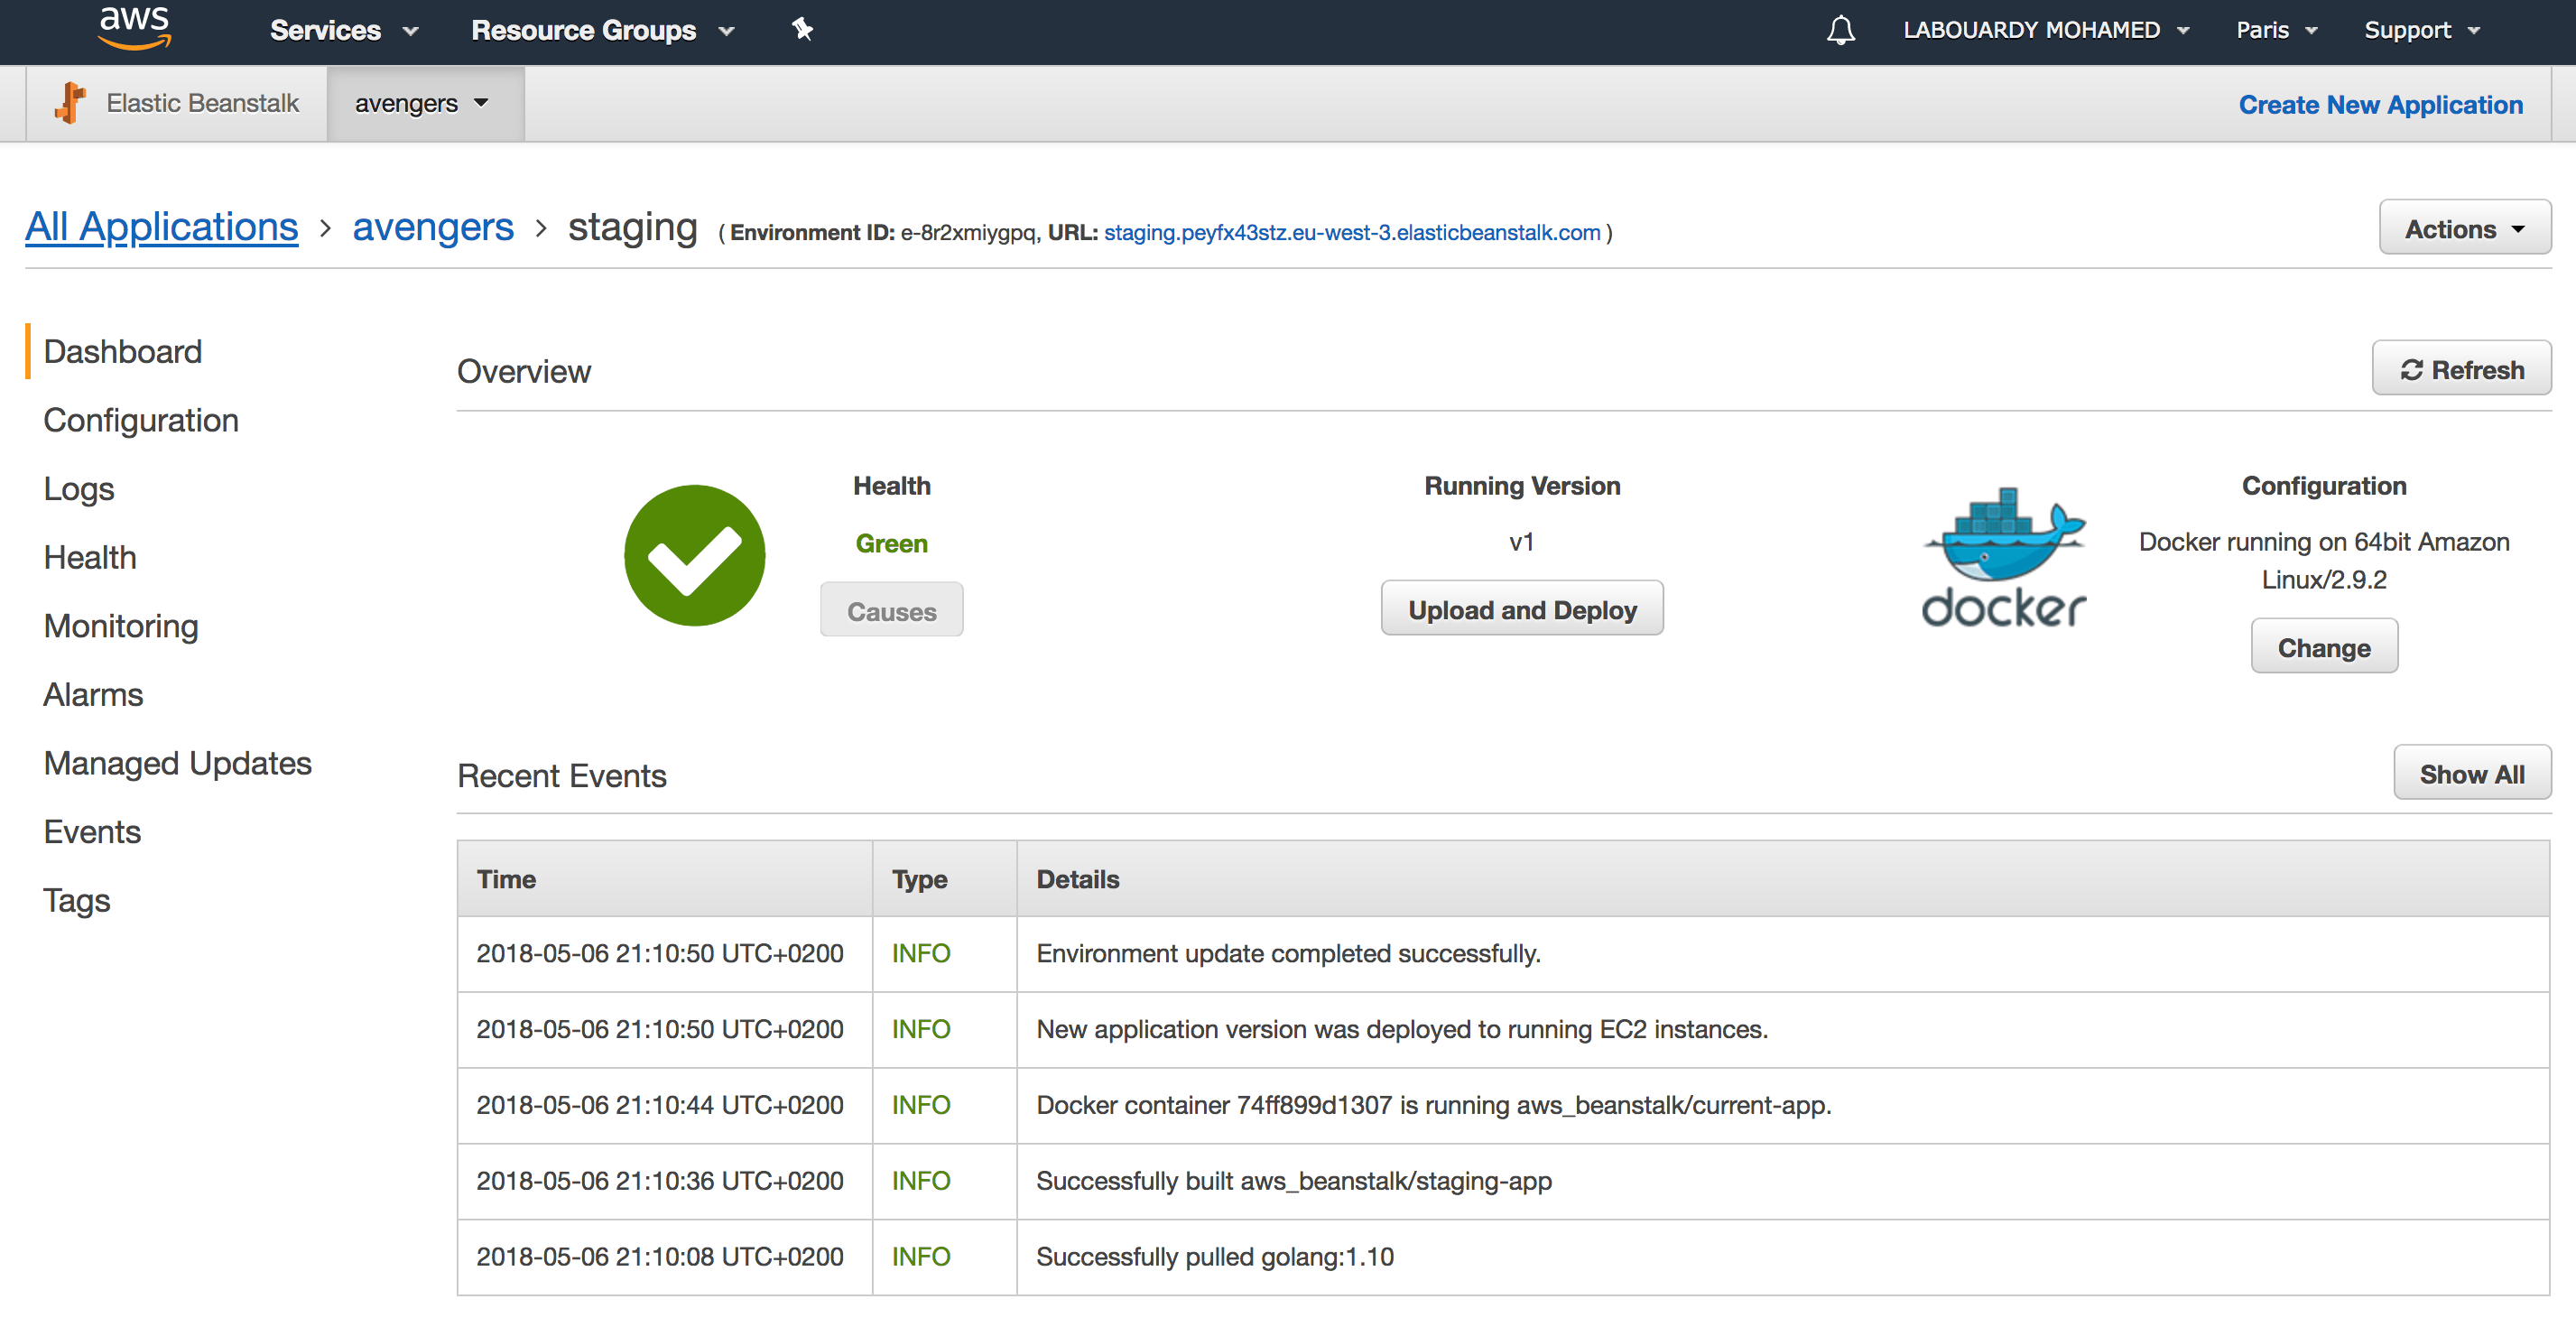
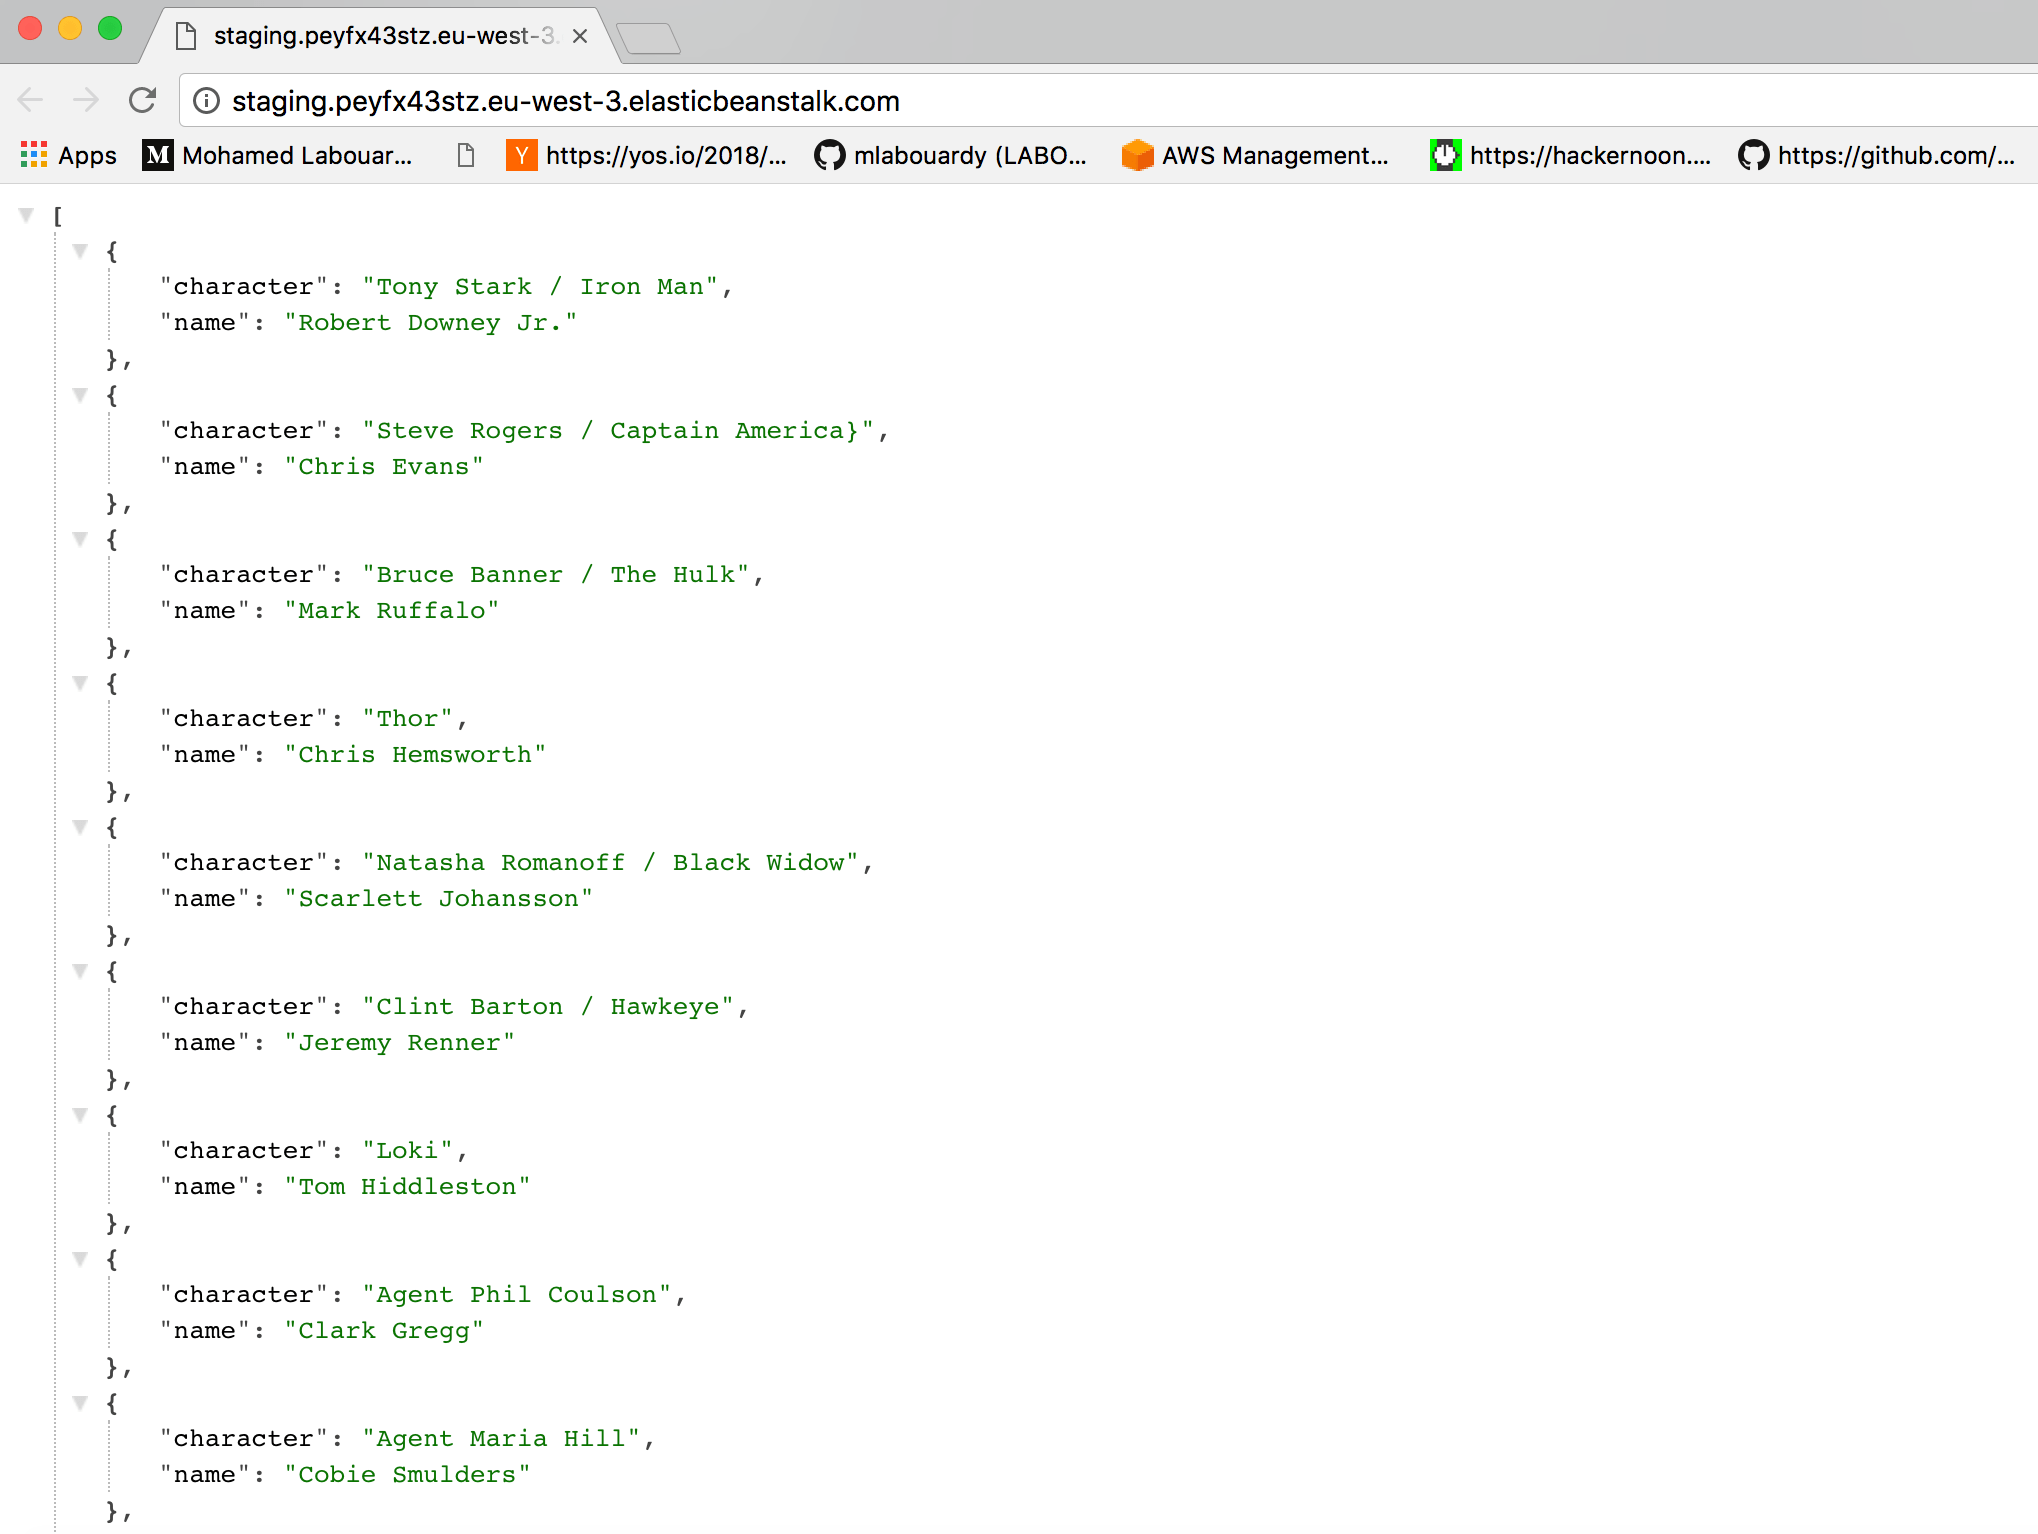
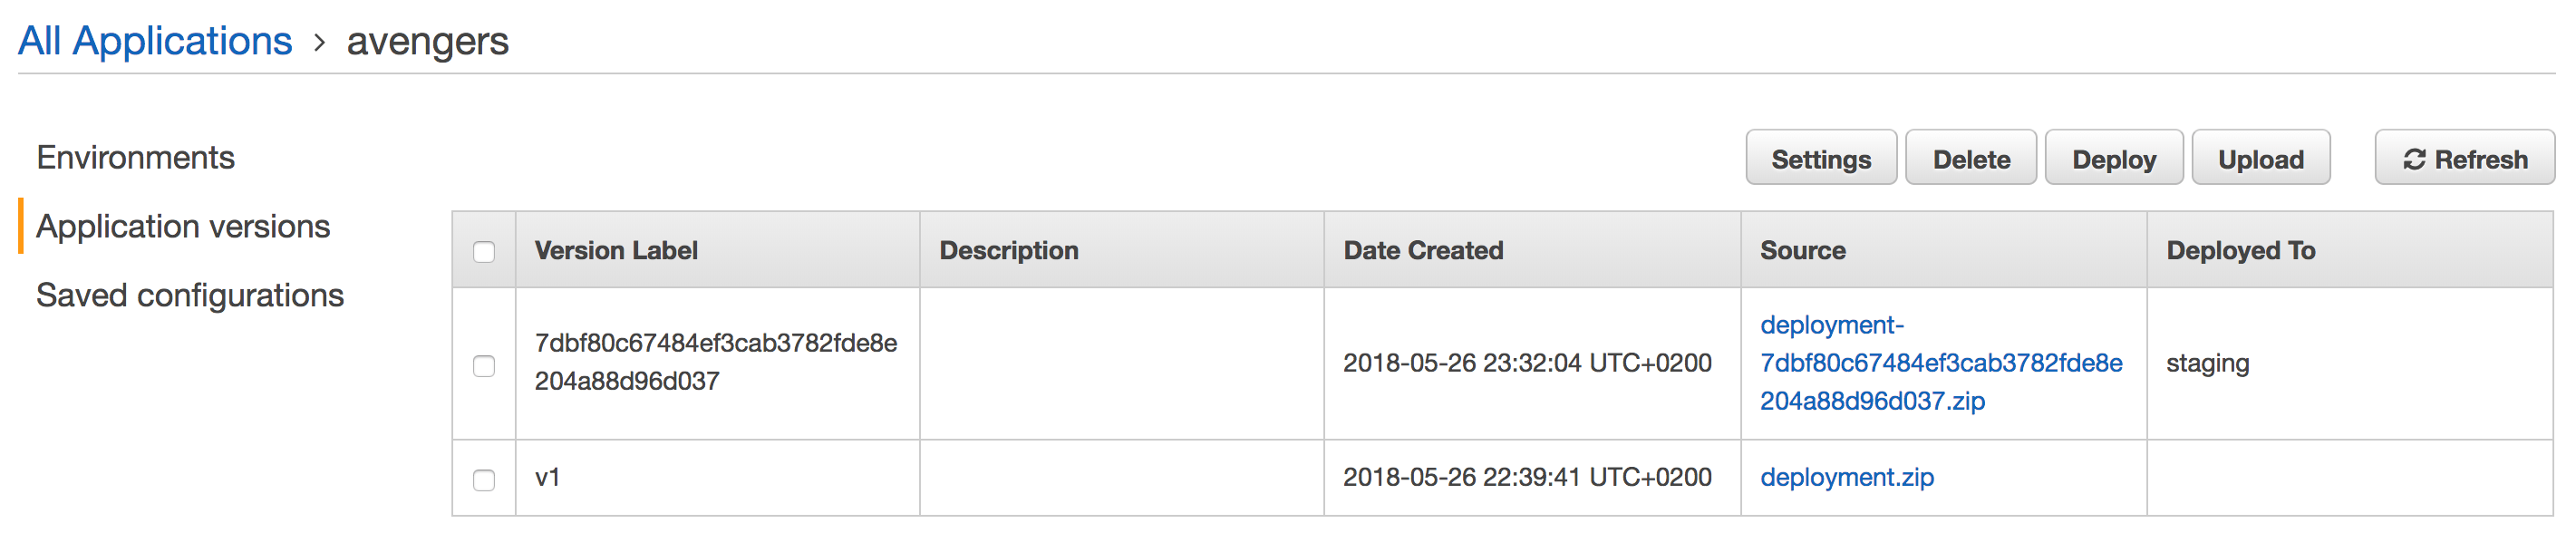
And a new version will be deployed automatically to Elastic Beanstalk:
3 – Monitoring
Monitoring your applications is mandatory. Unfortunately, CloudWatch doesn’t expose useful metrics like Memory usage of your applications in Elastic Beanstalk. Hence, in this part, we will solve this issue by creating our custom metrics.
I will install a data collector agent on the instance. The agent will collect metrics and push them to a time-series database.
To install the agent, we will use .ebextensions folder, on which we will create 3 configuration files:
01-install-telegraf.config: install Telegraf on the instance
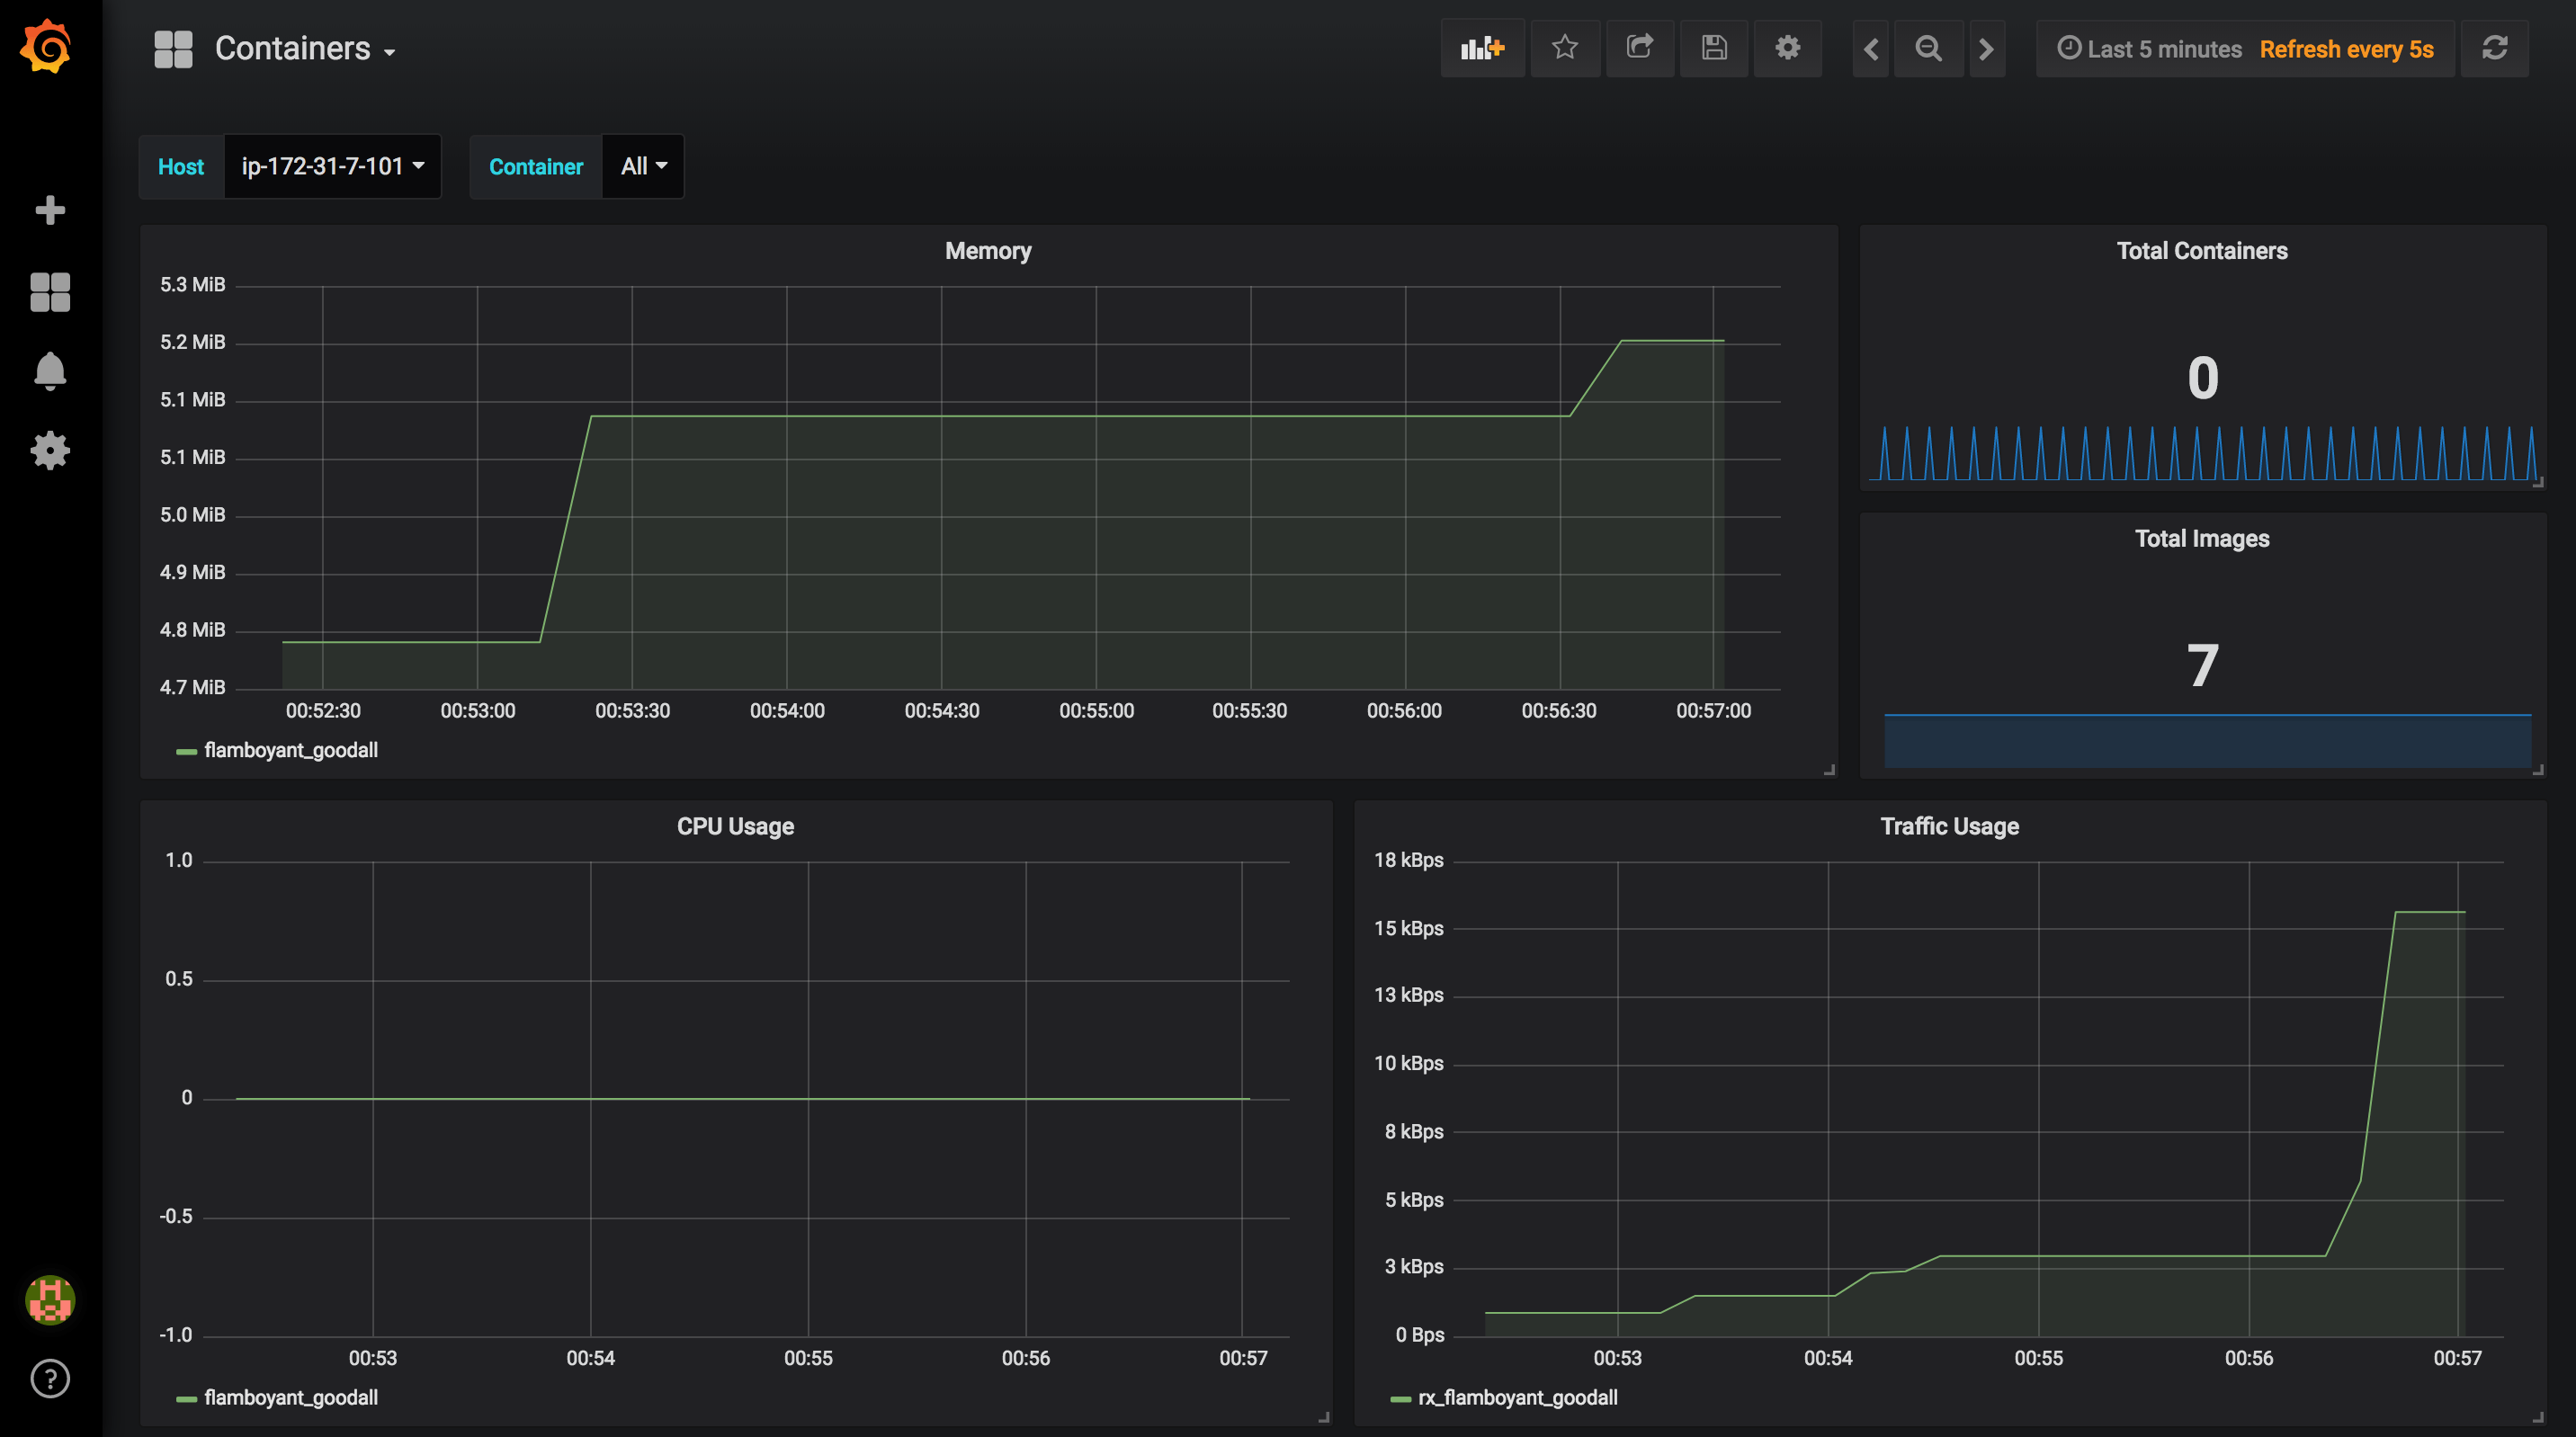
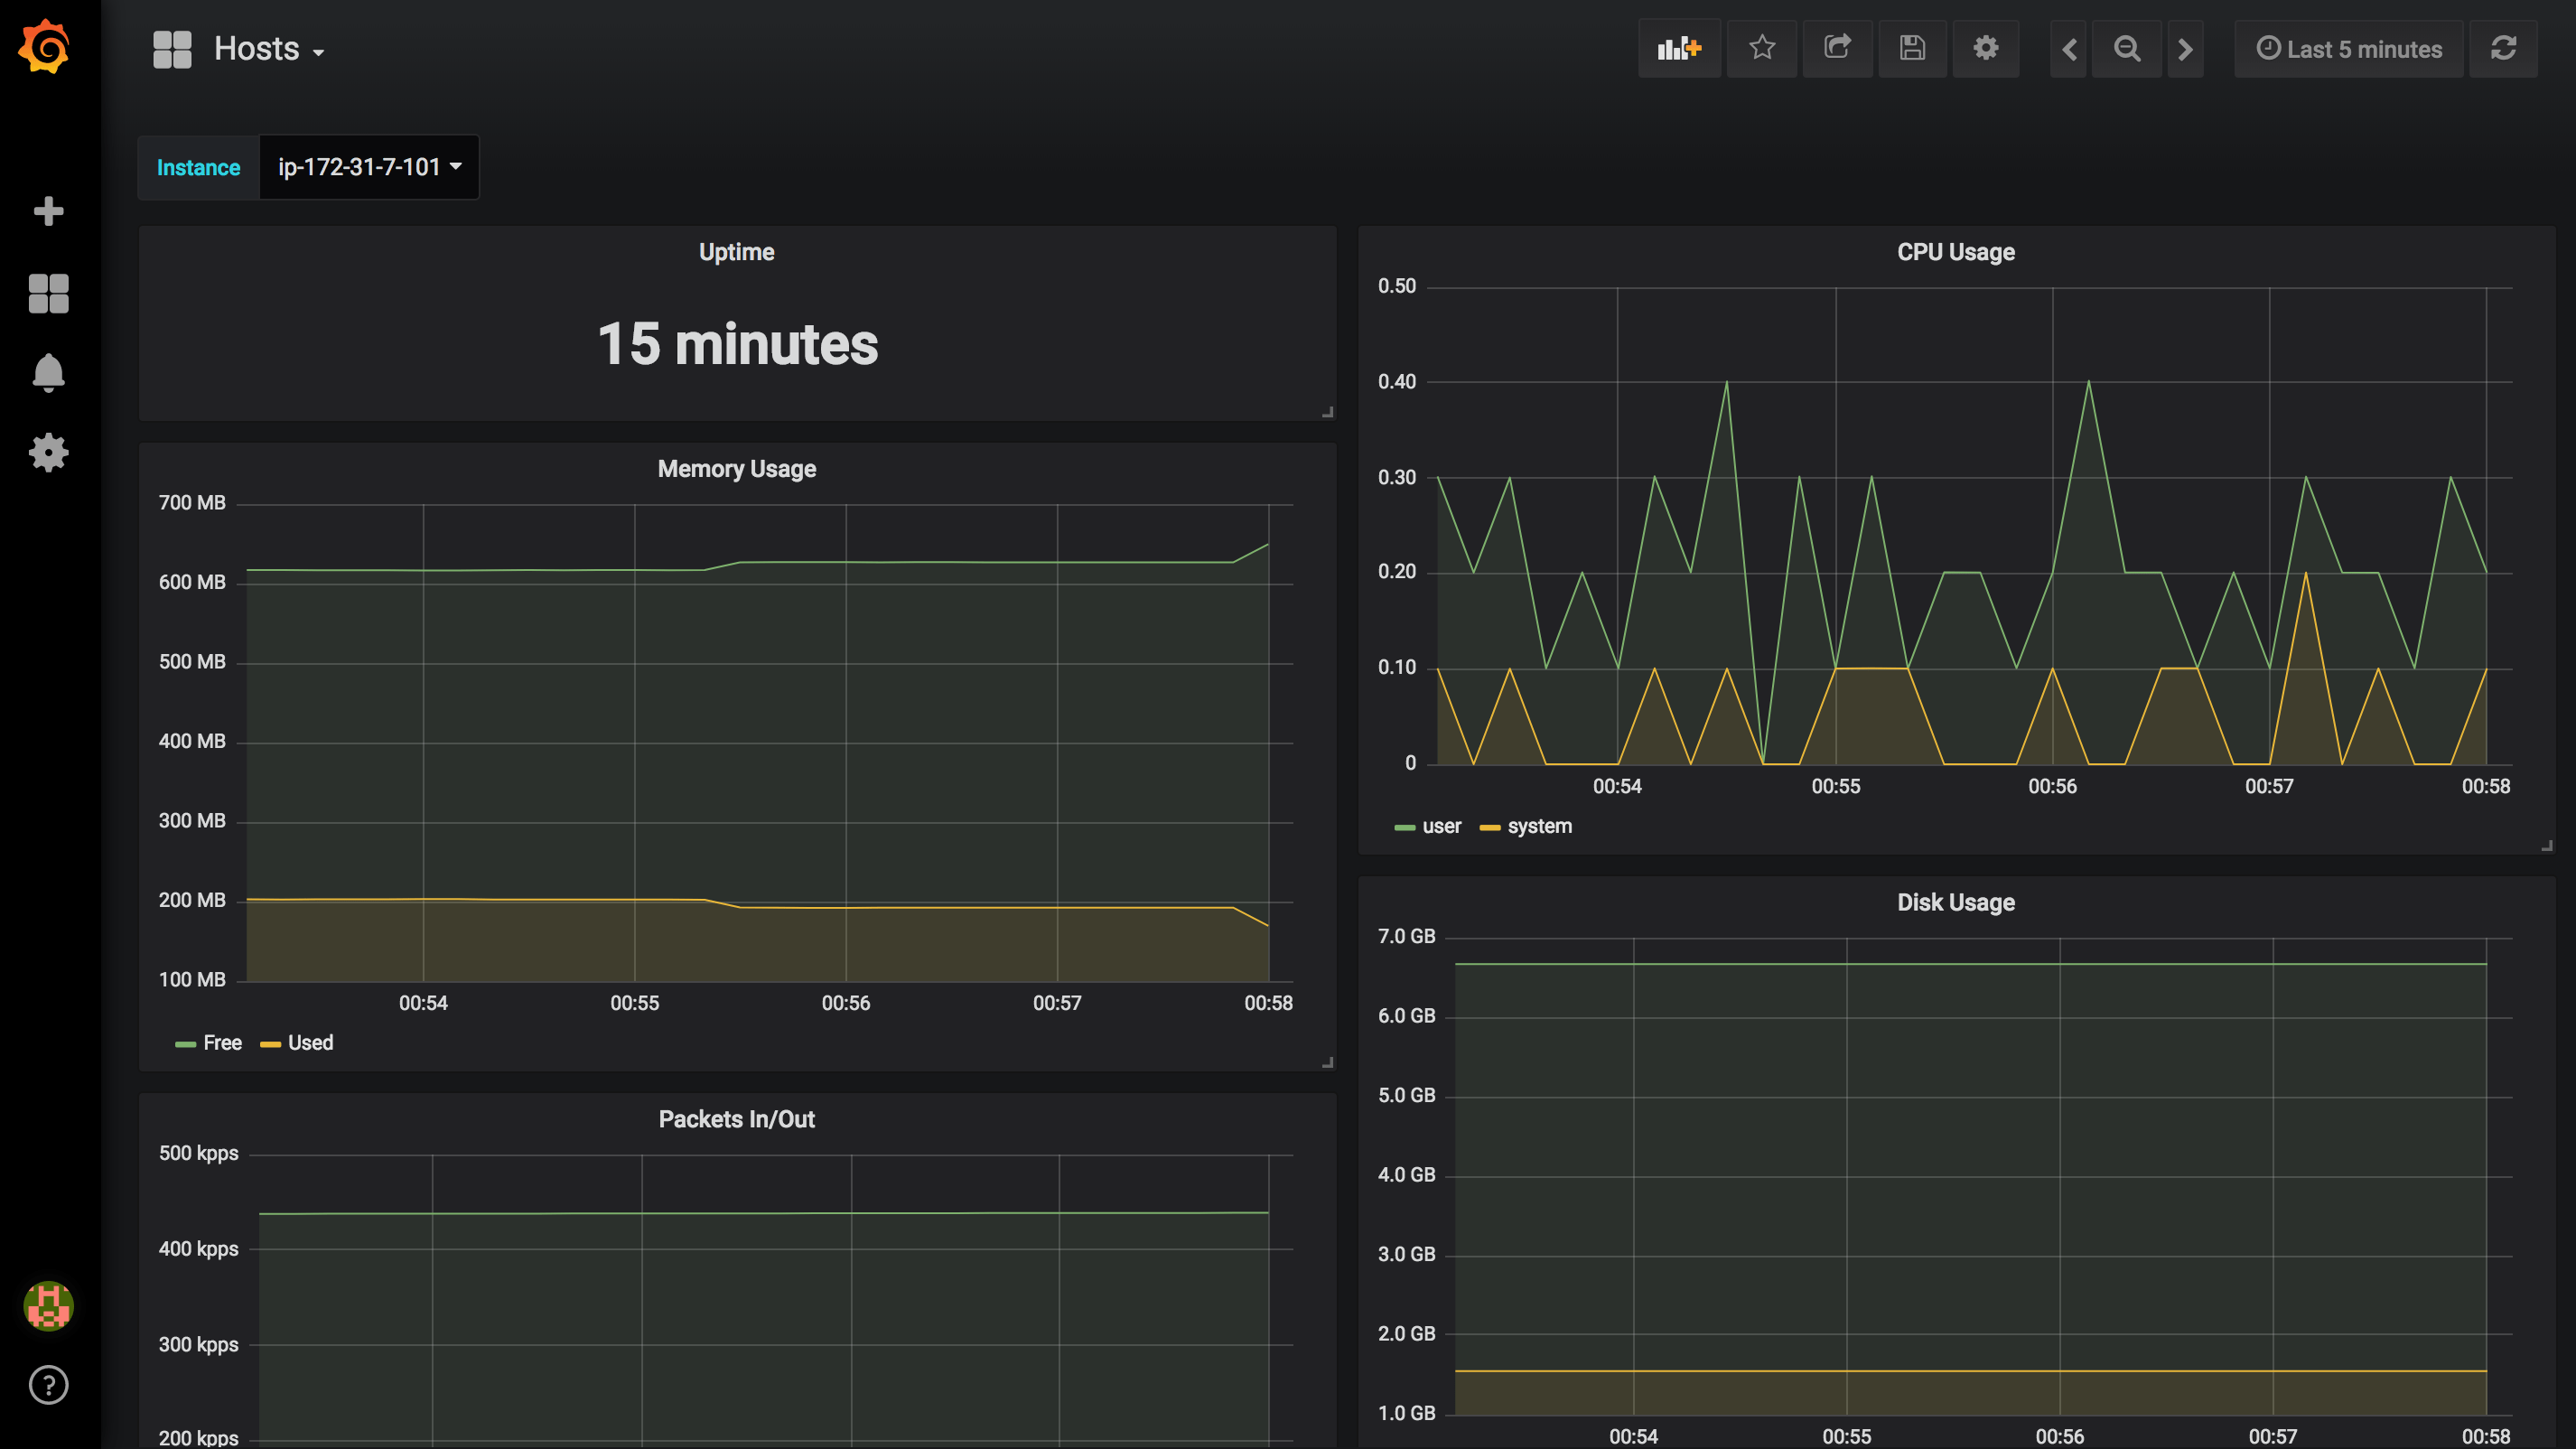
Once the application version is deployed to Elastic Beanstalk, metrics will be pushed to your timeseries database. In this example, I used InfluxDB as data storage and I created some dynamic Dashboards in Grafana to visualize metrics in real-time:
Containers:
Hosts:
Note: for in-depth explaination on how to configure Telegraf, InfluxDB & Grafana read my previous article.
Full code can be found on my GitHub. Make sure to drop your comments, feedback, or suggestions below — or connect with me directly on Twitter @mlabouardy