Serverless Computing or FaaS is the best way to consume cloud computing. In this model, the responsibility for provisioning, maintaining, and patching servers is shifted from the customer to cloud providers. Which allows developers to focus on building new features and innovating, and pay only for the compute time that they consume.
In the last 7 months, we started using Lambda based functions heavily in production. It allowed us to scale quickly and brought agility to our development activities.
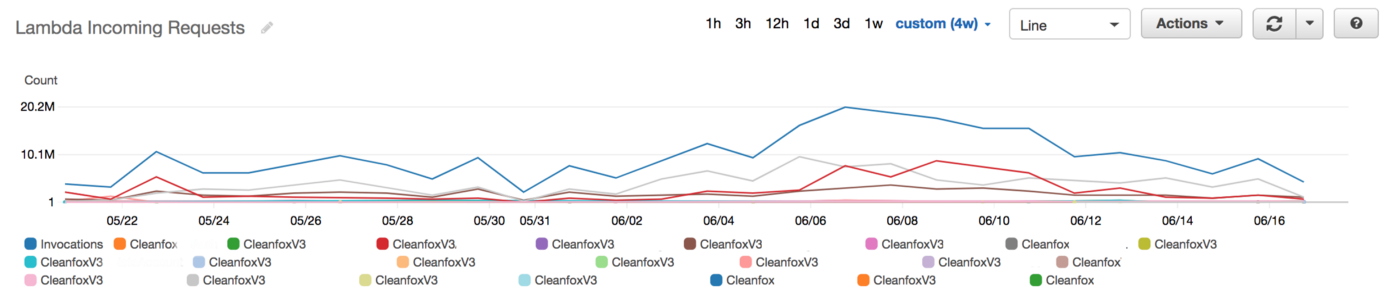
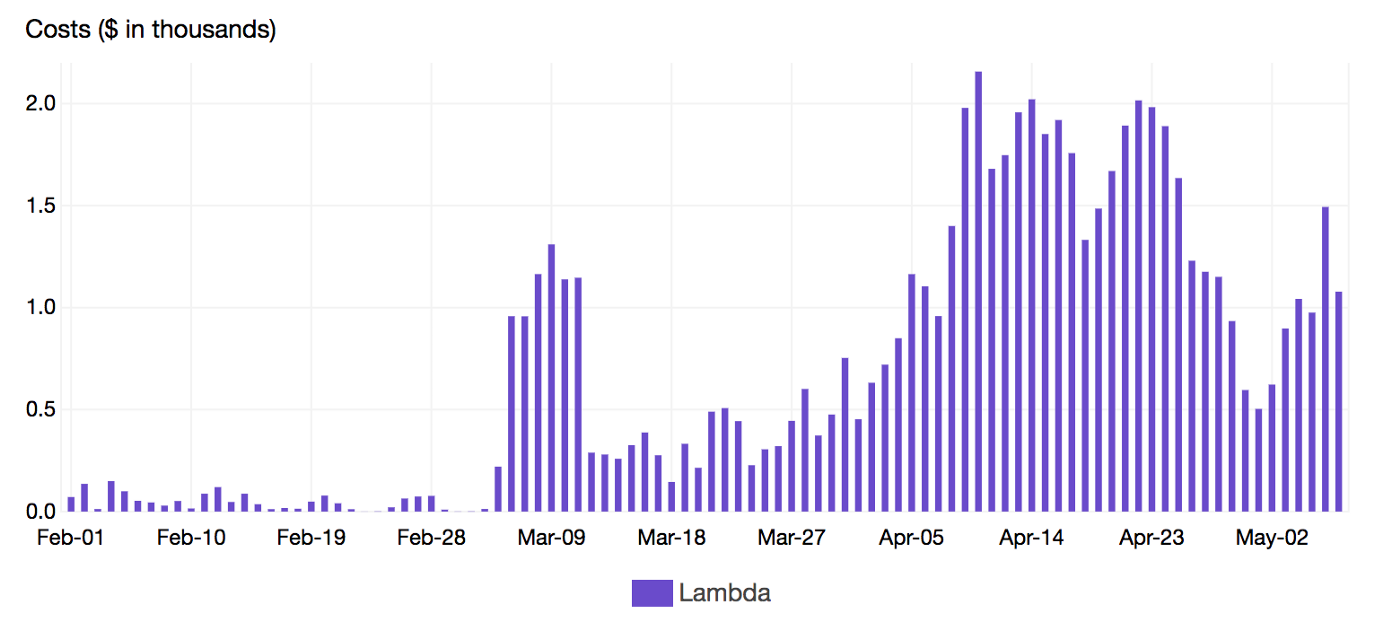
We were serving +80M Lambda invocations per day across multiple AWS regions with an unpleasant surprise in the form of a significant bill.
It was very easy and cheap to build a Lambda based applications that we forgot to estimate and optimize the Lambda costs earlier during development phase, so once we start running heavy workloads in production, the cost become significant and we spent thousands of dollars daily
To keep Lambda cost under control, understanding its behavior was critical. Lambda pricing model is based on the following factors:
Number of executions.
Duration, rounded to the nearest 100ms.
Memory allocated to the function.
Data transfer (out to the internet, inter-region and intra-region).
In order to reduce AWS Lambda costs, we monitored Lambda memory usage and execution time based on logs stored in CloudWatch.
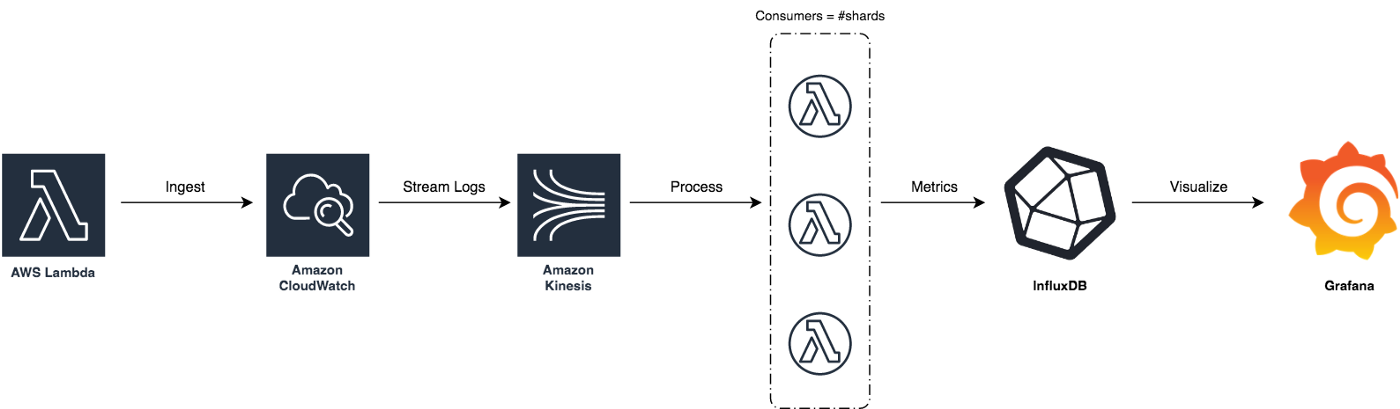
We’ve updated our previous centralized logging platform to extract relevant metrics (Duration, Billed Duration and Memory Size) from “REPORT” log entry reported through CloudWatch and store them into InfluxDB. You can check out the following link for a step-by-step guide on how to setup the following workflow:
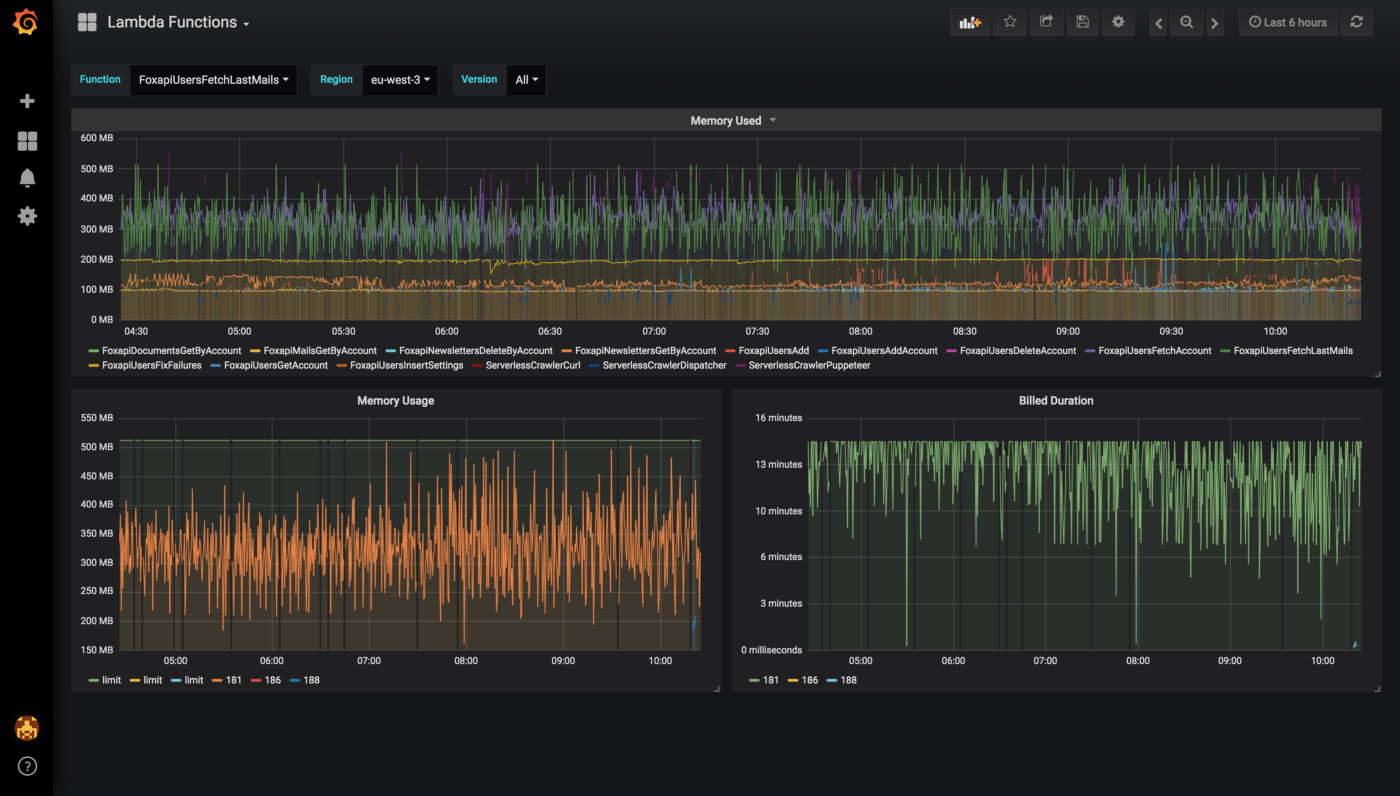
Next, we created dynamic visualizations on Grafana based on metrics available in the timeseries database and we were able to monitor in near real-time Lambda runtime usage. A graphical representation of the metrics for Lambda functions is shown below:
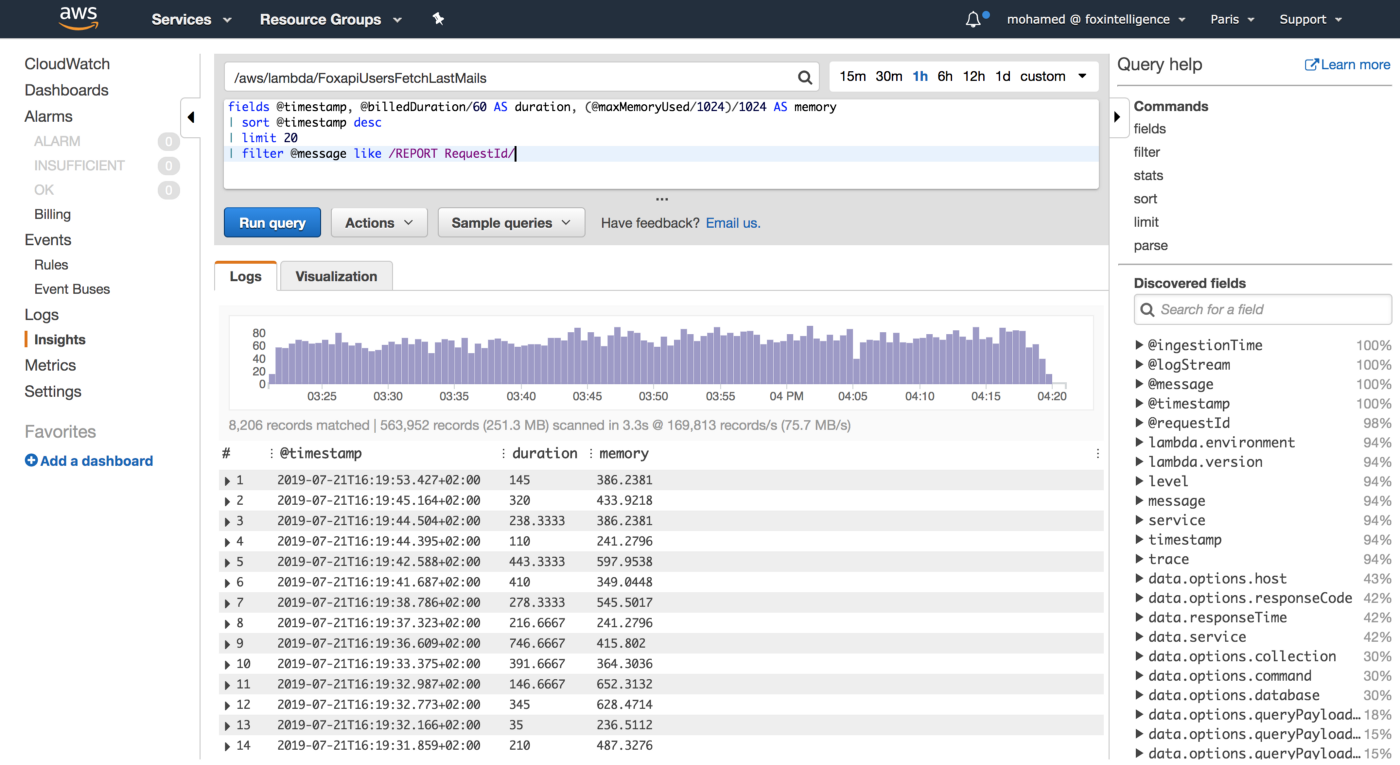
You can also use CloudWatch Logs Insights to issue ad-hoc queries to analyse statistics from recents invocations of your Lambda functions:
We leveraged these metrics to set Slack notifications when memory allocation is either too low (risk of failure) or too high (risk of over-paying) and to identify the billed duration, memory usage for the ten most expensive Lambda functions. When performing heuristic analysis of Lambda logs, we gain insights into the right sizing of each Lambda function deployed in our AWS account and we avoided excessive over-allocation of memory. Hence, significantly reduced the Lambda’s cost.
Memory allocation can make a big difference in your Lambda function cost. Too much allocated memory and you’ll overpay. Too little and your function will be at risk of failing. Therefore, you want to keep a healthy balance when it comes to memory allocation.
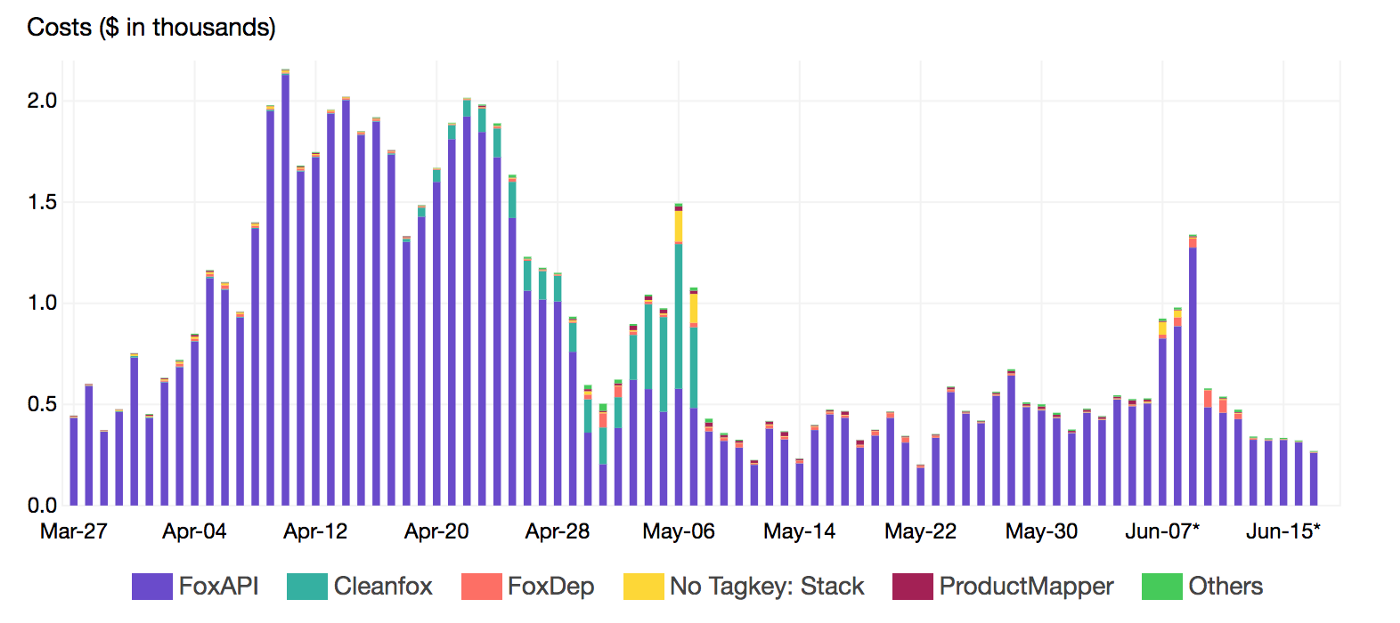
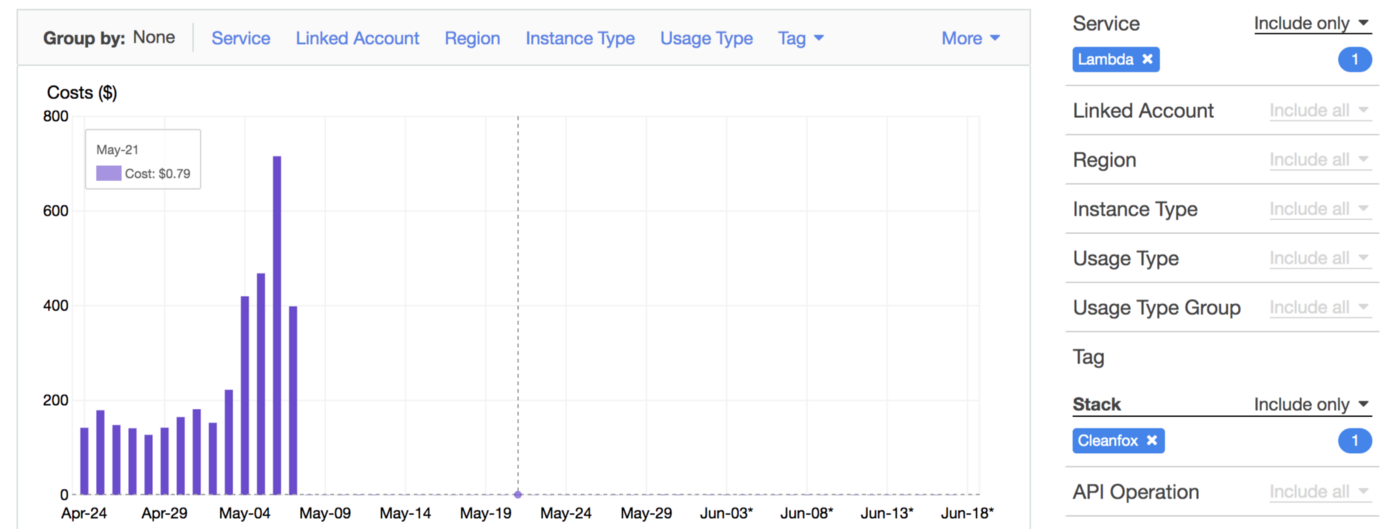
To gather more insights and uncover hidden costs, we had to identify the most expensive functions. Thats where Lambda Tags comes into the play. We leveraged those metadata to breakdown the cost per Stack (project):
By reducing the invocation frequency (control concurrency with SQS), we reduced the cost up to 99% and CO2 emissions footprint of our B2C app Cleanfox 🚀💰
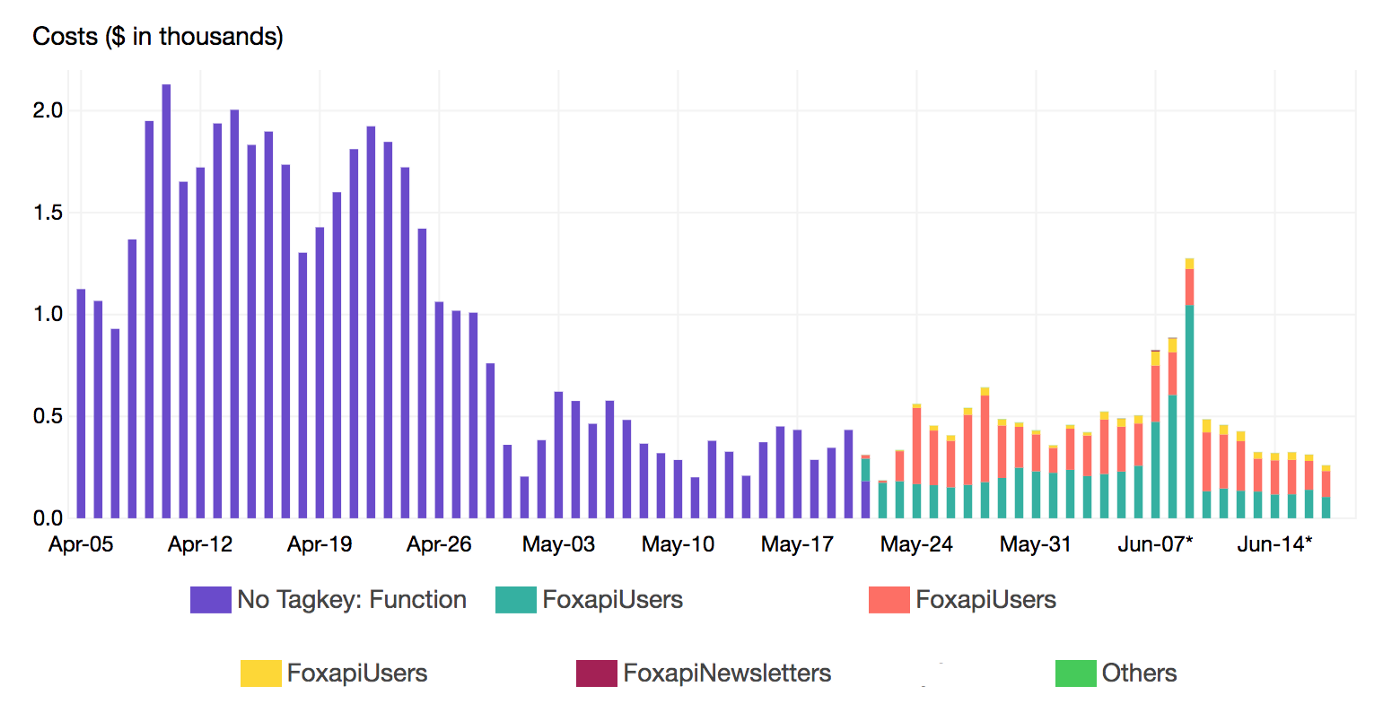
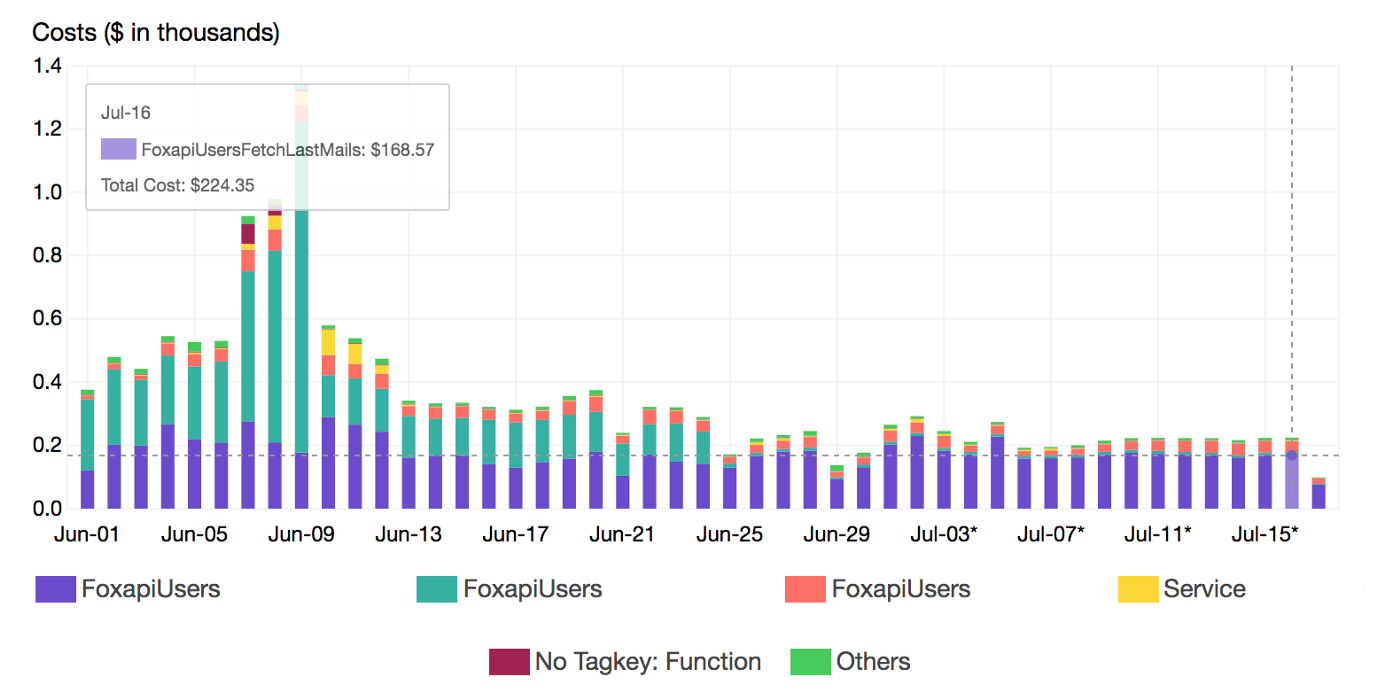
At a deeper level, we also breakdown the cost by Lambda function name using a secondary tag which is Function tag:
Once the target functions were identified, we reviewed the execution flow and applied some optimisation in our code to shorten the running time and resources needed (Memory and CPU)
By continuously monitoring increases in spend, we end up building scalable, secure and resilient Lambda based solutions while maintaining maximum cost-effectiveness. Also, we are now configuring Lambda runtime parameters appropriately at the sandbox stage and we’re evaluating alternative services like Spot Instances & Batch Jobs to run heavy non-critical workloads considering the hidden costs of Serverless.
Drop your comments, feedback, or suggestions below — or connect with me directly on Twitter @mlabouardy.
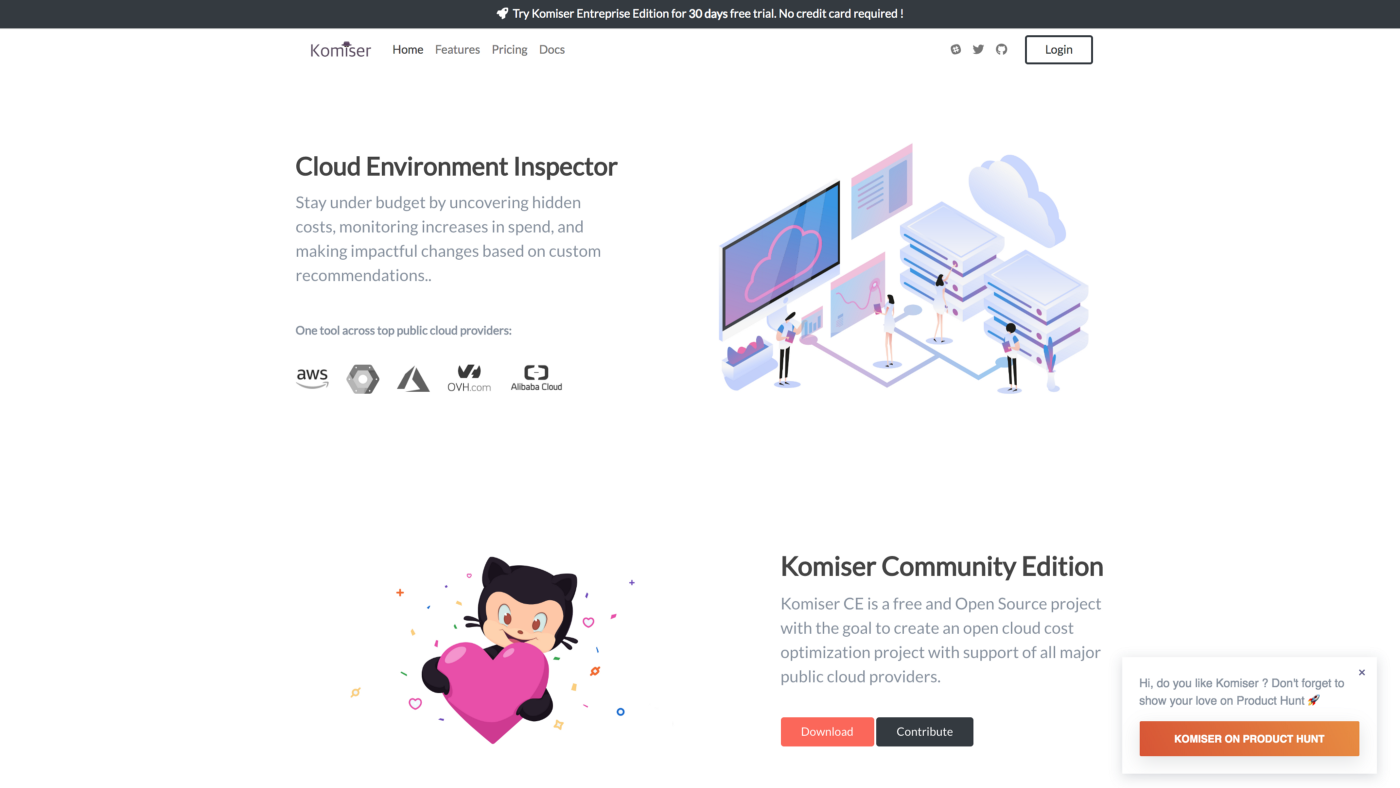
In just few months, Komiser, the Cloud Environment Inspector, has become a key player in cloud cost optimization ecosystem. With more than 2,200 stars on Github and 190,000 downloads, Komiser is widely used by major companies in their production environments.
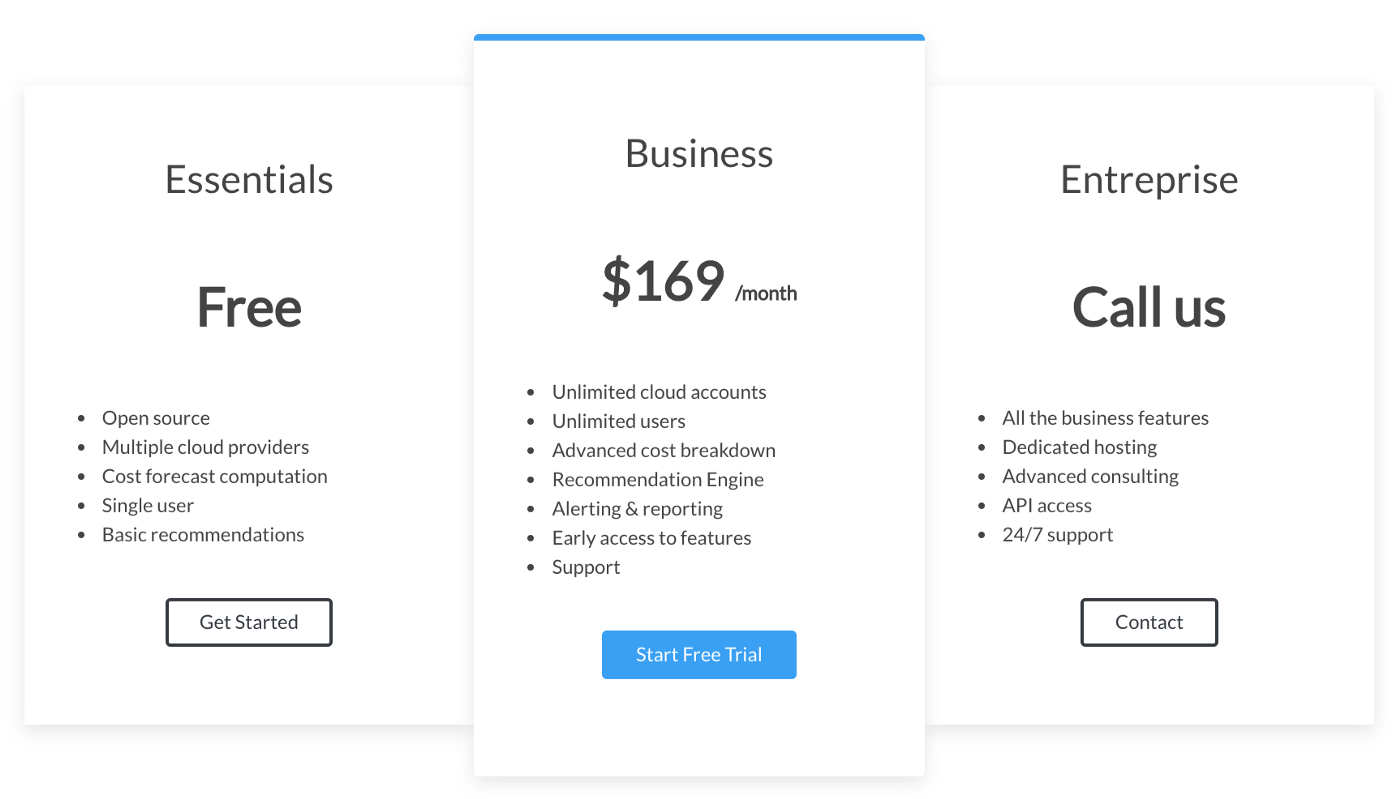
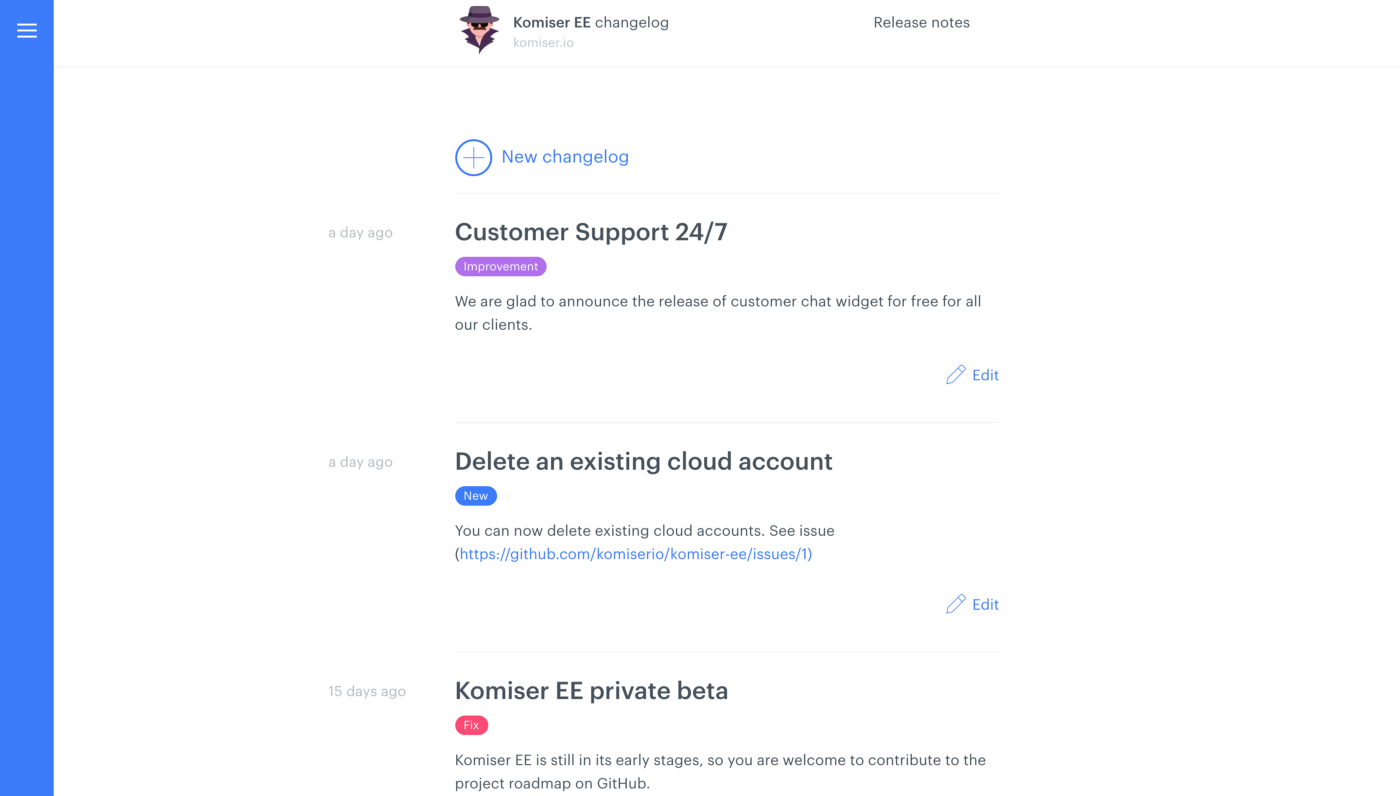
Today we’re announcing Komiser Enterprise Edition (EE), our new commercial product, has reached public beta. Komiser EE allows you to identify potential cost savings on all major public cloud providers (AWS, GCP, OVH, Azure and DigitalOcean). Komiser EE is available in three tiers: Essentials, Business and Entreprise tiers :
For consistency, we are also renaming the open source Komiser products to Komiser Community Edition (CE).
Highlights
New Landing Page
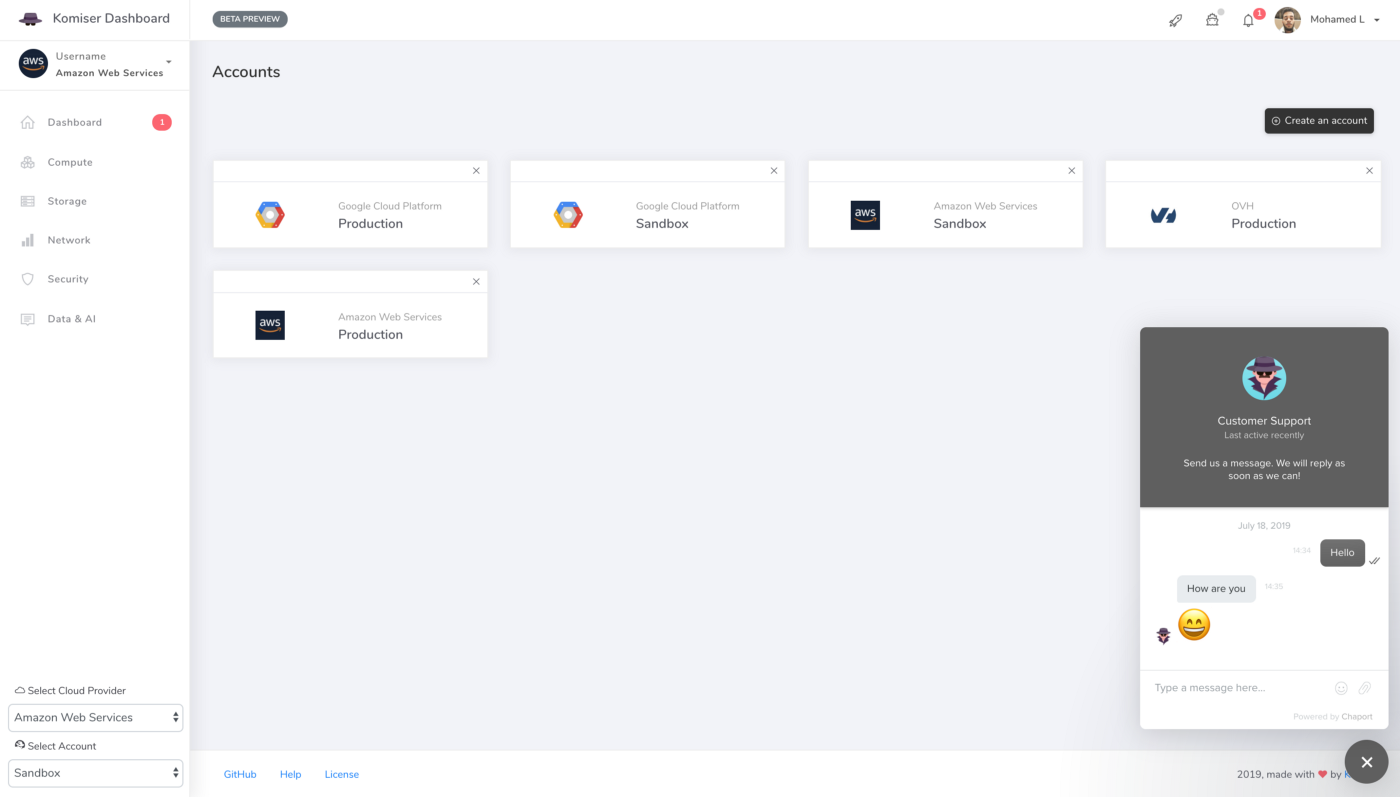
Multiple Cloud Accounts Support
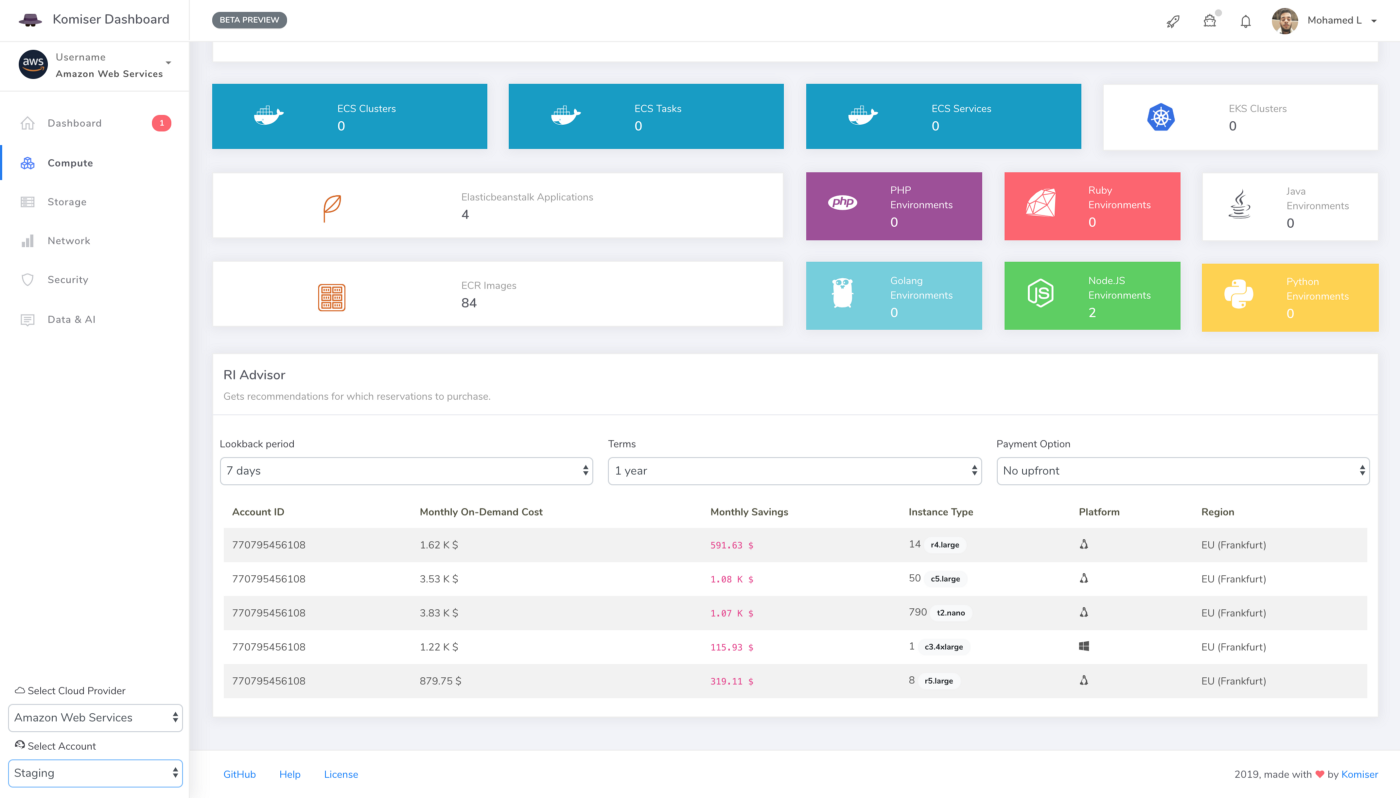
Reserved Instances Advisor
Early access to features
Early Access
Komiser EE is available in early access starting today. The registration process is as simple and automated as possible, so don’t fear endless registration forms nor crowded waiting queues before trying it out. Visit our website at https://cloud.komiser.io and get started in less than a minute!
Komiser Stays Open
Komiser EE is built on top of Komiser CE, that means that Komiser continues to evolve and will stay open source. Nothing changes! We are firm believers in open source, and Komiser will continue to be our main priority and a community-driven project.
Over the last decade, the cost of Amazon Web Services (AWS) has become a primary concern of businesses. That’s no surprise: AWS has many services that offer a range of IT resources — from IT infrastructure and bandwidth to analytics tools and machine learning — and each affects the total cloud bill.
While AWS offers many fully-managed services like CloudWatch, CloudTrail, Trusted Advisor, etc to help you detect potential cost savings. Understanding and managing cloud costs isn’t simple with AWS.
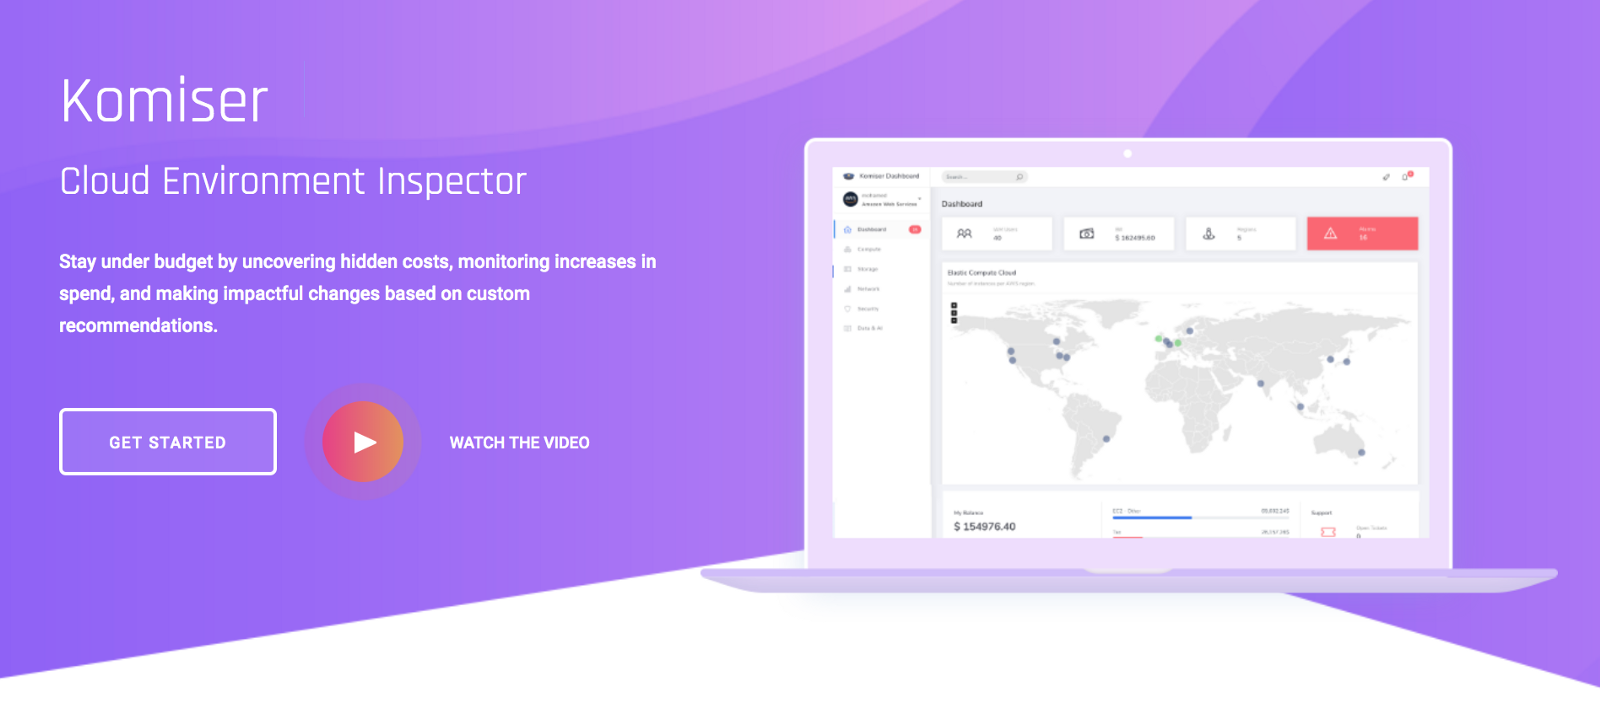
That’s why, I came up one year ago, with an open source tool called Komiser to help reduce your AWS infrastructure cost based on custom recommendations.
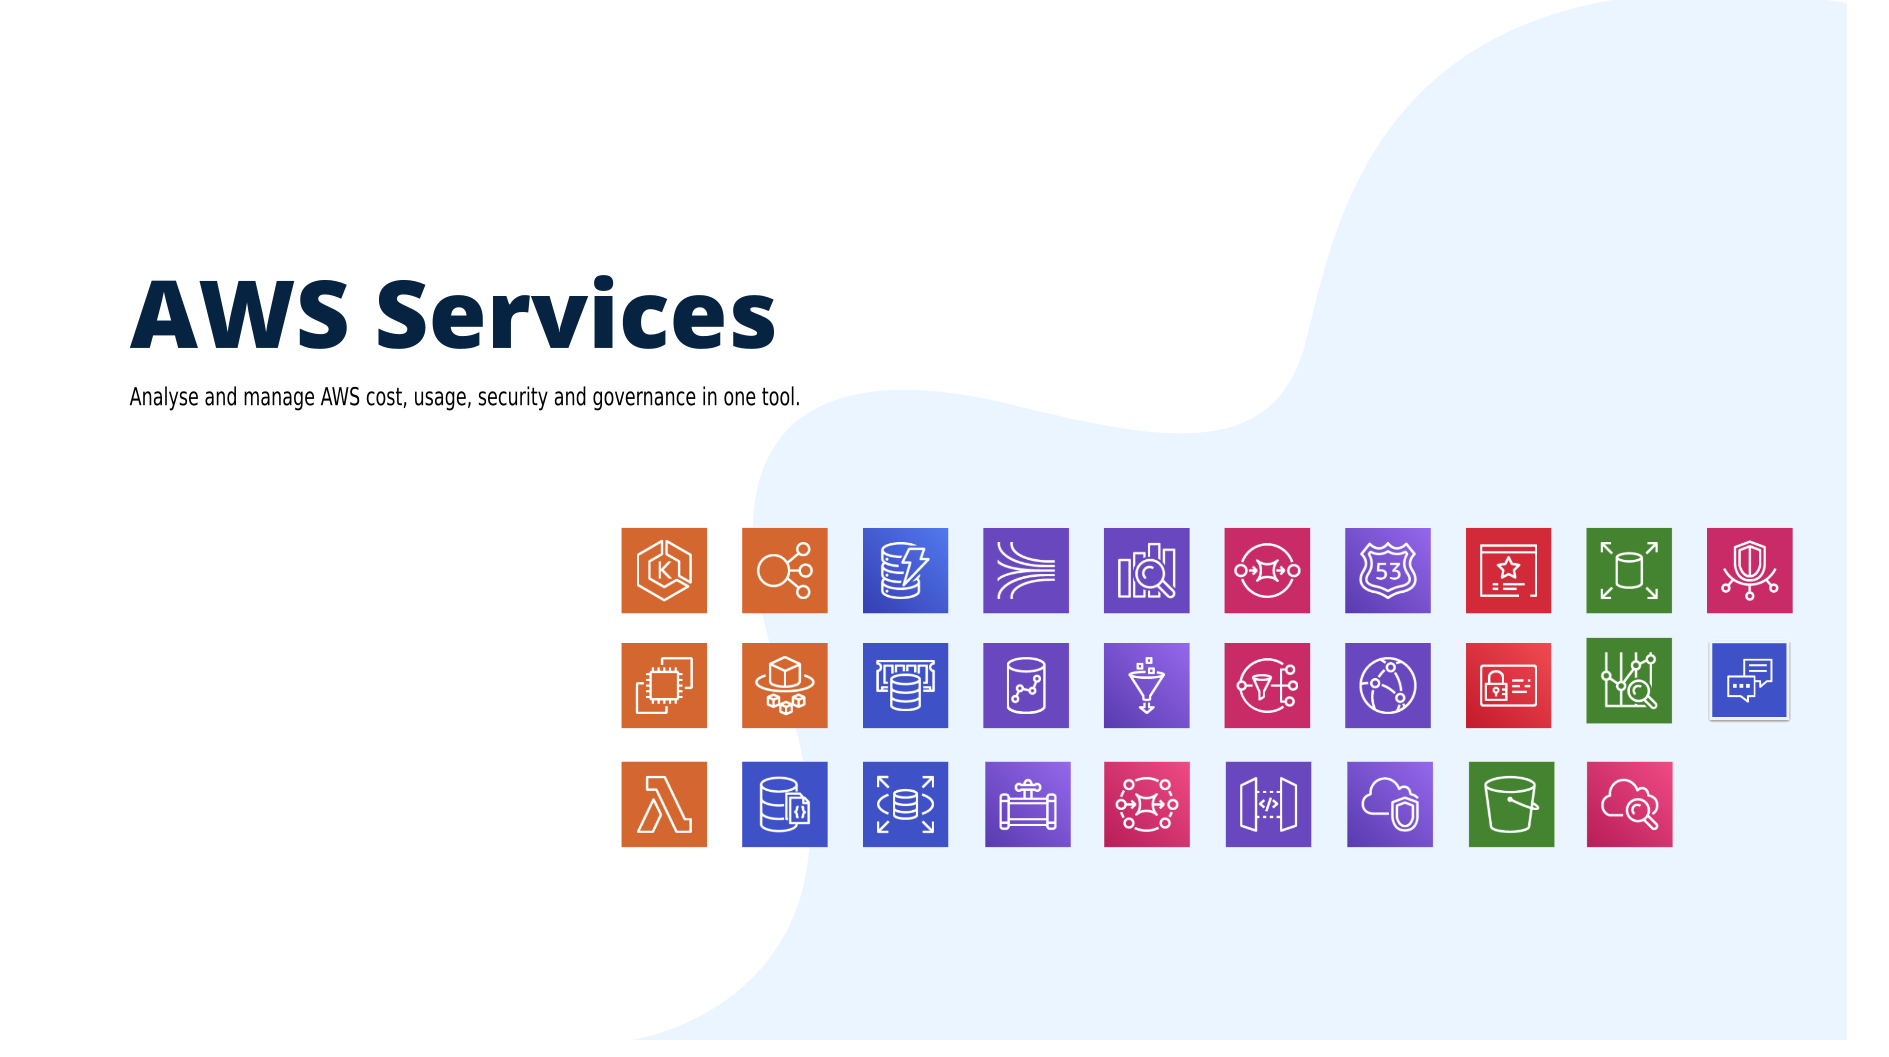
After 1 year of intense development, I’m thrilled to announce the fresh new release of Komiser: 2.0.0 with support of new AWS services:
Highlights
With the GDPR becoming real in EU, logging and storage of (potentially) personally identifiable information now need to be reduced in many organizations. Komiser allows you to analyze and manage cloud cost, usage, security, and governance in one place. Hence, detecting potential vulnerabilities that could put your cloud environment at risk.
It allows you also to control your usage and create visibility across all used services to achieve maximum cost-effectiveness and get a deep understanding of how you spend on the AWS, GCP and Azure.
Usage
Below are the available downloads for the latest version of Komiser (2.0.0). Please download the proper package for your operating system and architecture.
Linux:
1
wget https://cli.komiser.io/2.0.0/linux/komiser
Windows:
1
wget https://cli.komiser.io/2.0.0/windows/komiser
Mac OS X:
1
wget https://cli.komiser.io/2.0.0/osx/komiser
Note: make sure to add the execution permission to Komiser chmod +x komiser and update the user’s $PATH variable.
Komiser is also available as a Docker image:
Docker:
1
docker run -d -p 3000:3000 --name komiser mlabouardy/komiser:2.0.0
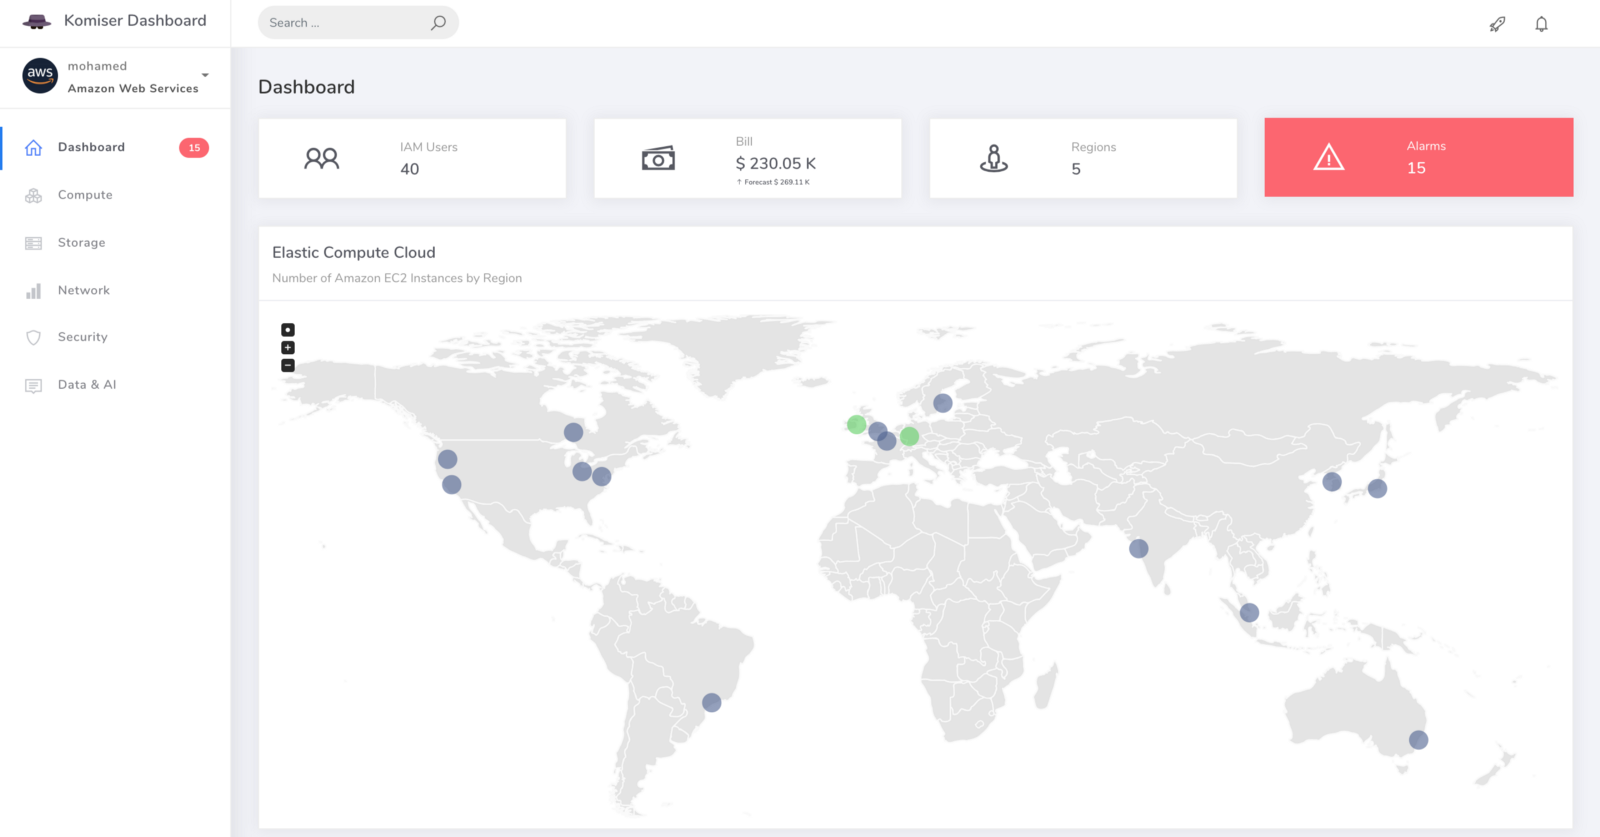
If you point your favorite browser to http://localhost:3000, you should see Komiser awesome dashboard:
Komiser is written in Golang and is MIT licensed — contributions are welcomed whether that means providing feedback or testing existing and new features.
Drop your comments, feedback, or suggestions below — or connect with me directly on Twitter @mlabouardy.
In analytics, where queries over hundreds of gigabytes are the norm, performance is paramount and has a direct effect on the productivity of your team: running a query for hours means days of iterations between business questions. At Foxintelligence, we needed to move from traditional relational databases, like Postgres and MySQL to columnar database solutions. While RDBS like MySQL is great for normal transactional operations, it has significant drawbacks when it comes to real-time analytics on large amount of data. We found Google BigQuery to deliver superior results significantly for usability, performance, and cost for almost all our analytical use-cases, especially at scale.
Both Amazon RedShift and Google BigQuery provide much of the same functionalities, there are some fundamental differences between how these two operate. So you need to pick the right solution based on your data and business.
Once we decided which data warehouse we will use, we had to replicate data from RDS MySQL to Google BigQuery. This post walks you through the process of creating a data pipeline to achieve the replication between the two systems.
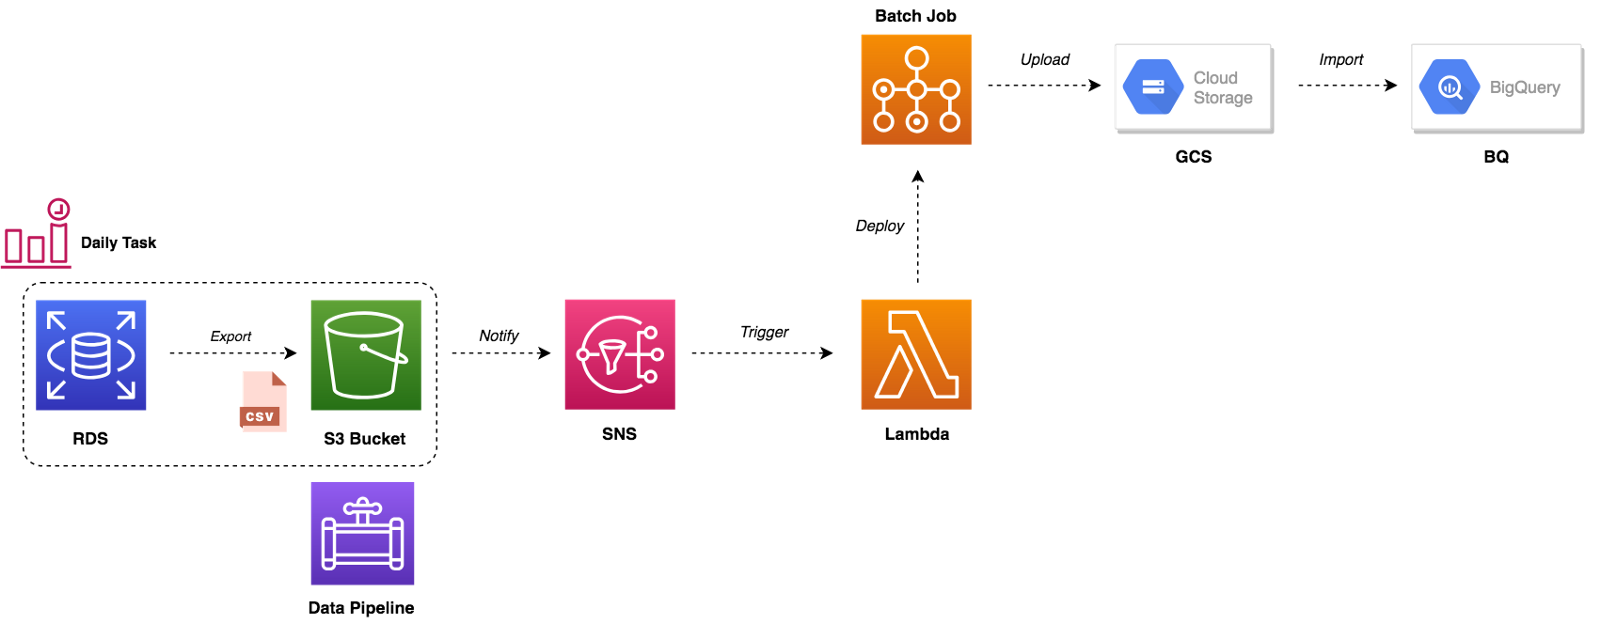
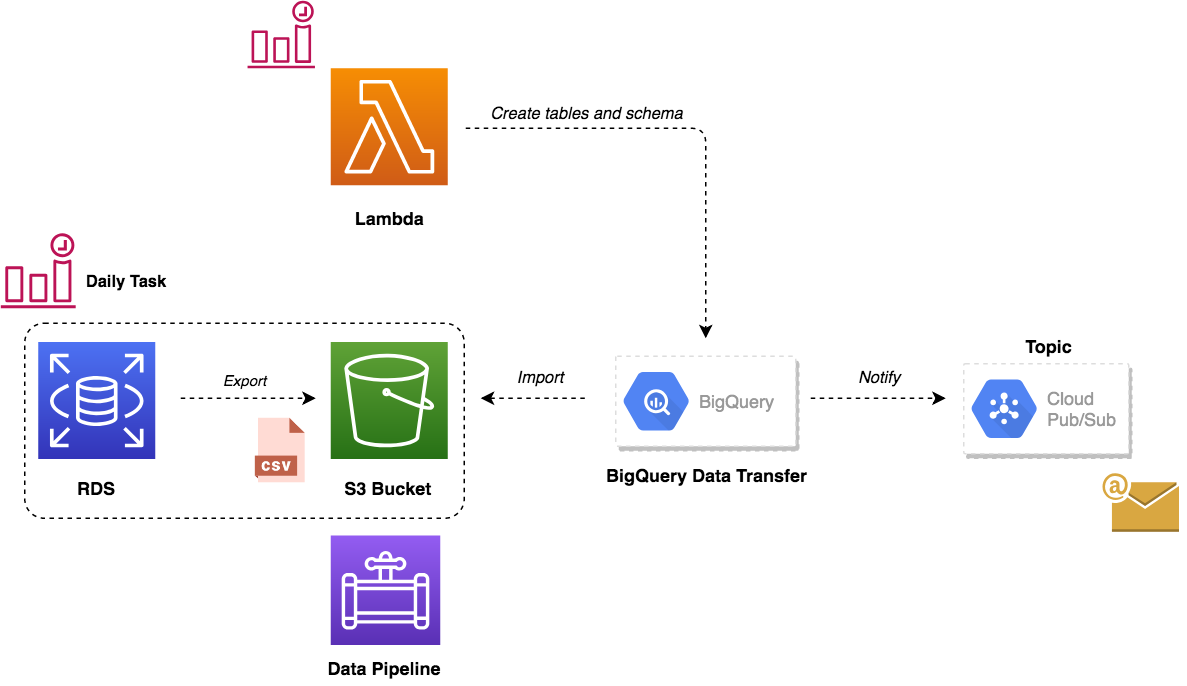
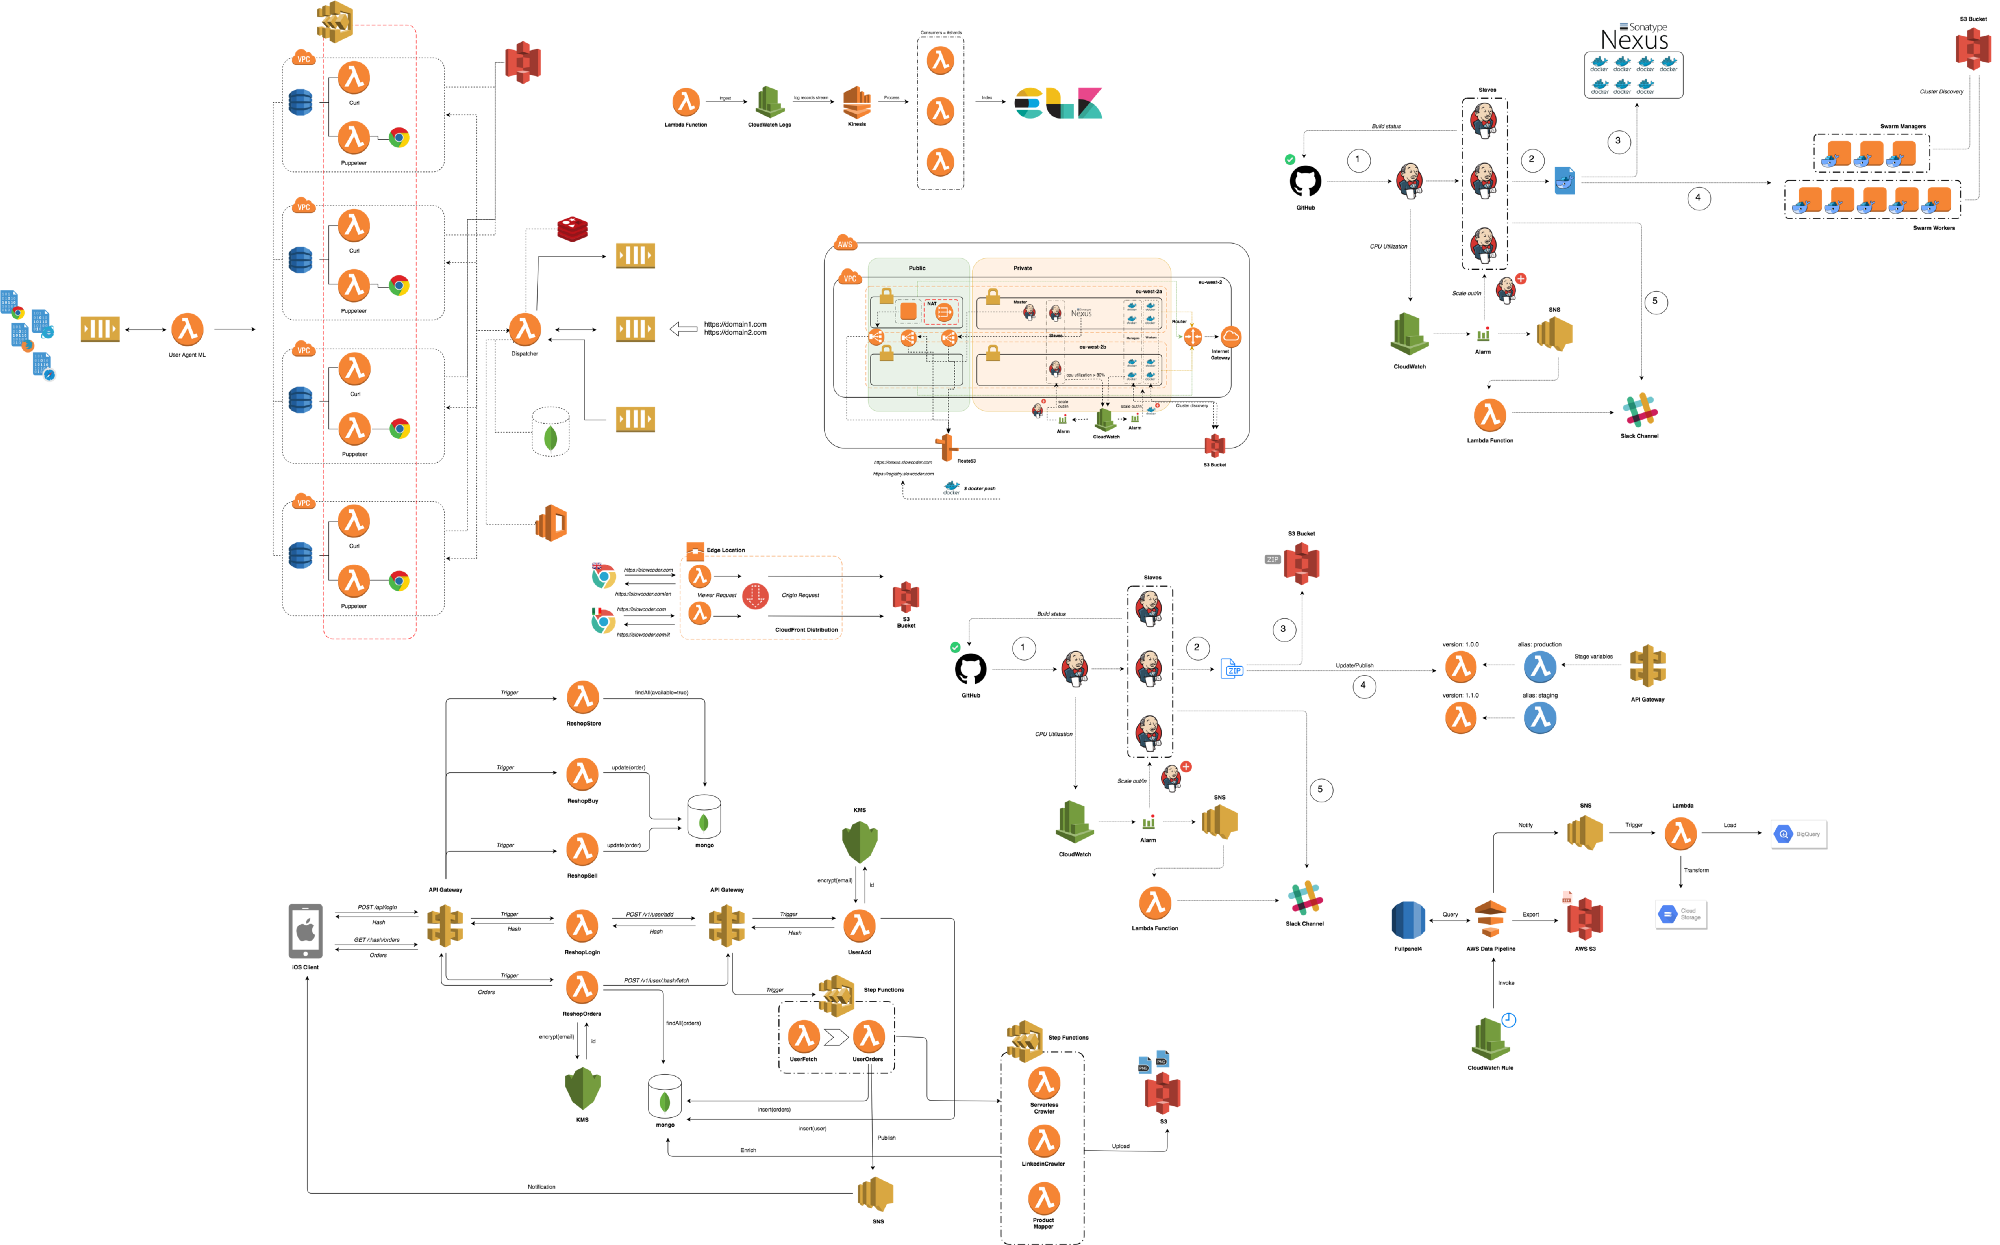
We used AWS Data Pipeline to export data from MySQL and feed it to BigQuery. The figure below summarises the entire workflow:
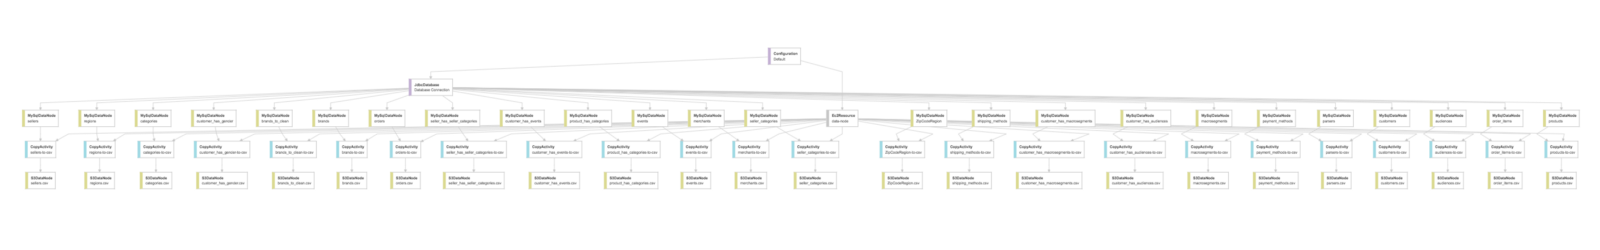
The pipeline starts based on a defined schedule and period, it launches a spot instance that will copy data from MySQL database to CSV files (split by table name) to an Amazon S3 bucket and then sending an Amazon SNS notification after the copy activity completes successfully. Following is our pipeline that accomplishes that:
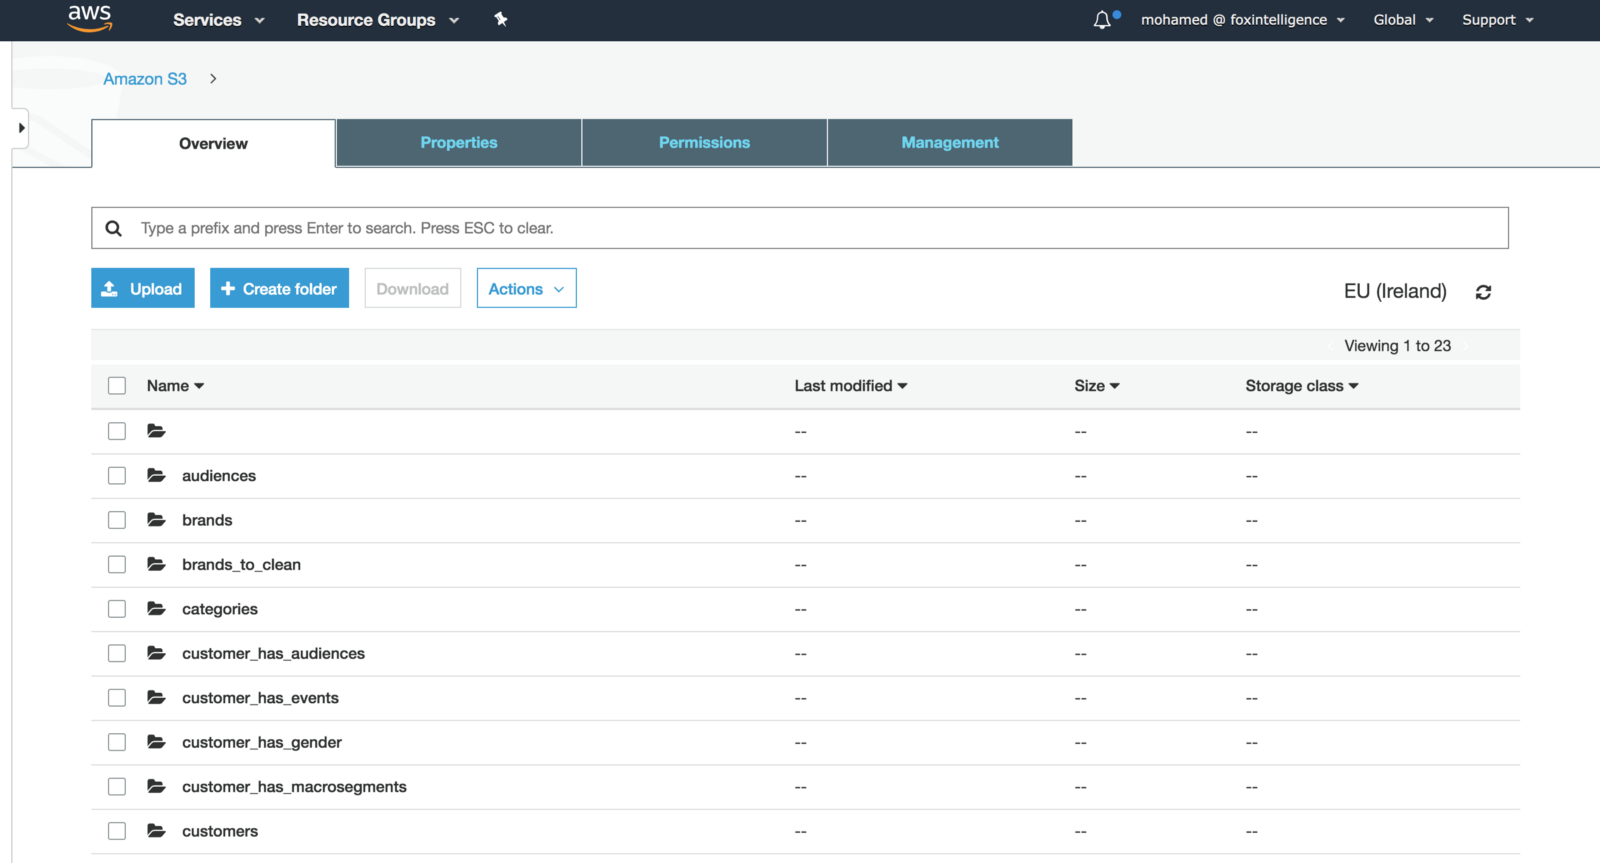
Once the pipeline is finished, CSV files will be generated in the output S3 bucket:
The SNS notification will trigger a Lambda function, it will deploy a batch job based on a Docker image stored on our private Docker registry. The container will upload CSV files from S3 to GCS and load data to BigQuery:
You can use Storage Transfer Service to easily migrate your data from Amazon S3 to Cloud Storage.
for raw in $(aws s3 ls s3://$S3_BUCKET/ | awk -F " " '{print $2}'); do table=${raw%/} if [[ $table != "" && $table != df* ]] then echo "Table: $table" csv=$(aws s3 ls s3://$S3_BUCKET/$table/ | awk -F " " '{print $4}' | grep ^ | sort -r | head -n1)
echo $table >> tables
echo "CSV: $csv"
echo "Copy csv from S3" aws s3 cp s3://$S3_BUCKET/$table/$csv csv/$table.csv
echo "Upload csv to GCP" gsutil cp csv/$table.csv gs://$GS_BUCKET/$table.csv fi done
echo "Import CSV to BigQuery"
python app.py
We have written a Python script to clean up raw data (encoding issues), transform (map MySQL data types to BQ data types) and load CSV file to BigQuery:
import mysql.connector import os import time from mysql.connector import Error from google.cloud import bigquery
bigquery_client = bigquery.Client()
defmapToBigQueryDataType(columnType): if columnType.startswith('int'): return'INT64' if columnType.startswith('varchar'): return'STRING' if columnType.startswith('decimal'): return'FLOAT64' if columnType.startswith('datetime'): return'DATETIME' if columnType.startswith('text'): return'STRING' if columnType.startswith('date'): return'DATE' if columnType.startswith('time'): return'TIME'
defwait_for_job(job): whileTrue: job.reload() if job.state == 'DONE': if job.error_result: raise RuntimeError(job.errors) return time.sleep(1)
try: conn = mysql.connector.connect(host=os.environ['MYSQL_HOST'], database=os.environ['MYSQL_DB'], user=os.environ['MYSQL_USER'], password=os.environ['MYSQL_PWD']) if conn.is_connected(): print('Connected to MySQL database')
lines = open('tables').read().split("\n") for tableName in lines: print('Table:',tableName) cursor = conn.cursor() cursor.execute('SHOW FIELDS FROM '+os.environ['MYSQL_DB']+'.'+tableName) rows = cursor.fetchall()
schema = [] for row in rows: schema.append(bigquery.SchemaField(row[0].replace('\'', ''), mapToBigQueryDataType(row[1])))
print('Loaded {} rows into {}:{}.'.format( job.output_rows, os.environ['BQ_DATASET'], tableName)) except Error as e: print(e) finally: conn.close()
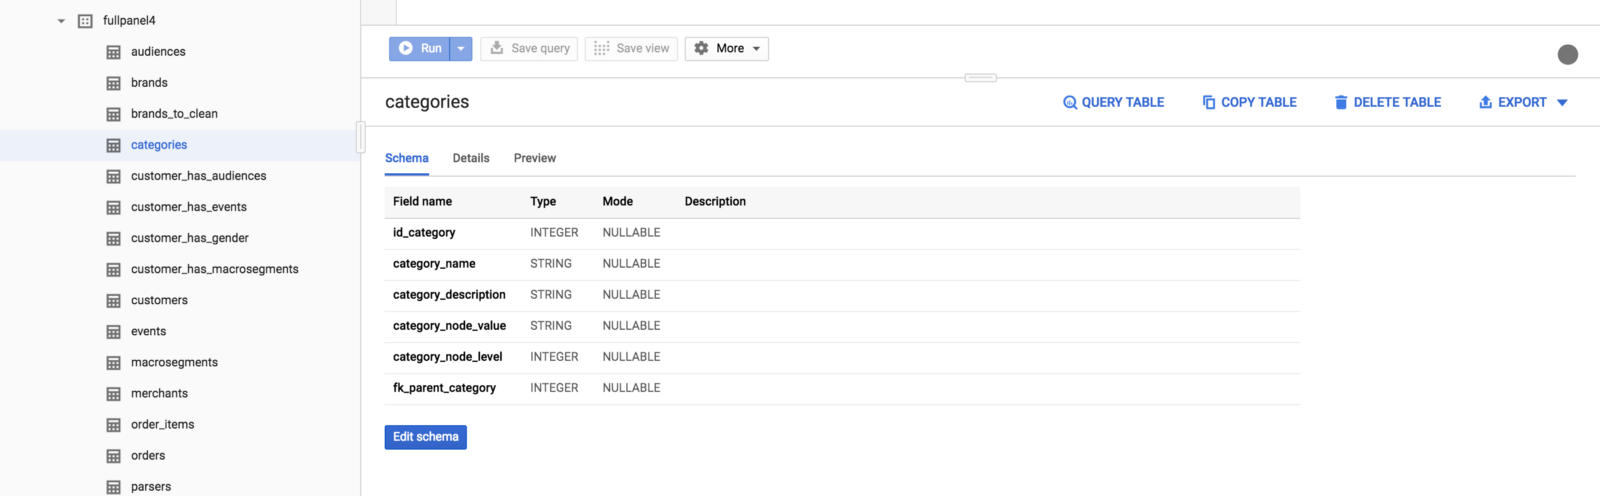
As a result, the tables will be imported to BigQuery:
While this solution worked like a charm, we didn’t stop there. Google Cloud announced the public beta release of BigQuery Data Transfer. This service allows you to automates data movement from multiple data sources like S3 or GCS to BigQuery on a scheduled, managed basis. So it was a great use case to test this service to manage recurring load jobs from Amazon S3 into BigQuery as shown in the figure below:
This services comes with some trade-offs such as Google BigQuery cannot create tables as part of data transfer process. Hence, a Lambda function was used to drop the old dataset, and create the destination tables and their schema in advance of running the transfer. The function handler code is self-explanatory:
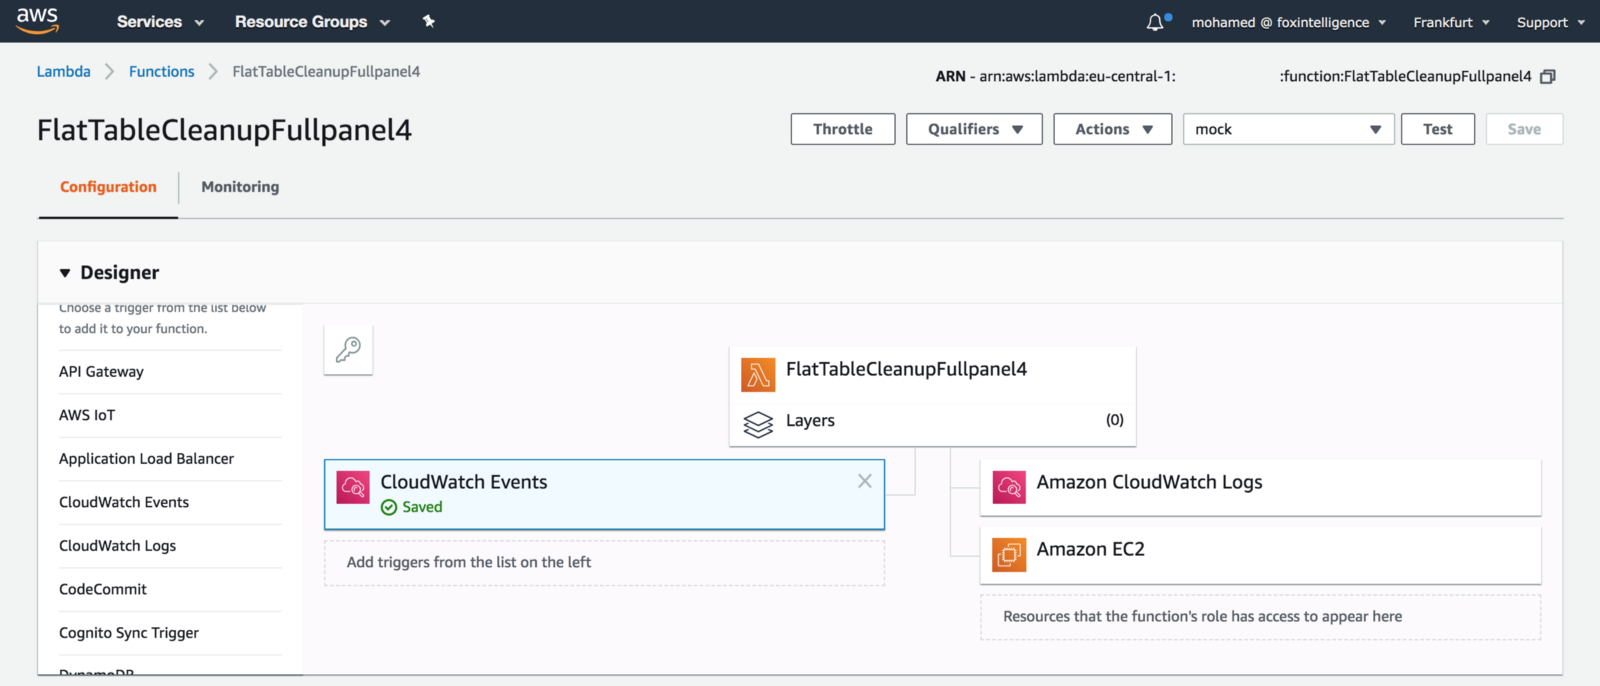
The function will be triggered by a CloudWatch Event, once the data pipeline finishes exporting CSV files:
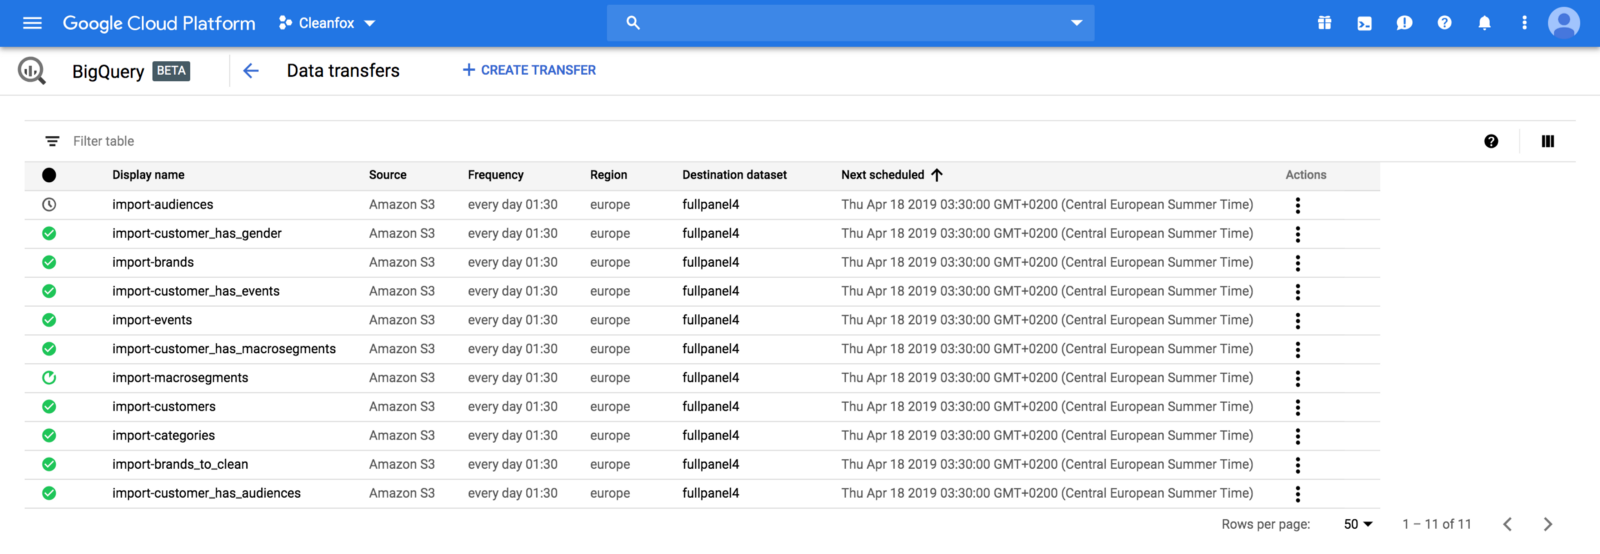
Finally, we created Transfer jobs for each table on BigQuery to load data from S3 bucket to BigQuery table:
Using Google BigQuery to store internally hundreds of gigabytes of data (soon terabytes) with the capability to analyse it in few seconds give us a massive push toward business intelligence and data-driven insights.
Like what you’re reading? Check out my book and learn how to build, secure, deploy and manage production-ready Serverless applications in Golang with AWS Lambda.
Drop your comments, feedback, or suggestions below — or connect with me directly on Twitter @mlabouardy.
Mobile apps have taken center stage at Foxintelligence. After implementing CI/CD workflows for Dockerized Microservices, Serverless Functions and Machine Learning models, we needed to automate the release process of our mobile application — Cleanfox — to deliver features we are working on continuously and ensure high quality app. While the CI/CD concepts remains the same, its practicalities are somewhat different. In this post, I will walk you through how we achieved that, including the lessons learned and formed along the way to boost your Android and iOS application development drastically.
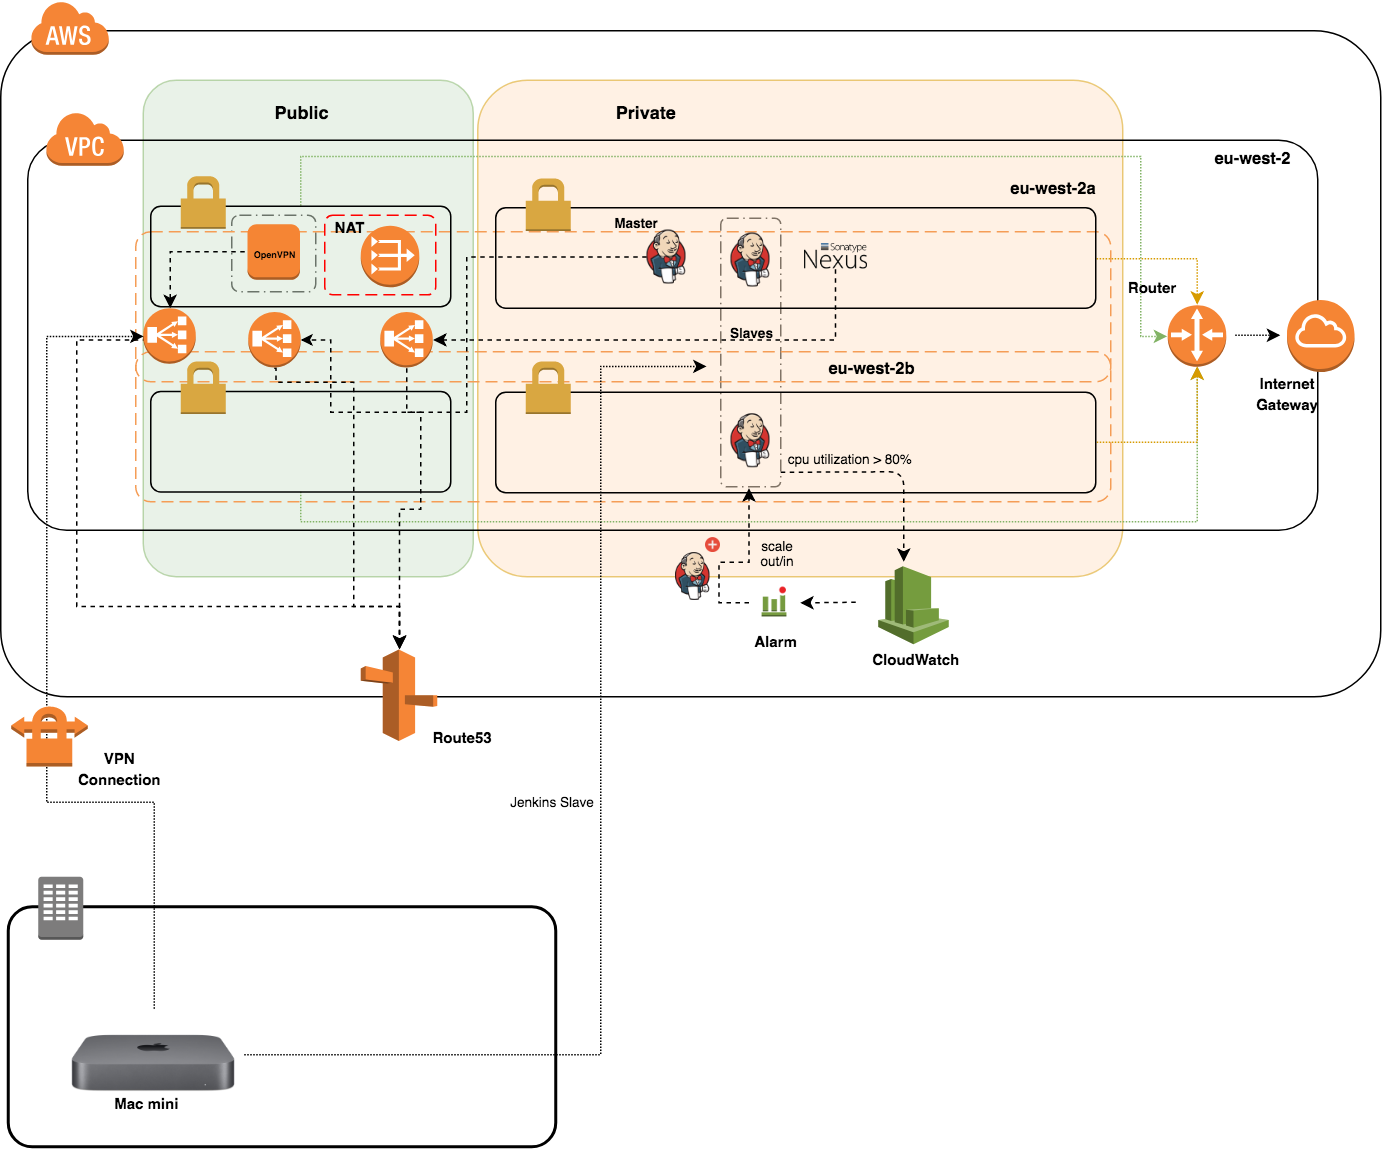
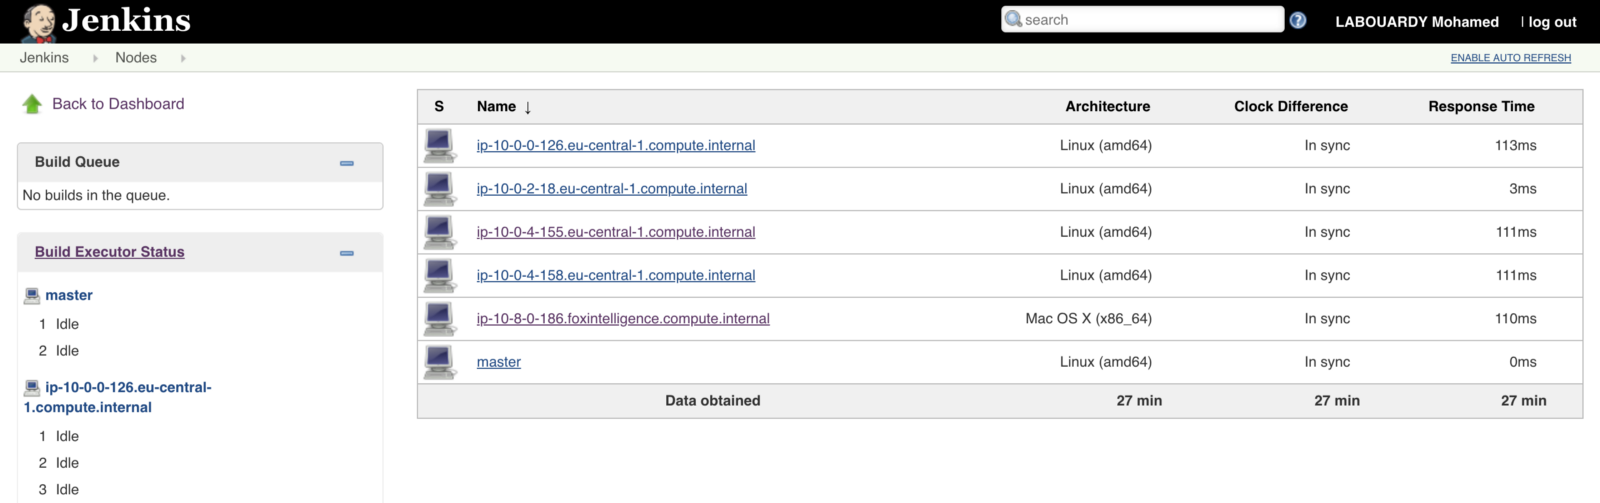
The Jenkins cluster (figure below) consists of a dedicated Jenkins master with a couple of slave nodes inside an autoscaling group. However, iOS apps can be built only on macOS machine. We typically use an unused Mac Mini computer located in the office devoted to these tasks.
We have configured the Mac mini to establish a VPN connection (at system startup) to the OpenVPN server deployed on the target VPC.
We setup an SSH tunnel to the Mac node using dynamic port forwarding. Once the tunnel is active, you can add the machine to Jenkins set of worker nodes:
This guide assumes you have a fresh install of the latest stable version of Xcode along with Fastlane.
Once we had a good part of this done, we used Fastlane to automate the deployment process. This tool offers a set of scripts written in Ruby to handle tedious tasks such as code signing, managing certificates and releasing ipa to the app store for the end users.
lane :increment_builddo version = get_version_number latestBuildNumber = latest_testflight_build_number(version: version) increment_build_number( build_number: latestBuildNumber + 1, xcodeproj:"Cleanfox.xcodeproj" ) end
lane :developdo increment_build build_app(scheme:"Sandbox", workspace:"Cleanfox.xcworkspace", include_bitcode:true) end
lane :betado increment_build build_app(scheme:"Staging", workspace:"Cleanfox.xcworkspace", include_bitcode:true) upload_to_testflight end
lane :prod_testflightdo increment_build_number( build_number: latest_testflight_build_number + 1, xcodeproj:"Cleanfox.xcodeproj" ) build_app(scheme:"Production", workspace:"Cleanfox.xcworkspace", include_bitcode:true) upload_to_testflight(skip_waiting_for_build_processing:true) end end
Also, we created a Jenkinsfile, which defines a set of steps (each step calls a certain actions — lane — defined in the above Fastfile) that will be executed on Jenkins based on the branch name (GitFlow model):
def commitAuthor(){ sh 'git show -s --pretty=%an > .git/commitAuthor' def commitAuthor = readFile('.git/commitAuthor').trim() sh 'rm .git/commitAuthor' commitAuthor }
def commitID() { sh 'git rev-parse HEAD > .git/commitID' def commitID = readFile('.git/commitID').trim() sh 'rm .git/commitID' commitID }
def commitMessage() { sh 'git log --format=%B -n 1 HEAD > .git/commitMessage' def commitMessage = readFile('.git/commitMessage').trim() sh 'rm .git/commitMessage' commitMessage }
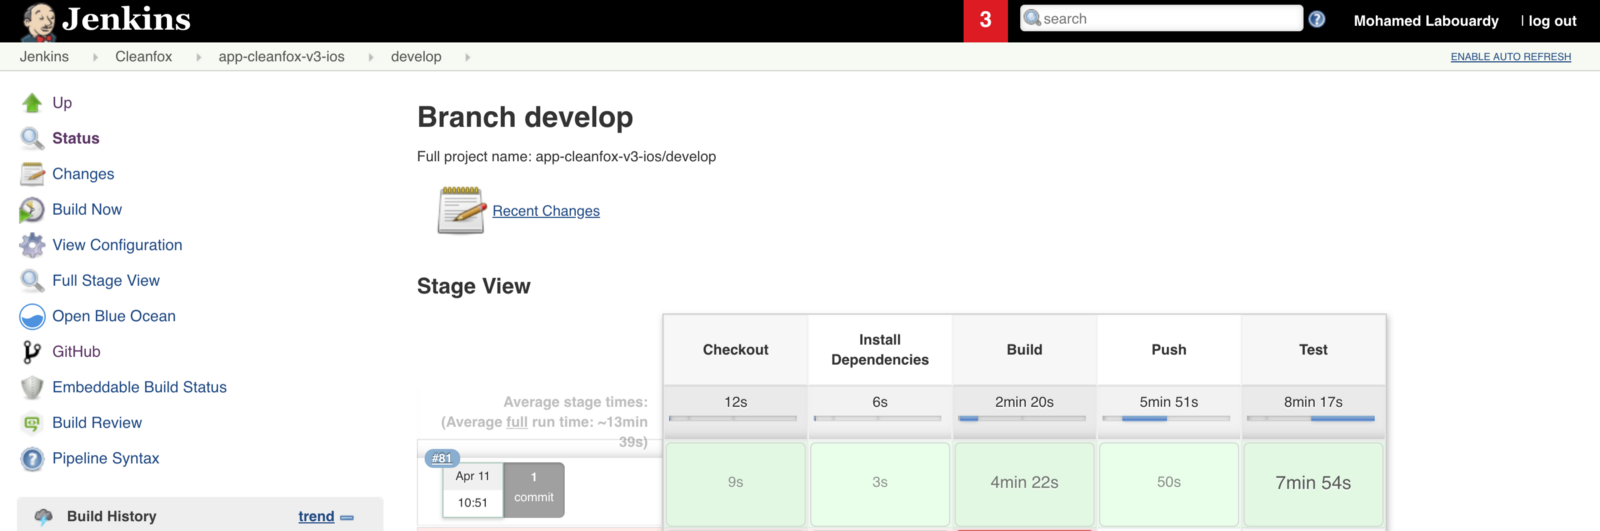
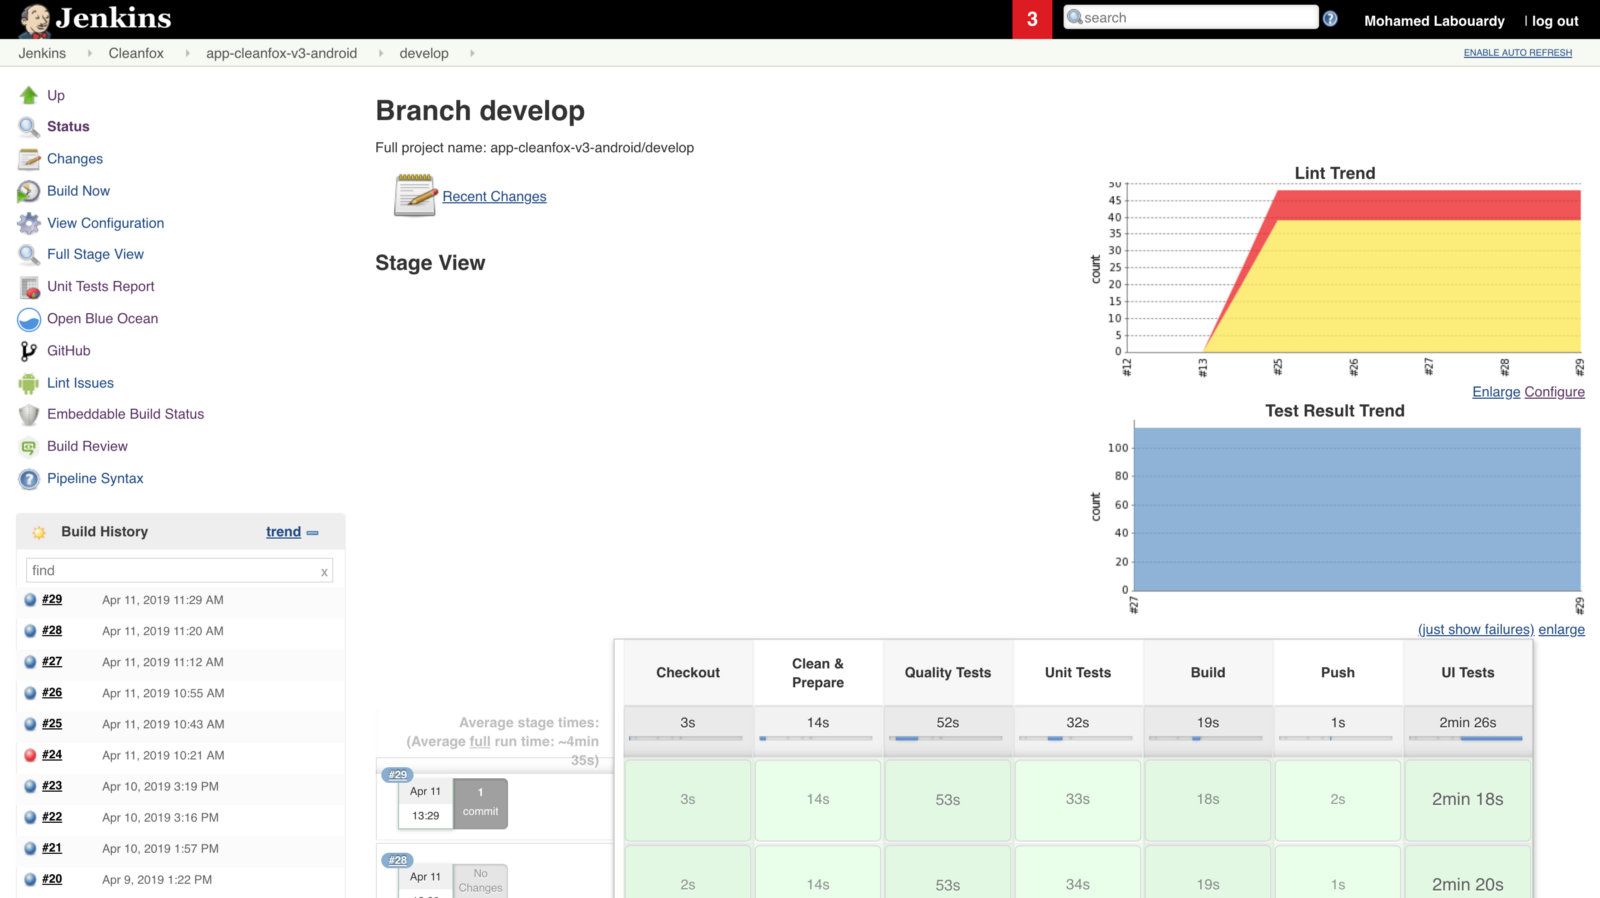
The pipeline is divided into 5 stages:
Checkout: clone the GitHub repository.
Quality & Unit Tests: check whether our code is well formatted and follows Swift best practices and run unit tests.
Build: build and sign the app.
Push: store the deployment package (.ipa file) to an S3 bucket.
UI Test: launch UI tests on Firebase Test Lab across a wide variety of devices and device configurations.
If a build on the CI passes, a Slack notification will be sent (broken build will notify developers to investigate immediately).
Note the usage of the git commit ID as a name for the deployment package to give a meaningful and significant name for each release and be able to roll back to a specific commit if things go wrong.
Once the pipeline is triggered, a new build should be created as follows:
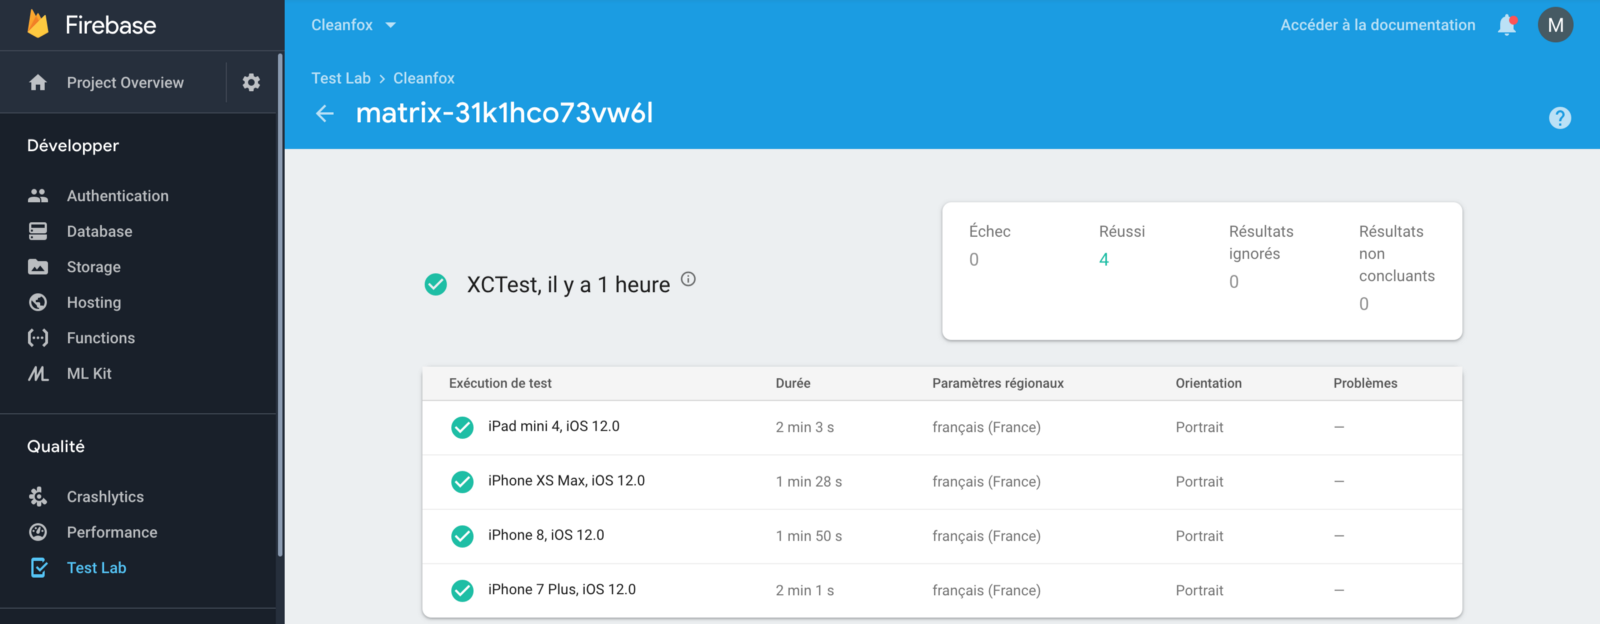
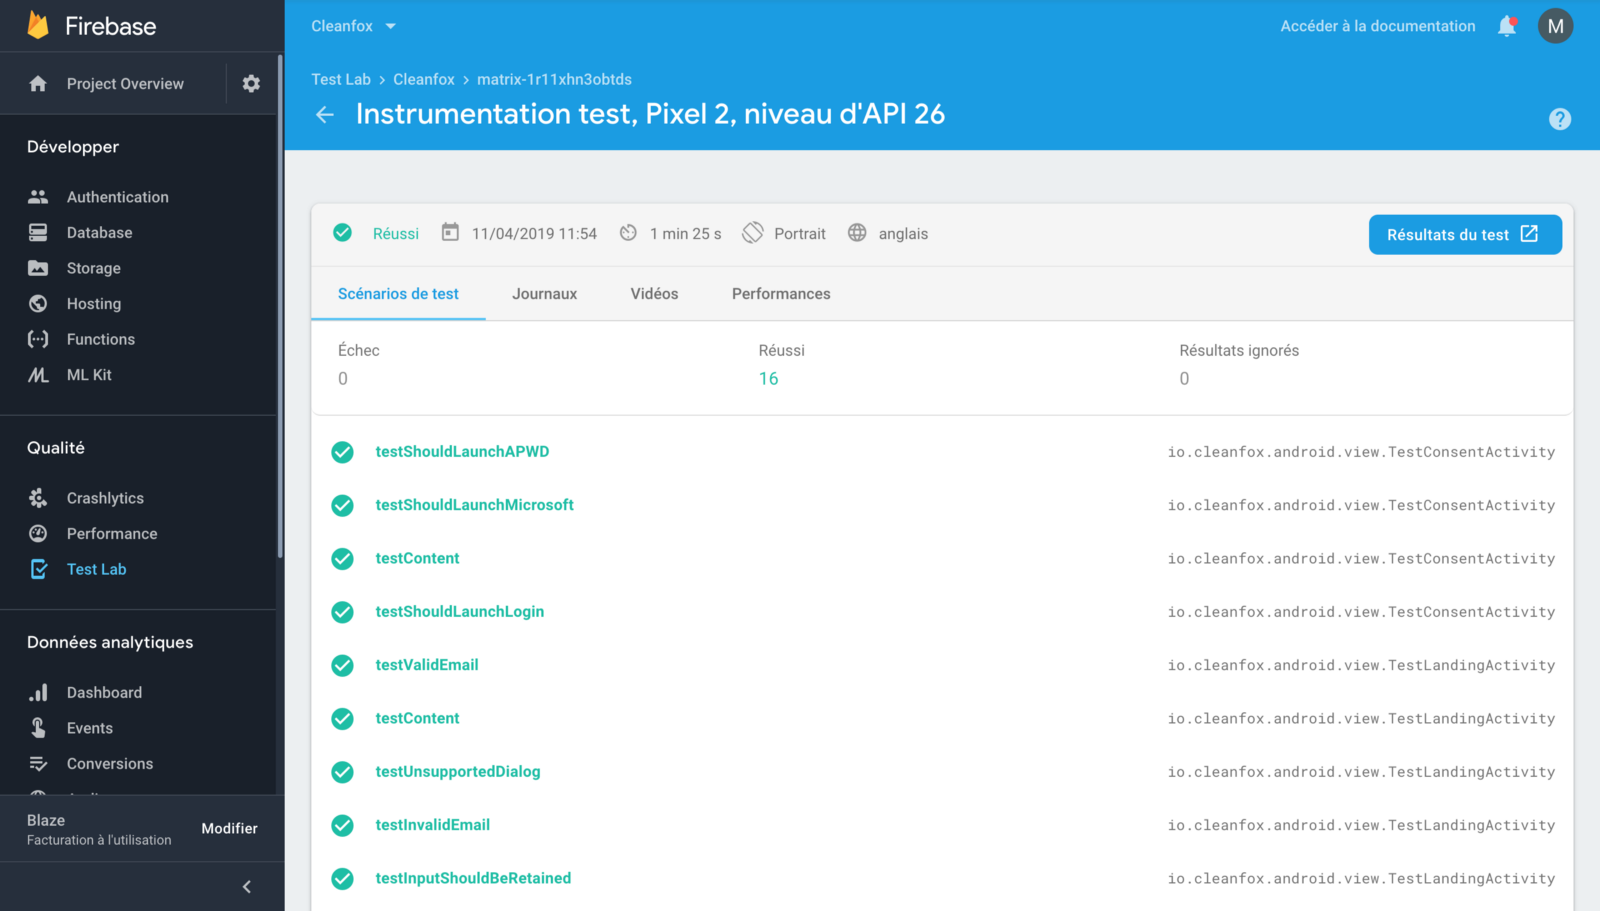
At the end, Jenkins will launch UI Tests based on XCTest framework on Firebase Test Lab across multiple virtual and physical devices and different screen sizes.
We gave a try to AWS Device Farm, but we needed to get over 2 problems at the same time. We sought waiting for a very short time, to receive tests result, without paying too much.
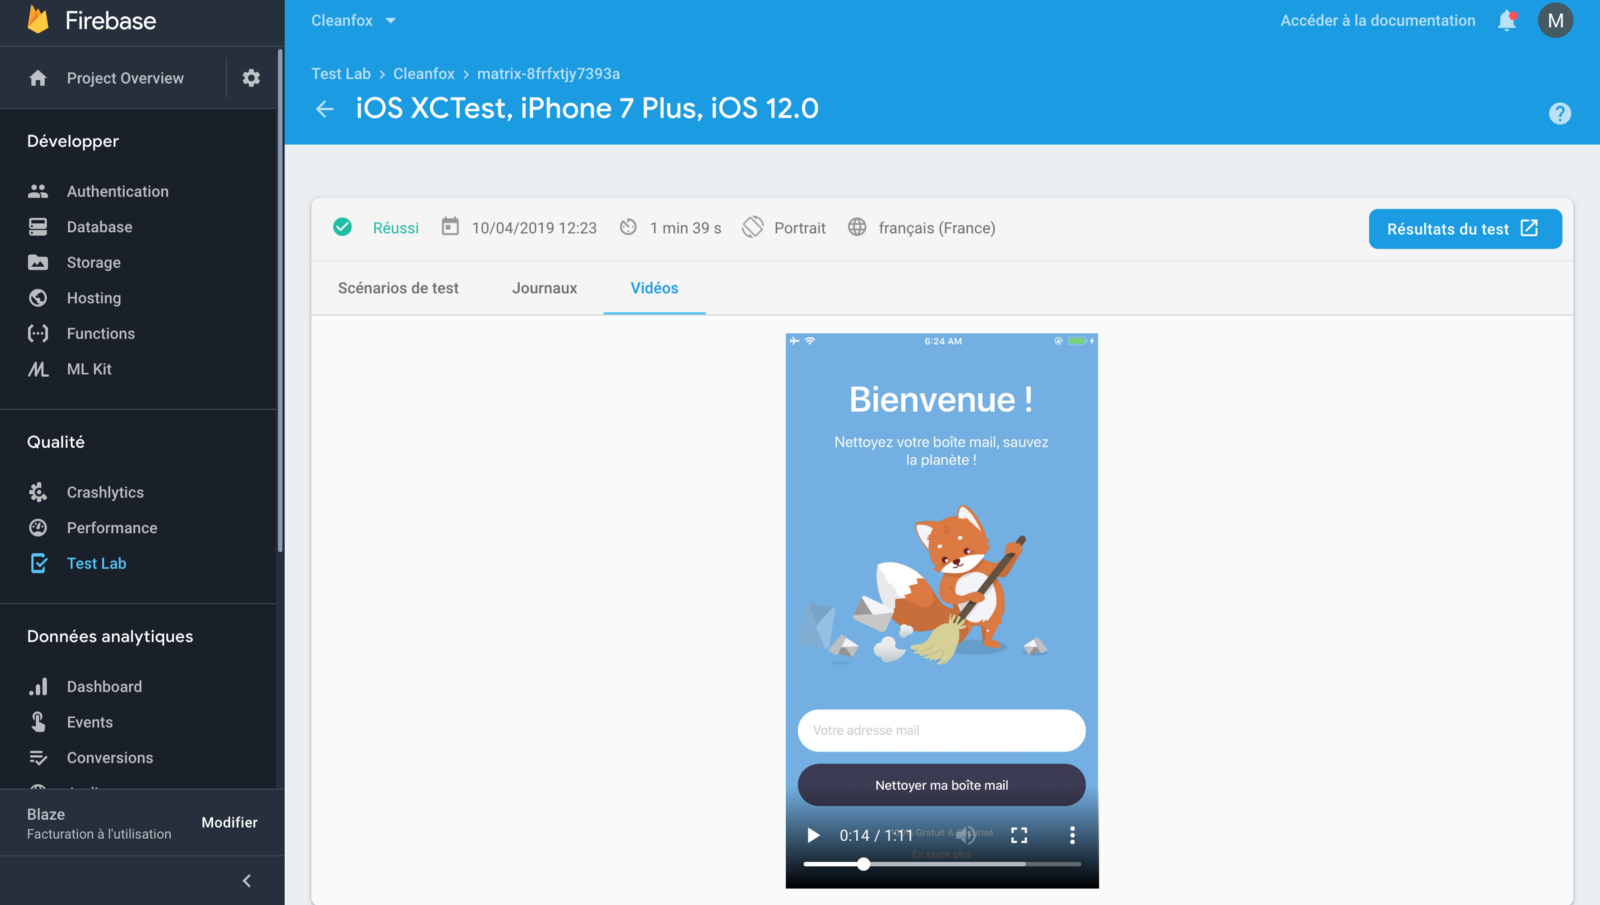
Test Lab exercises your app on devices installed and running in a Google data center. After your tests finish, you can see the results including logs, videos and screenshots in the Firebase console.
You can enhance the workflow to automate taking screenshots through fastlane snapshot command and saves hours of valuable time you’ll burn taking screenshots. To upload the screenshots, metadata and the IPA file to iTunes Connect, you can use deliver command, which is already installed and initialized as part of fastlane.
The Android CI/CD workflow is quite straightforward, as it needs only the JDK environment with Android SDK preinstalled, we are running the CI on a Jenkins slave deployed into an EC2 Spot instance. The pipeline contains the following stages:
stage('Quality Tests') { sh "./gradlew lintDebug" androidLint pattern:'app/build/reports/lint-results-debug.xml' }
stage('Unit Tests') { sh "./gradlew testDebug --stacktrace"
if (env.BRANCH_NAME == 'master'){ sh "./gradlew testReleaseUnitTest" } if (env.BRANCH_NAME == 'preprod'){ sh "./gradlew testStagingUnitTest" } if (env.BRANCH_NAME == 'develop'){ sh "./gradlew testSandboxUnitTest" }
if (env.BRANCH_NAME == 'master'){ sh "./gradlew compileReleaseKotlin" } if (env.BRANCH_NAME == 'preprod'){ sh "./gradlew compileStagingKotlin" } if (env.BRANCH_NAME == 'develop'){ sh "./gradlew compileSandboxKotlin" } }
stage('Push'){ sh "aws s3 cp app/build/outputs/apk/debug/app-debug.apk s3://${bucket}/android/${commitID()}.apk" }
stage('UI Tests'){ sh "./gradlew assembleDebugAndroidTest" sh "gcloud firebase test android run --app app/build/outputs/apk/debug/app-debug.apk --test app/build/outputs/apk/androidTest/debug/app-debug-androidTest.apk" } }catch(e){ currentBuild.result = 'FAILED' throw e }finally{ notifySlack(currentBuild.result) } }
The pipeline could be drawn up as the following steps:
Check out the working branch from a remote repository.
Run the code through lint to find poorly structured code that might impact the reliability, efficiency and make the code harder to maintain. The linter will produces XML files which will be parsed by the Android Lint Plugin.
Launch Unit Tests. The JUnit plugin provides a publisher that consumes XML test reports generated and provides some graphical visualization of the historical test results as well as a web UI for viewing test reports, tracking failures, and so on.
Build debug or release APK based on the current Git branch name.
Upload the artifact to an S3 bucket.
Similarly, after the instrumentation tests have finished running, the Firebase web UI will then display the results of each test — in addition to information such as a video recording of the test run, the full Logcat, and screenshots taken:
To bring down testing time (and reduce the cost), we are testing Flank to split the test suite into multiple parts and execute them in parallel across multiple devices.
Our Continuous Integration workflow is sailing now. So far we’ve found that this process strikes the right balance. It automates the repetitive aspects, provides protection but is still lightweight and flexible. The last thing we want is the ability to ship at any time. We have an additional stage to upload the iOS artifact to Test Flight for distribution to our awesome beta tests.
Like what you’re reading? Check out my book and learn how to build, secure, deploy and manage production-ready Serverless applications in Golang with AWS Lambda.
Drop your comments, feedback, or suggestions below — or connect with me directly on Twitter @mlabouardy.
AWS GPU instances are known for deep learning purposes but they can also be used for running video games. This tutorial goes through how to set up your own EC2 GPU optimised instance to run the top-selling and most played game “PlayerUnknown’s Battlegrounds (PUBG)”.
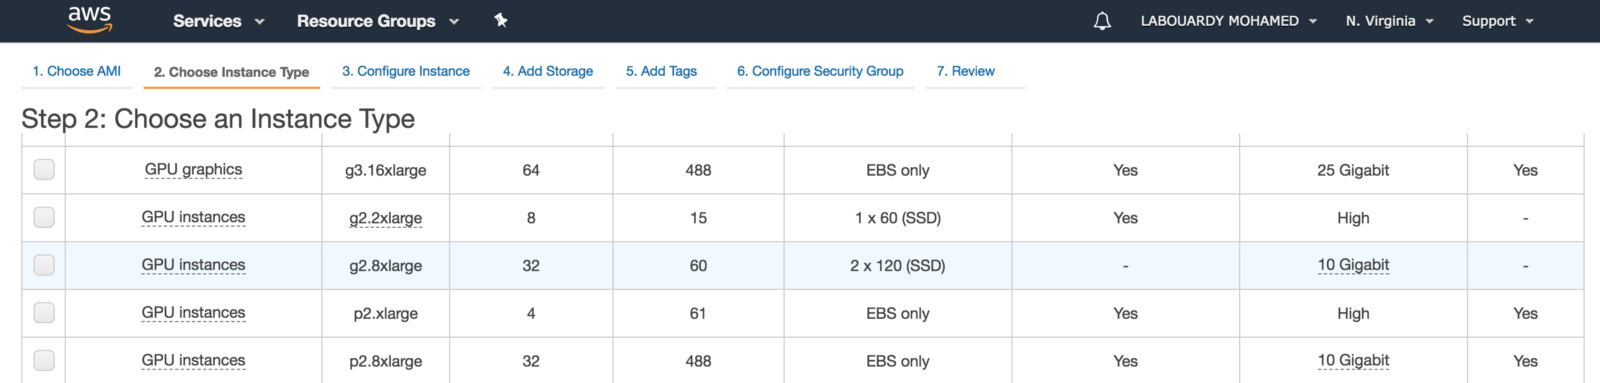
To get started, make sure you are in the AWS region closest to you, select Microsoft Windows Server to be the AMI and set the instance type to be g2.2xlarge. The instance is backed by Nvidia Grid GPU (Kepler GK104), 8x hardware hyper-threads from an Intel Xeon E5–2670 and 15GB of RAM.
For games with resource-intensive, you should use the next generation of GPU instances: P2, P3 and G3 (have up to 4 NVIDIA Tesla M60 GPUs).
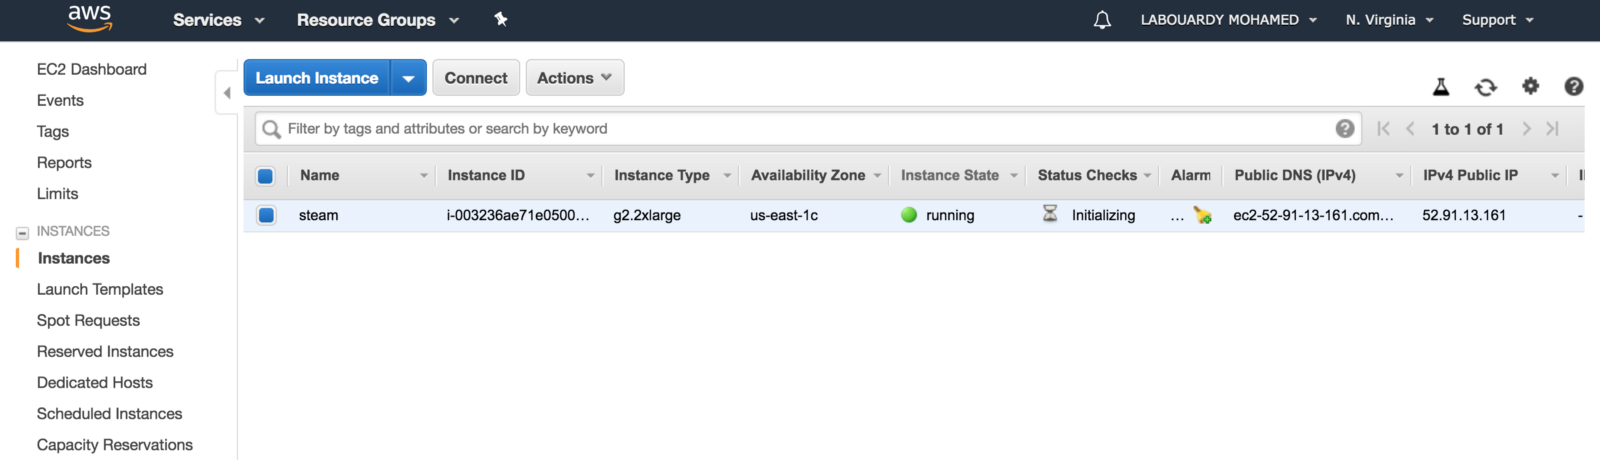
After this is done, click on “Launch Instances”, and you should see a screen showing that your instance is been created:
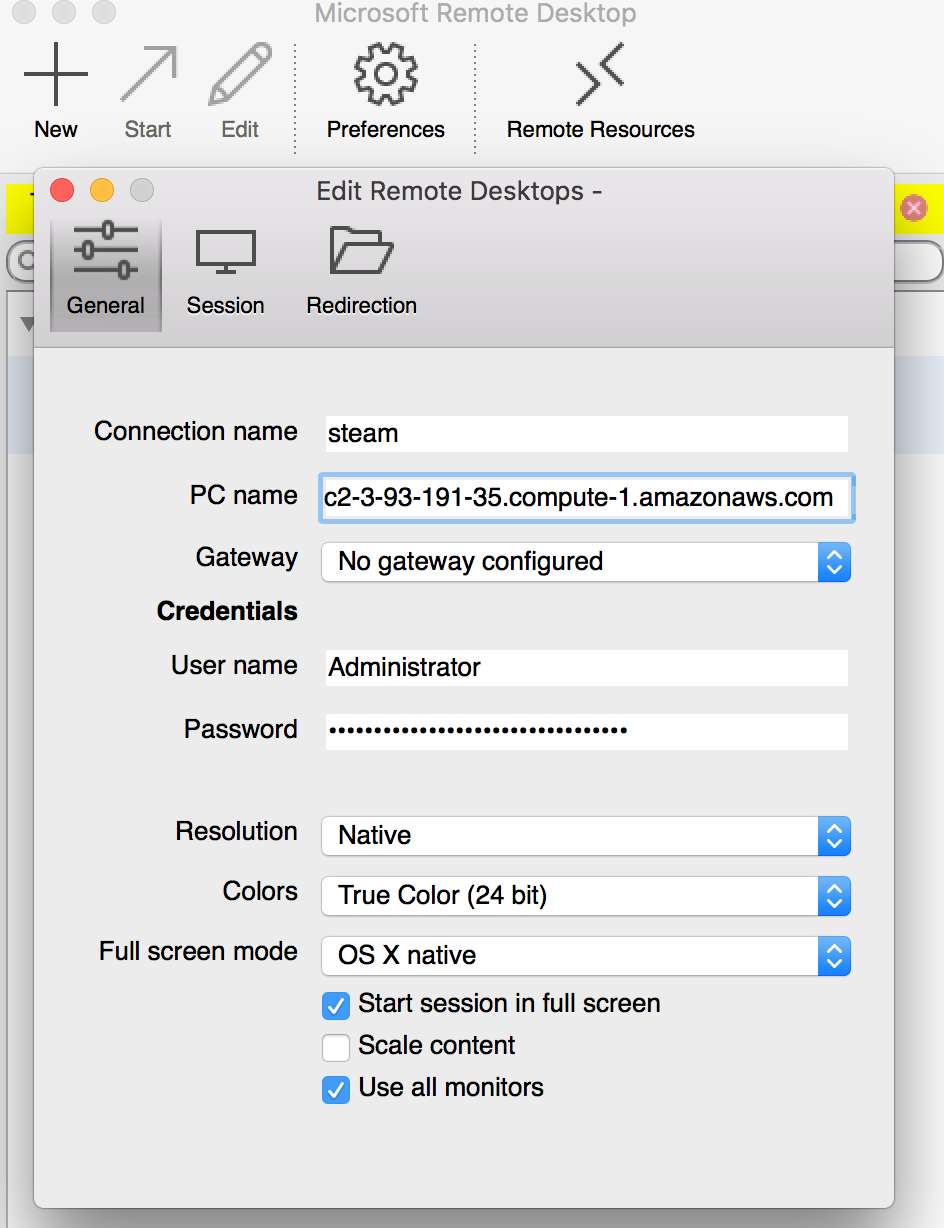
To connect to your Windows instance, you must retrieve the initial administrator password and specify this password when you connect to your instance using Remote Desktop:
Before you attempt to log in using Remote Desktop Connection, you must open port 3389 on the security group attached to your instance
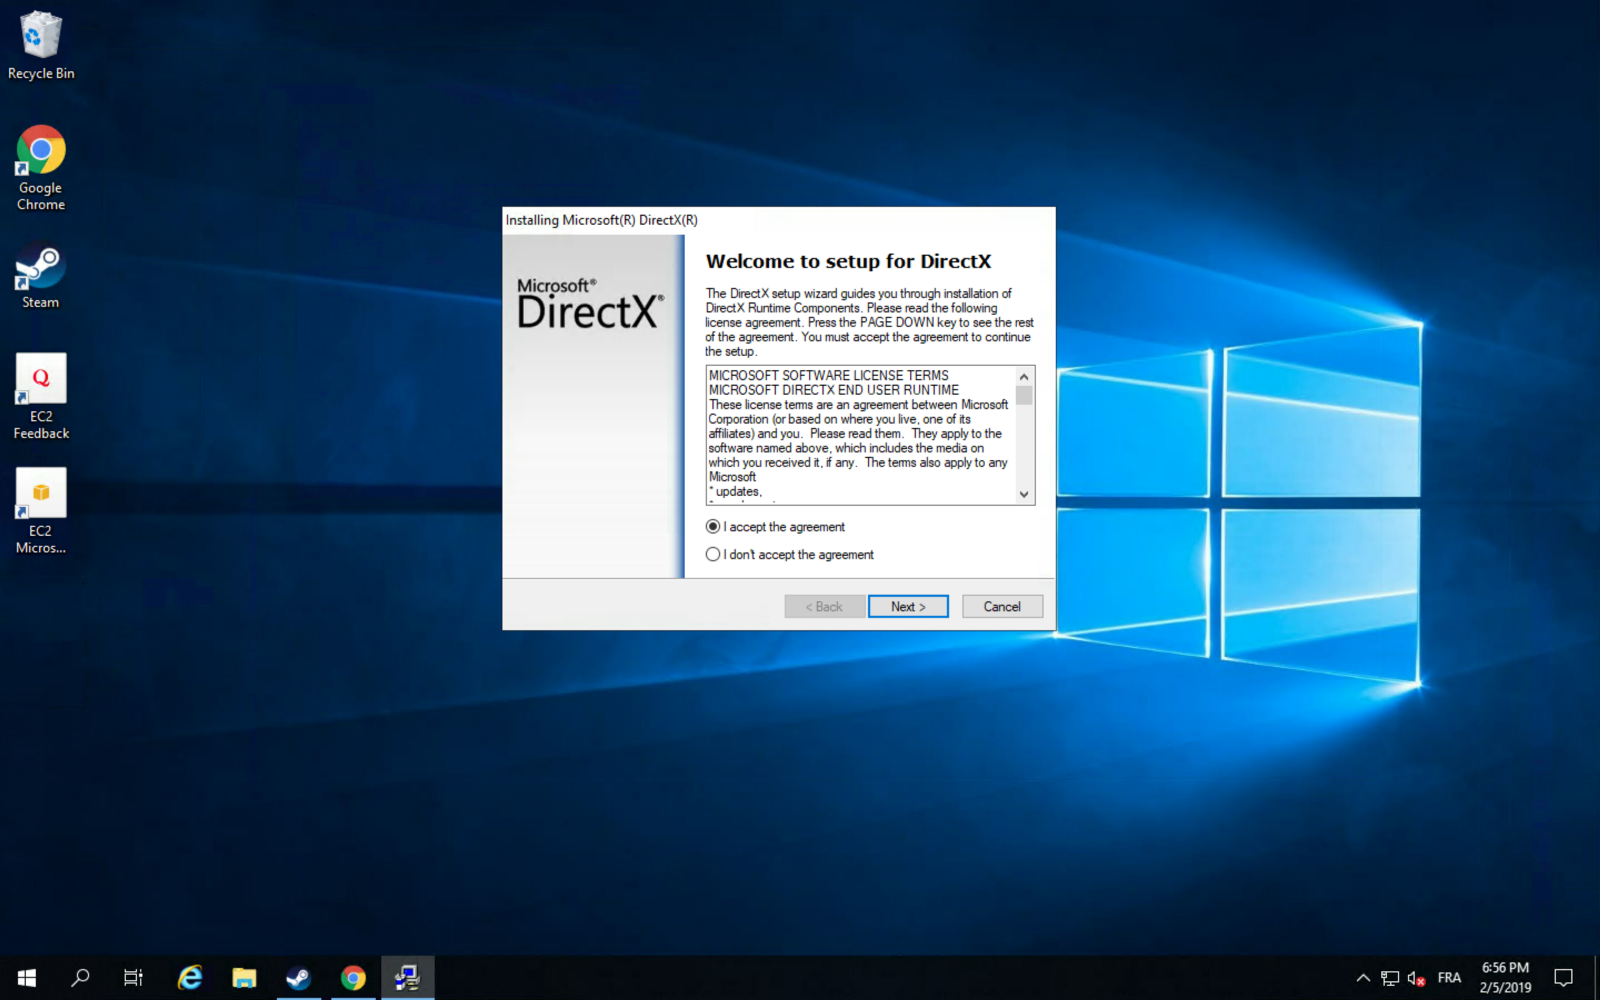
After you connect, install Microsoft Direct X11 after installing Chrome (it saves a lot of time):
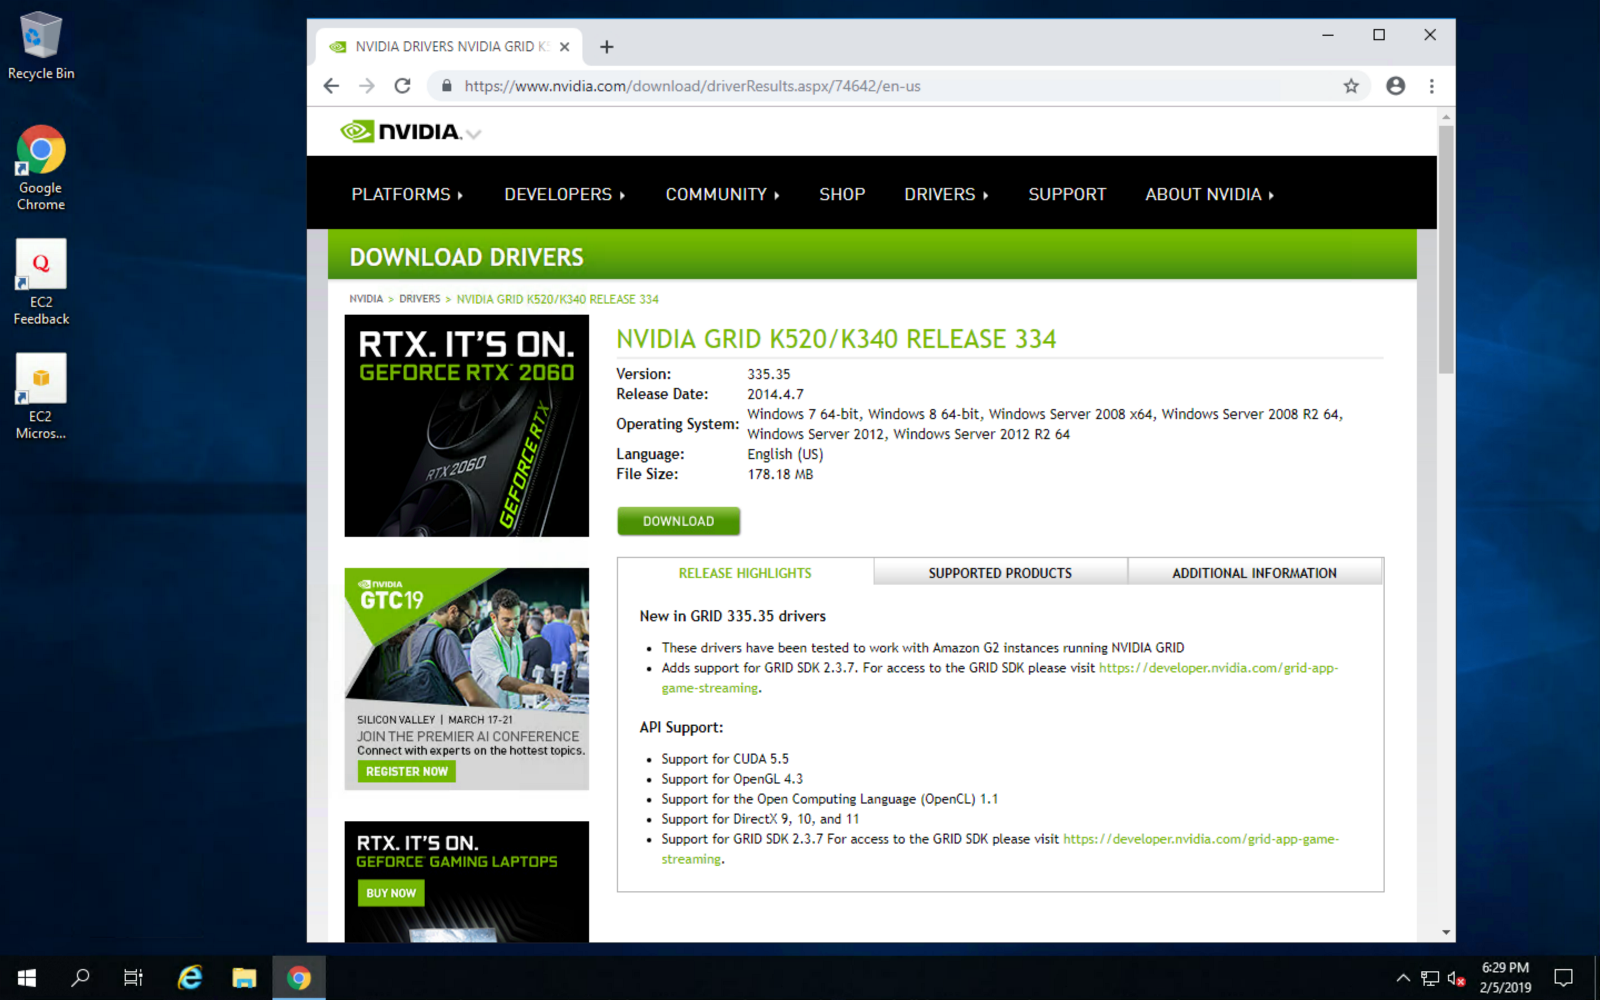
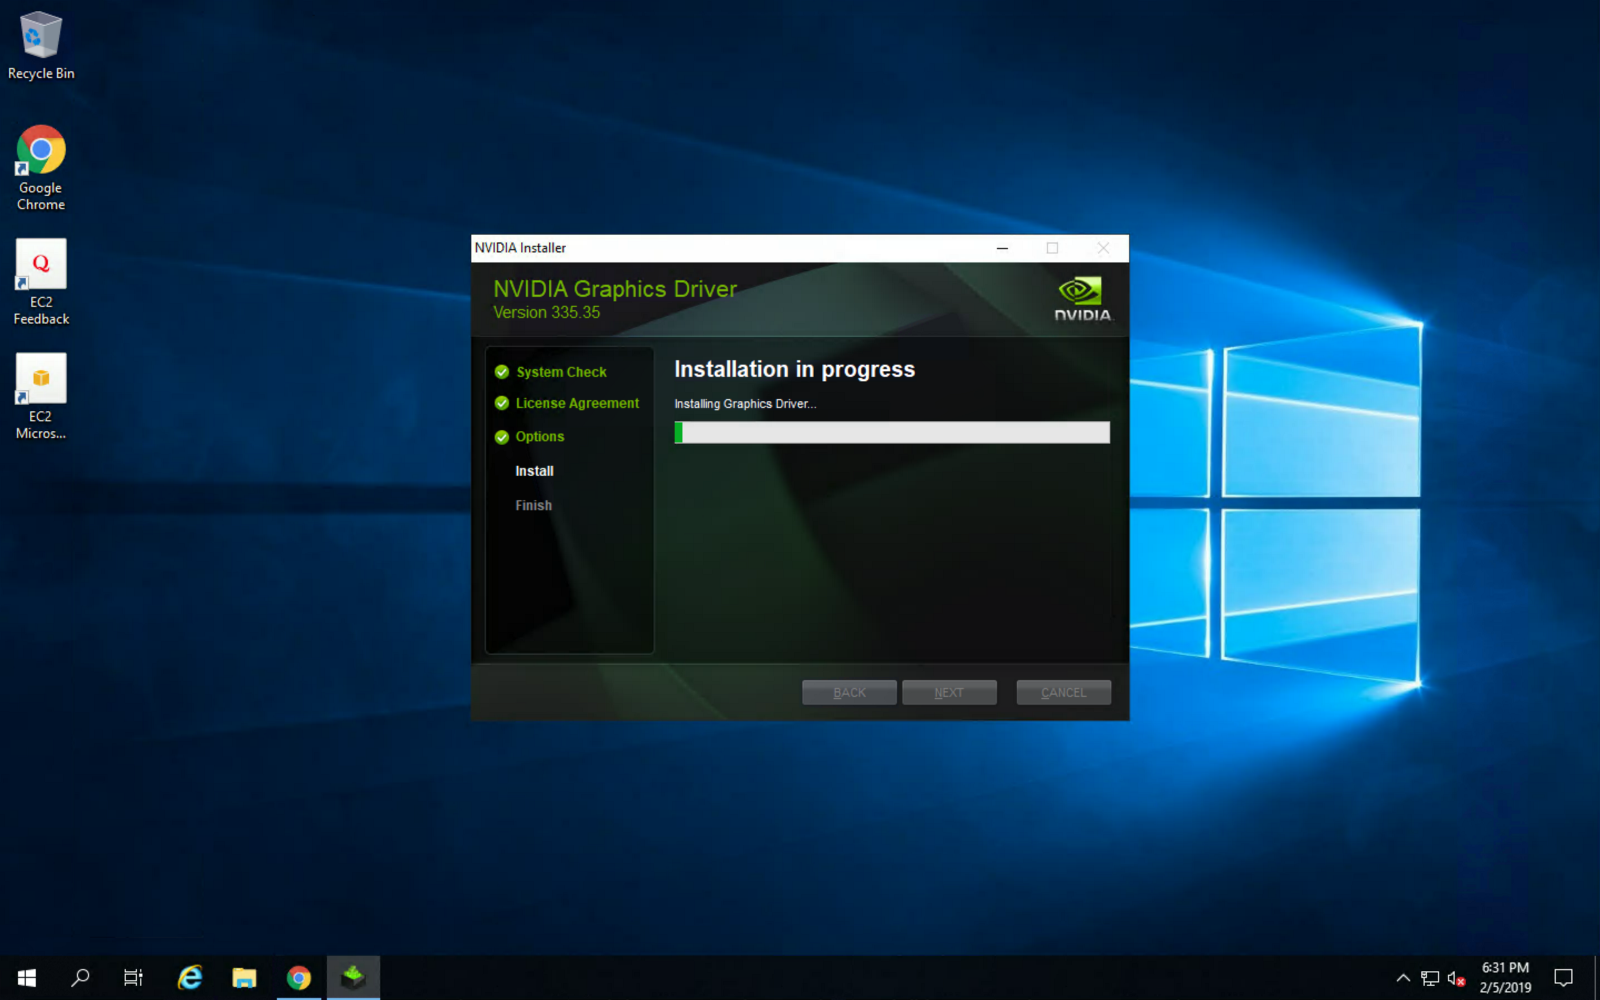
Next, install the graphic driver for maximum gaming performance:
Once installed, make sure to reboot the instance for changes to take effect:
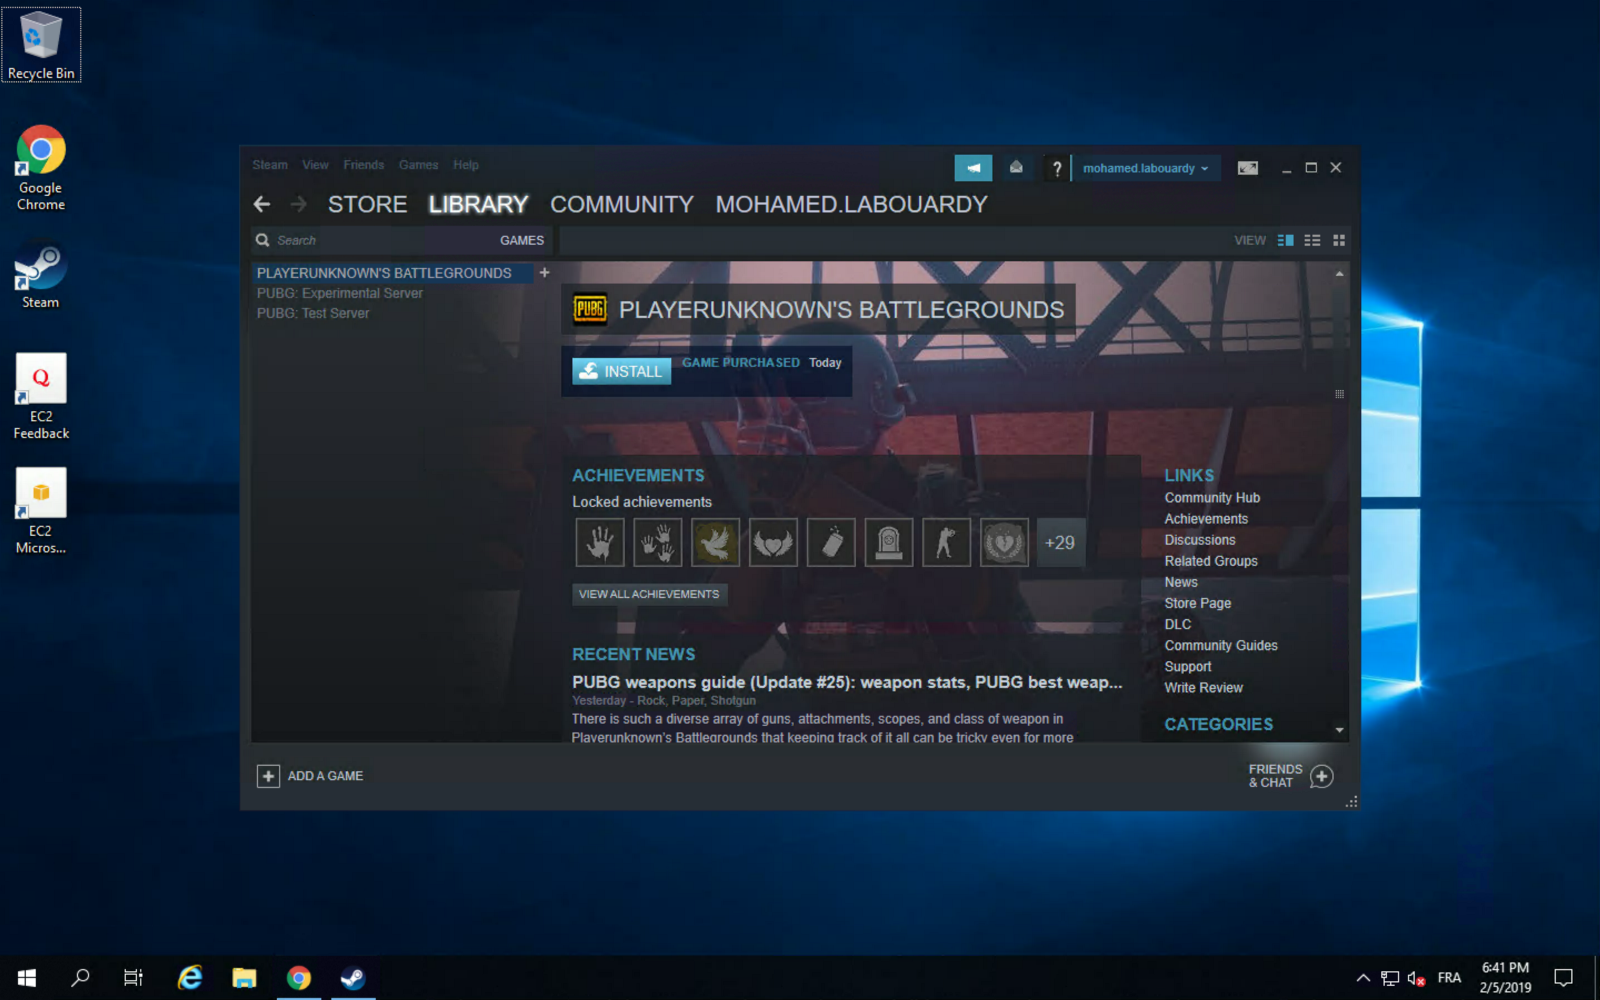
Then, install Steam, login using your account and install PUBG from the “Library” section:
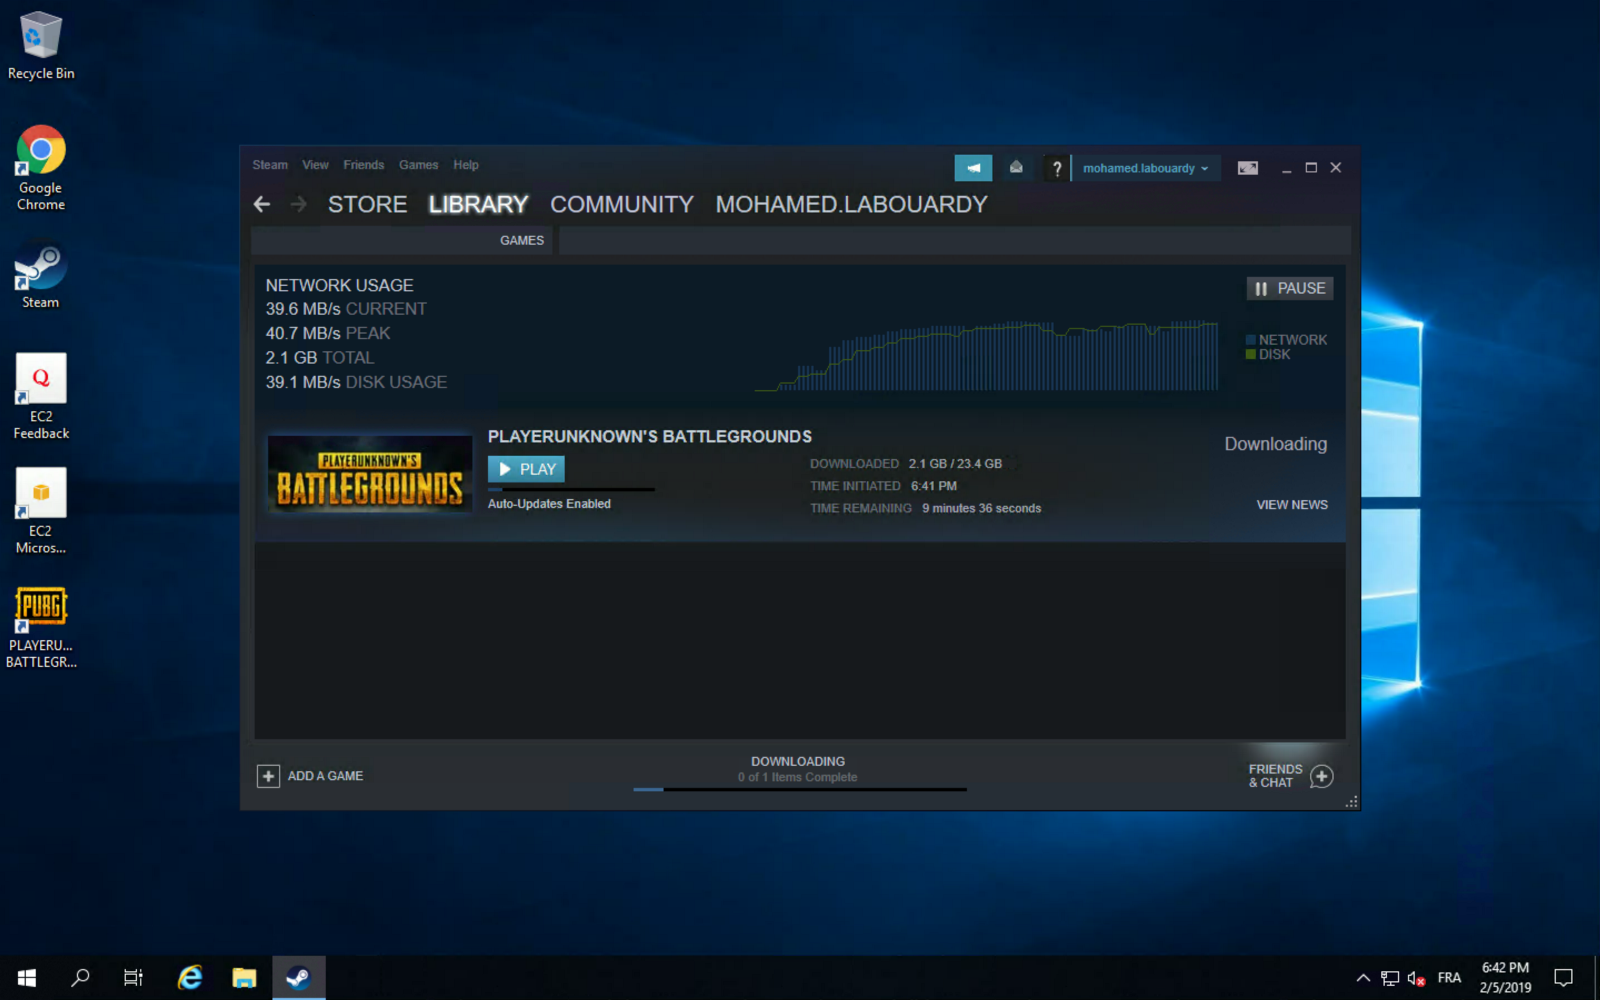
You can take advantage of AWS high network performance (up to 10 Gbps of bandwidth):
Once the game is installed, you can play PUBG on your virtualized GPU instance:
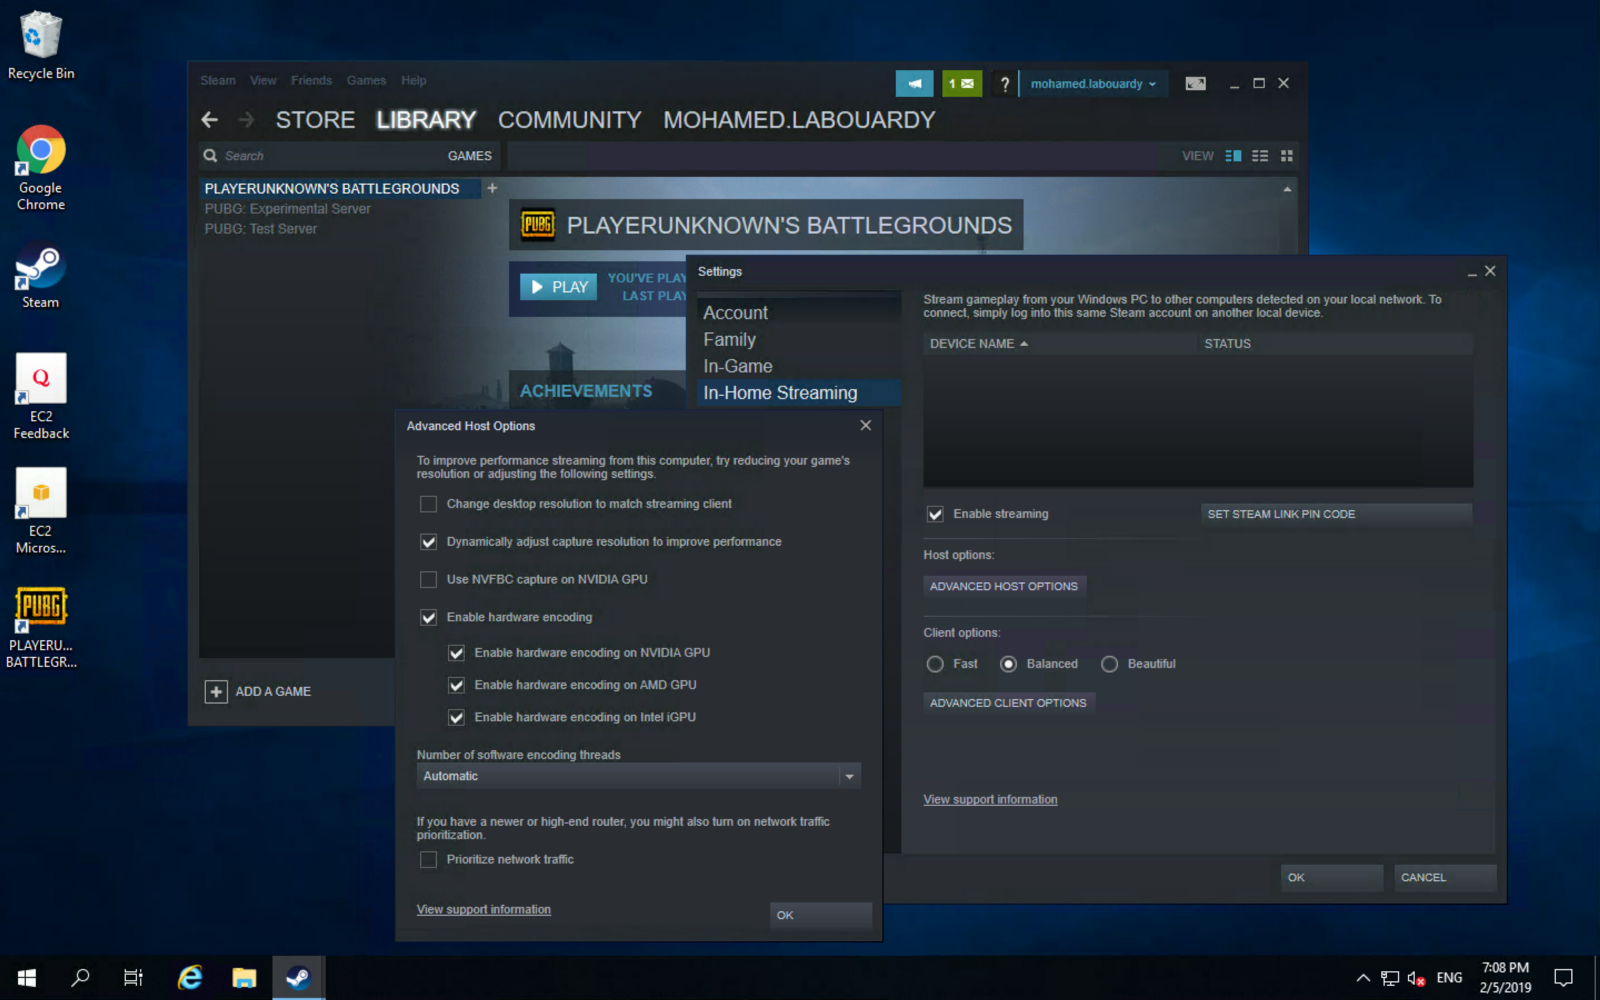
You can take this further, and use Steam In-Home Streaming feature to stream your game from your EC2 instance to your Mac:
Enjoy the game ! you can now play your games on any device connected to the same network:
You might want to bake an AMI based on your instance to avoid set it up all again the next time you want to play and use spot instances to reduce the instance cost. Also, make sure to stop your instances when you’re done for the day to avoid incurring charges. GPU instances are costly (disk storage also costs something, and can be significant if you have a large disk footprint).
Drop your comments, feedback, or suggestions below — or connect with me directly on Twitter @mlabouardy.
AWS Elastic Beanstalk is one of the most used PaaS today, it allows you to deploy your application without provisioning the underlying infrastructure while maintaining the high availability of your application. However, it’s painful to use due to the lack of documentation and real-world scenarios. In this post, I will walk you through how to use Elastic Beanstalk to deploy Docker containers from scratch. Followed by how to automate your deployment process with a Continuous Integration pipeline. At the end of this post, you should be familiar with advanced topics like debugging and monitoring of your applications in EB.
1 – Environment Setup
To get started, create a new Application using the following AWS CLI command:
Next, we will create a Dockerfile to build the Docker image. Go is a compiled language, therefore we can use the Docker multi-stage feature to build a lightweight Docker image:
1 2 3 4 5 6 7 8 9 10 11 12 13
FROM golang:1.10 as builder WORKDIR /go/src/github.com/mlabouardy/docker-eb-ci-mon COPY main.go . RUN CGO_ENABLED=0 GOOS=linux go build -a -installsuffix cgo -o app .
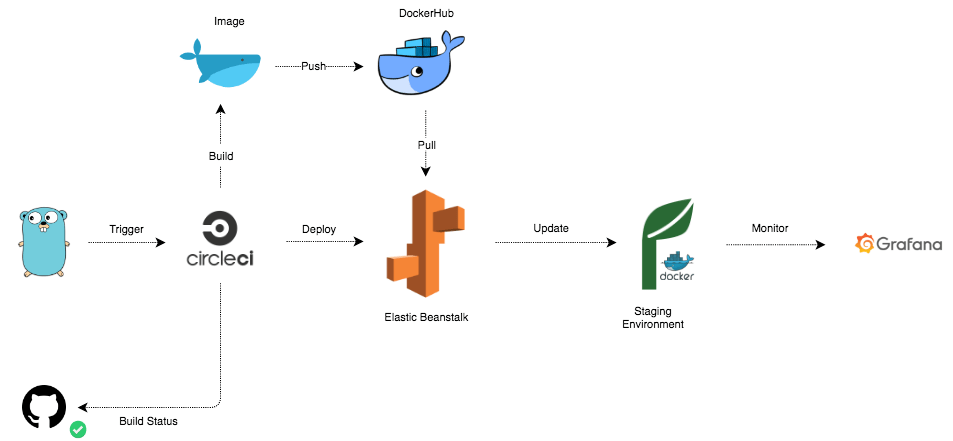
The pipeline will firstly prepare the environment, installing the AWS CLI. Then run unit tests. Next, a Docker image will be built, then pushed to DockerHub. Last step is creating a new application bundle and deploying the bundle to Elastic Beanstalk.
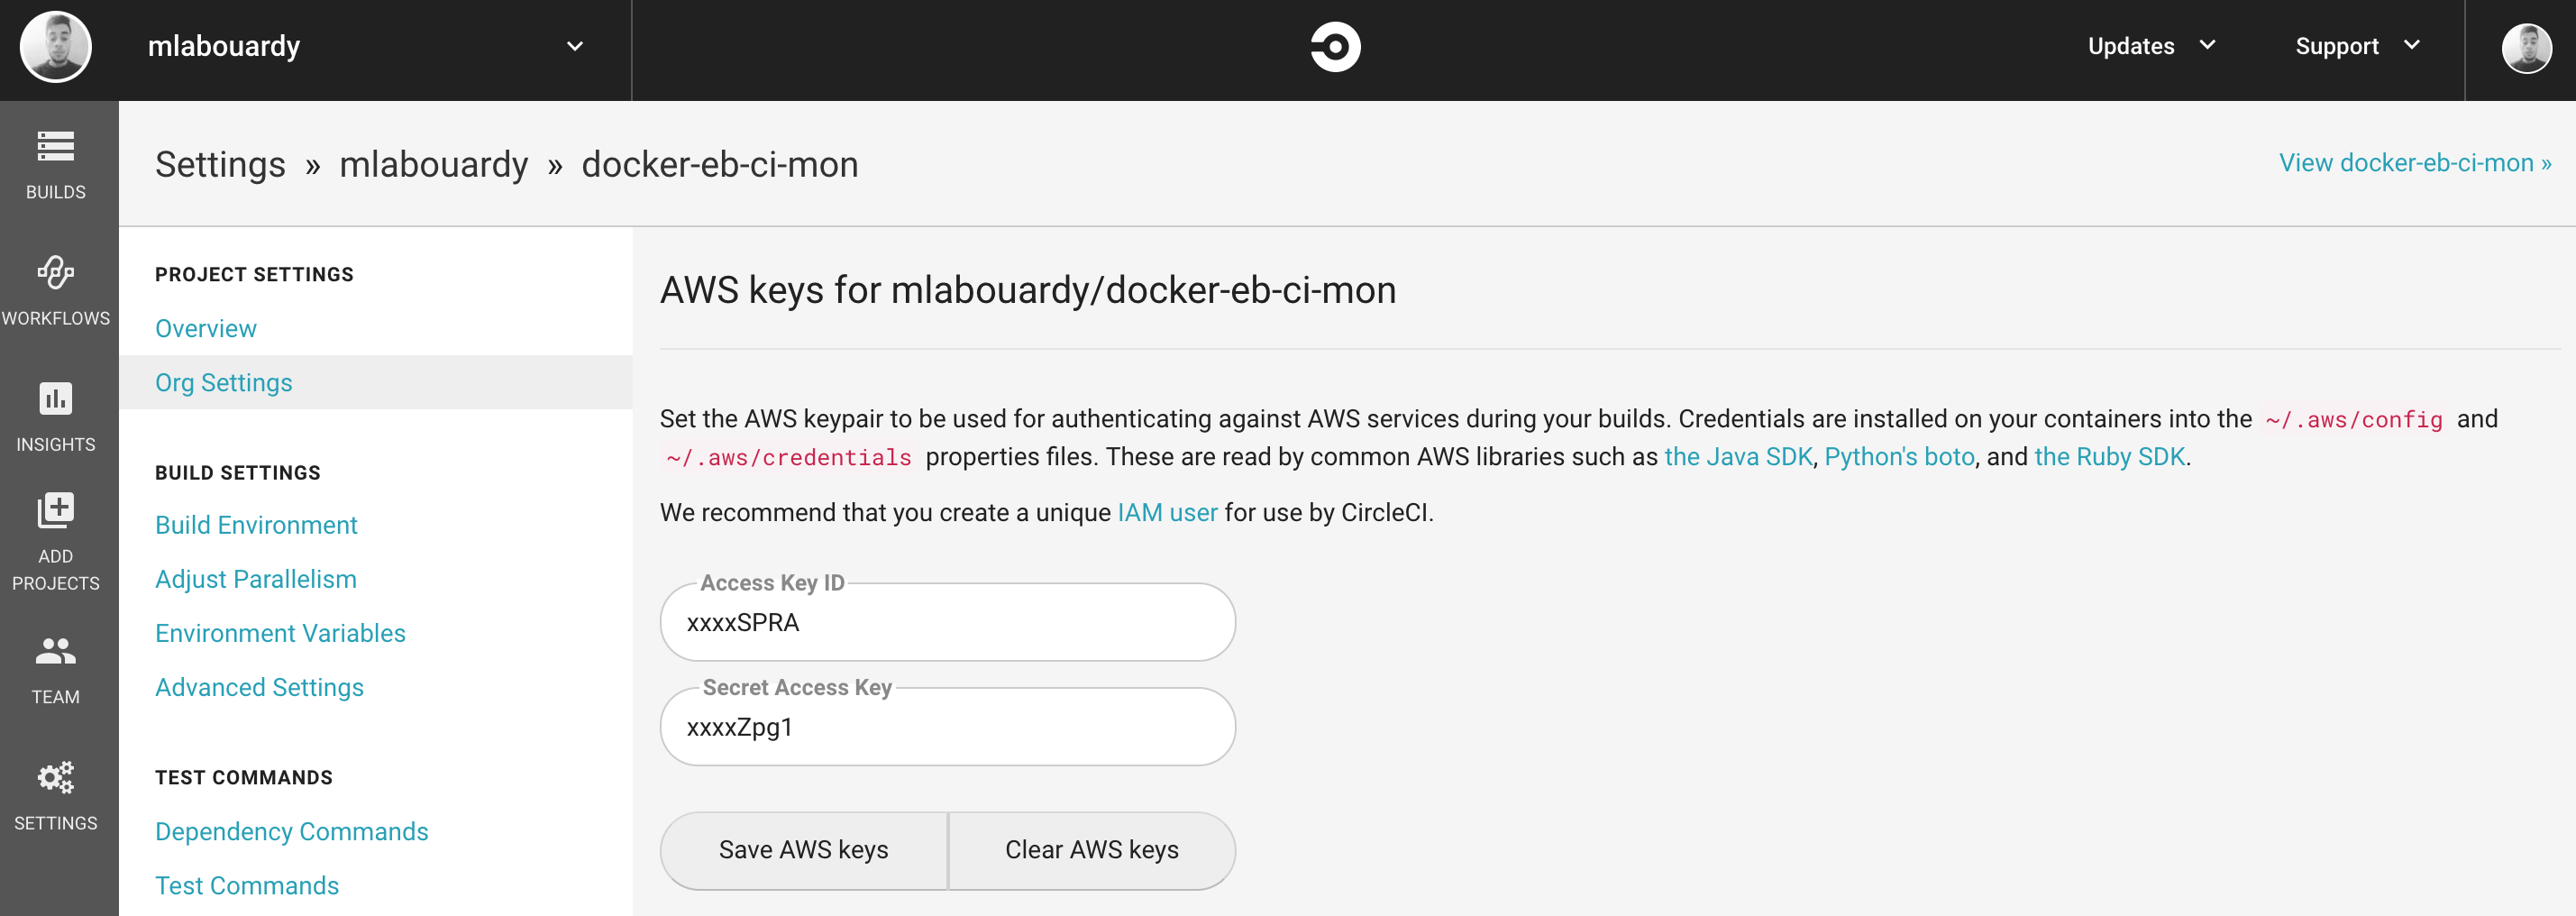
In order to grant Circle CI permissions to call AWS operations, we need to create a new IAM user with following IAM policy:
Generate AWS access & secret keys. Then, head back to Circle CI and click on the project settings and paste the credentials :
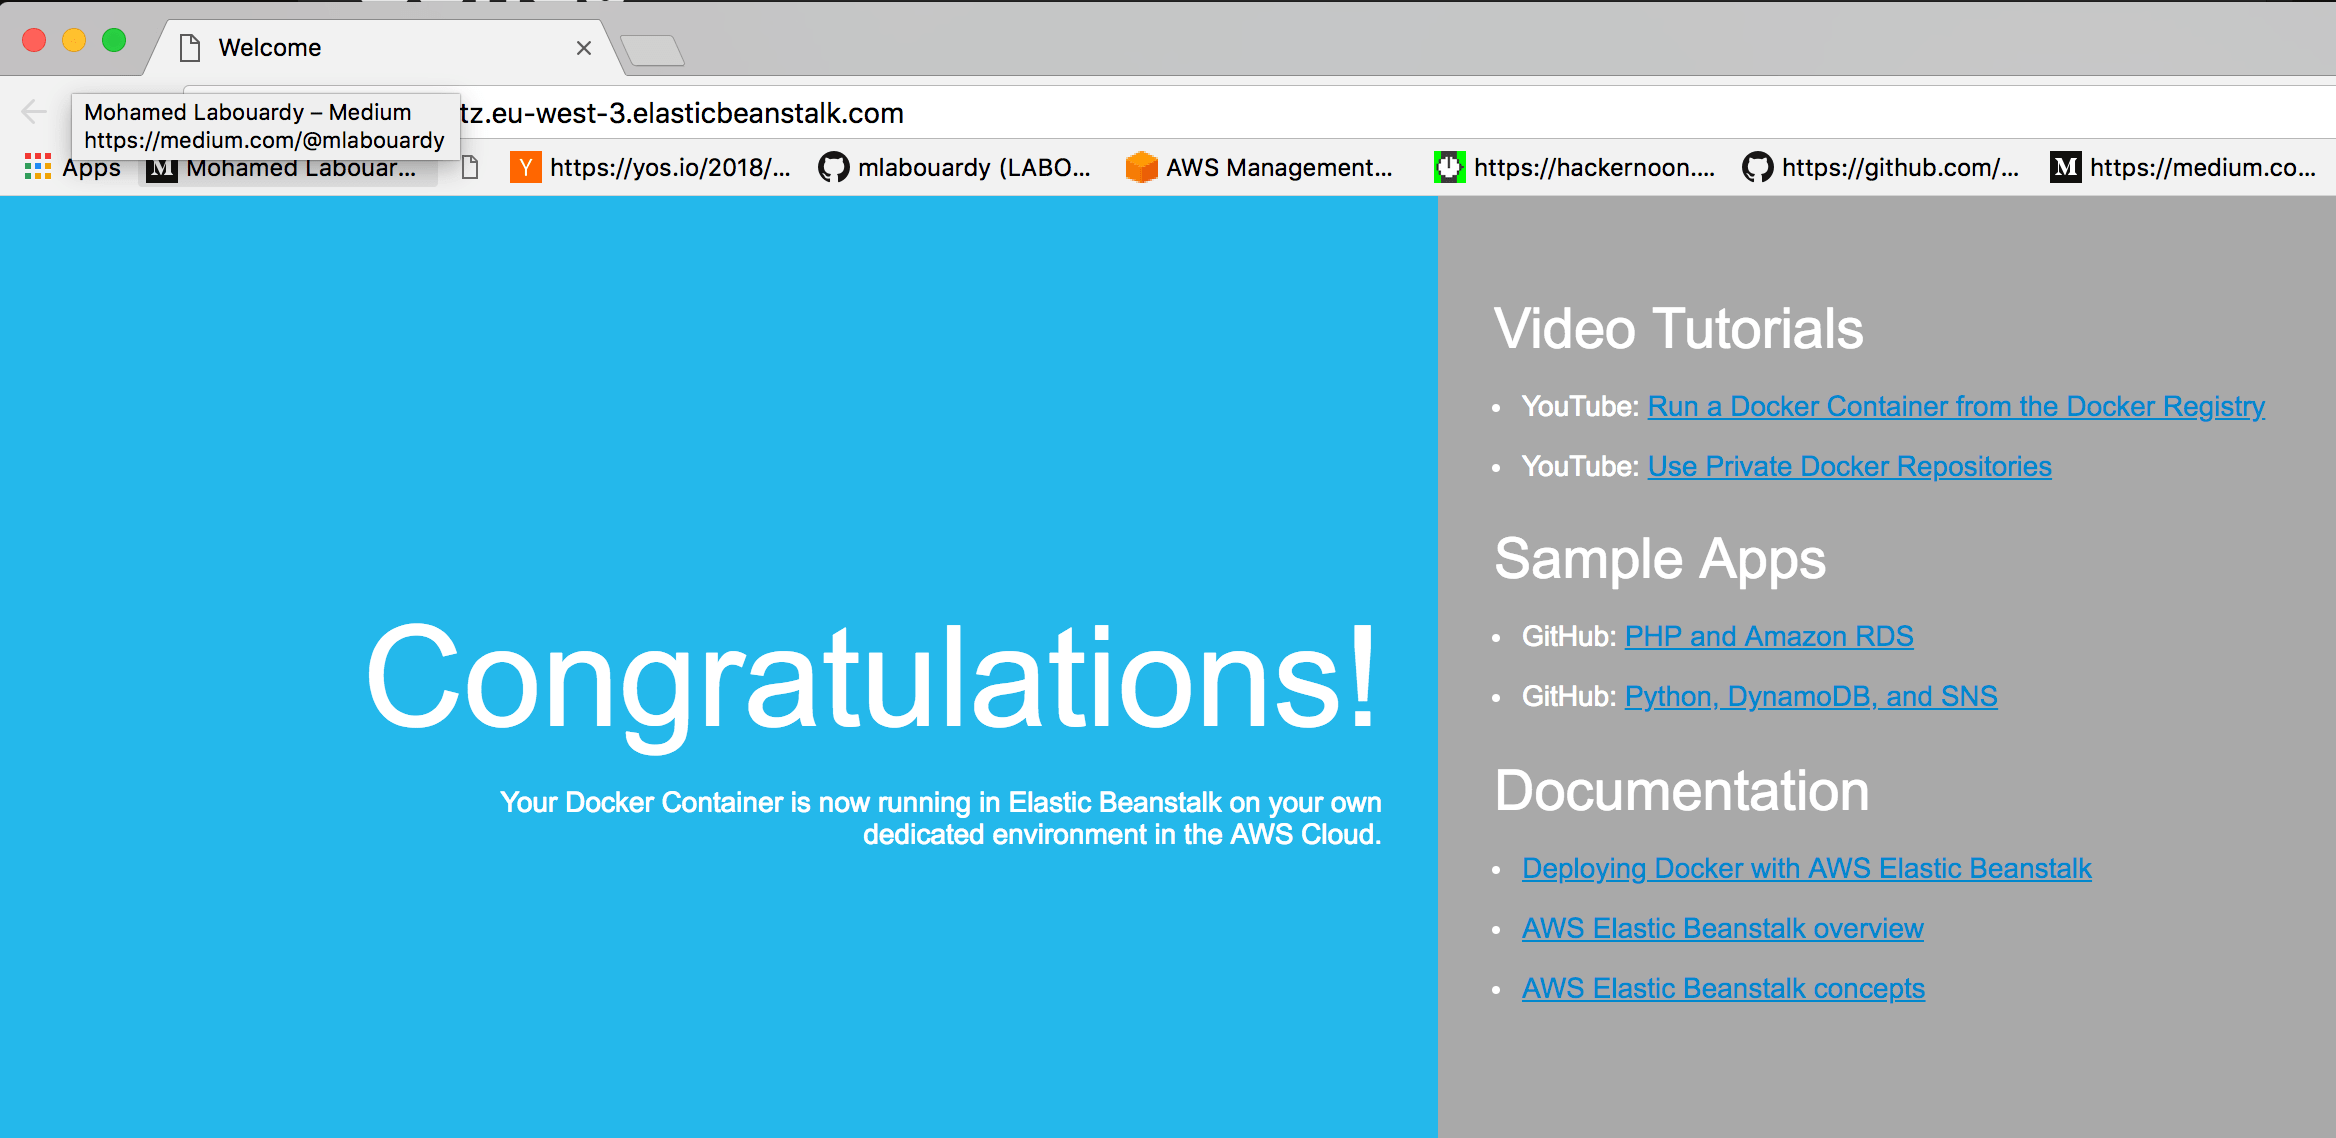
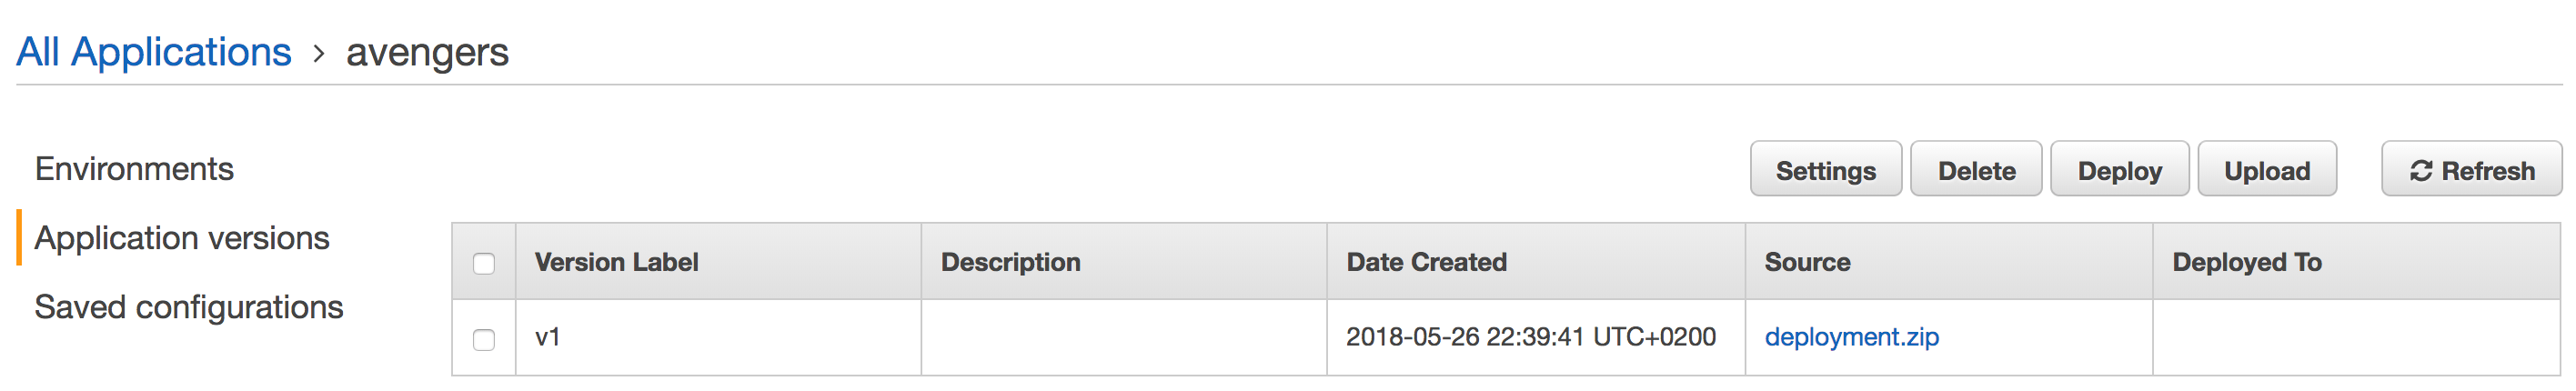
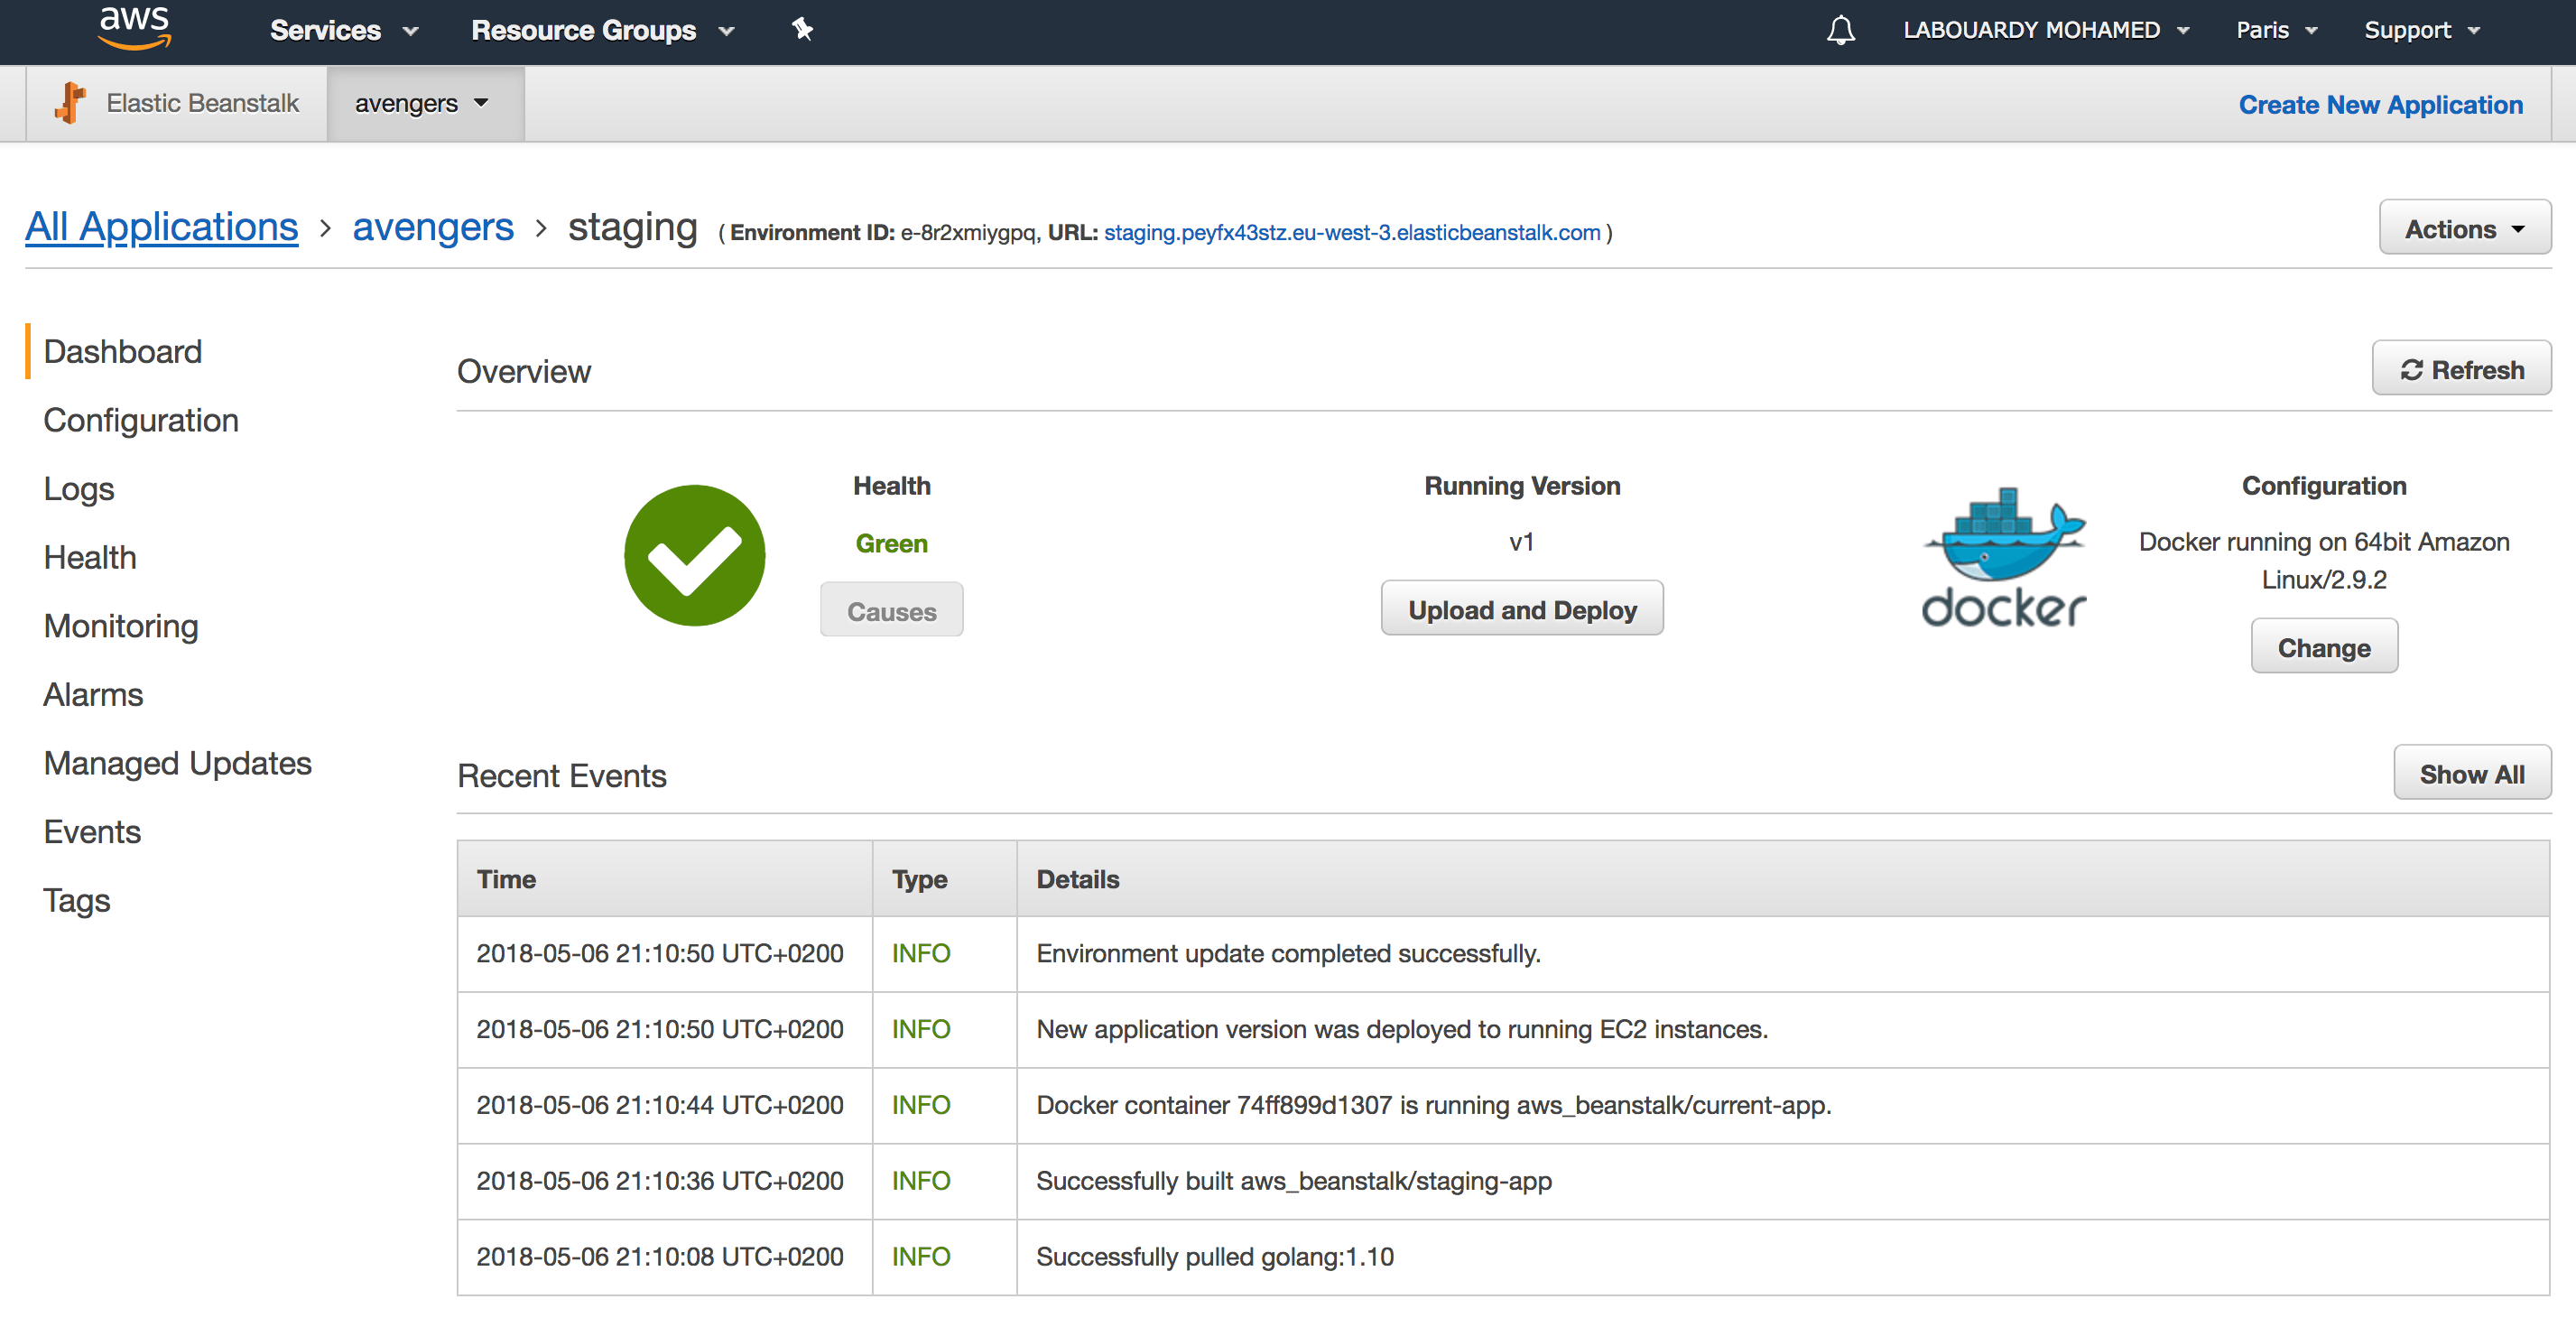
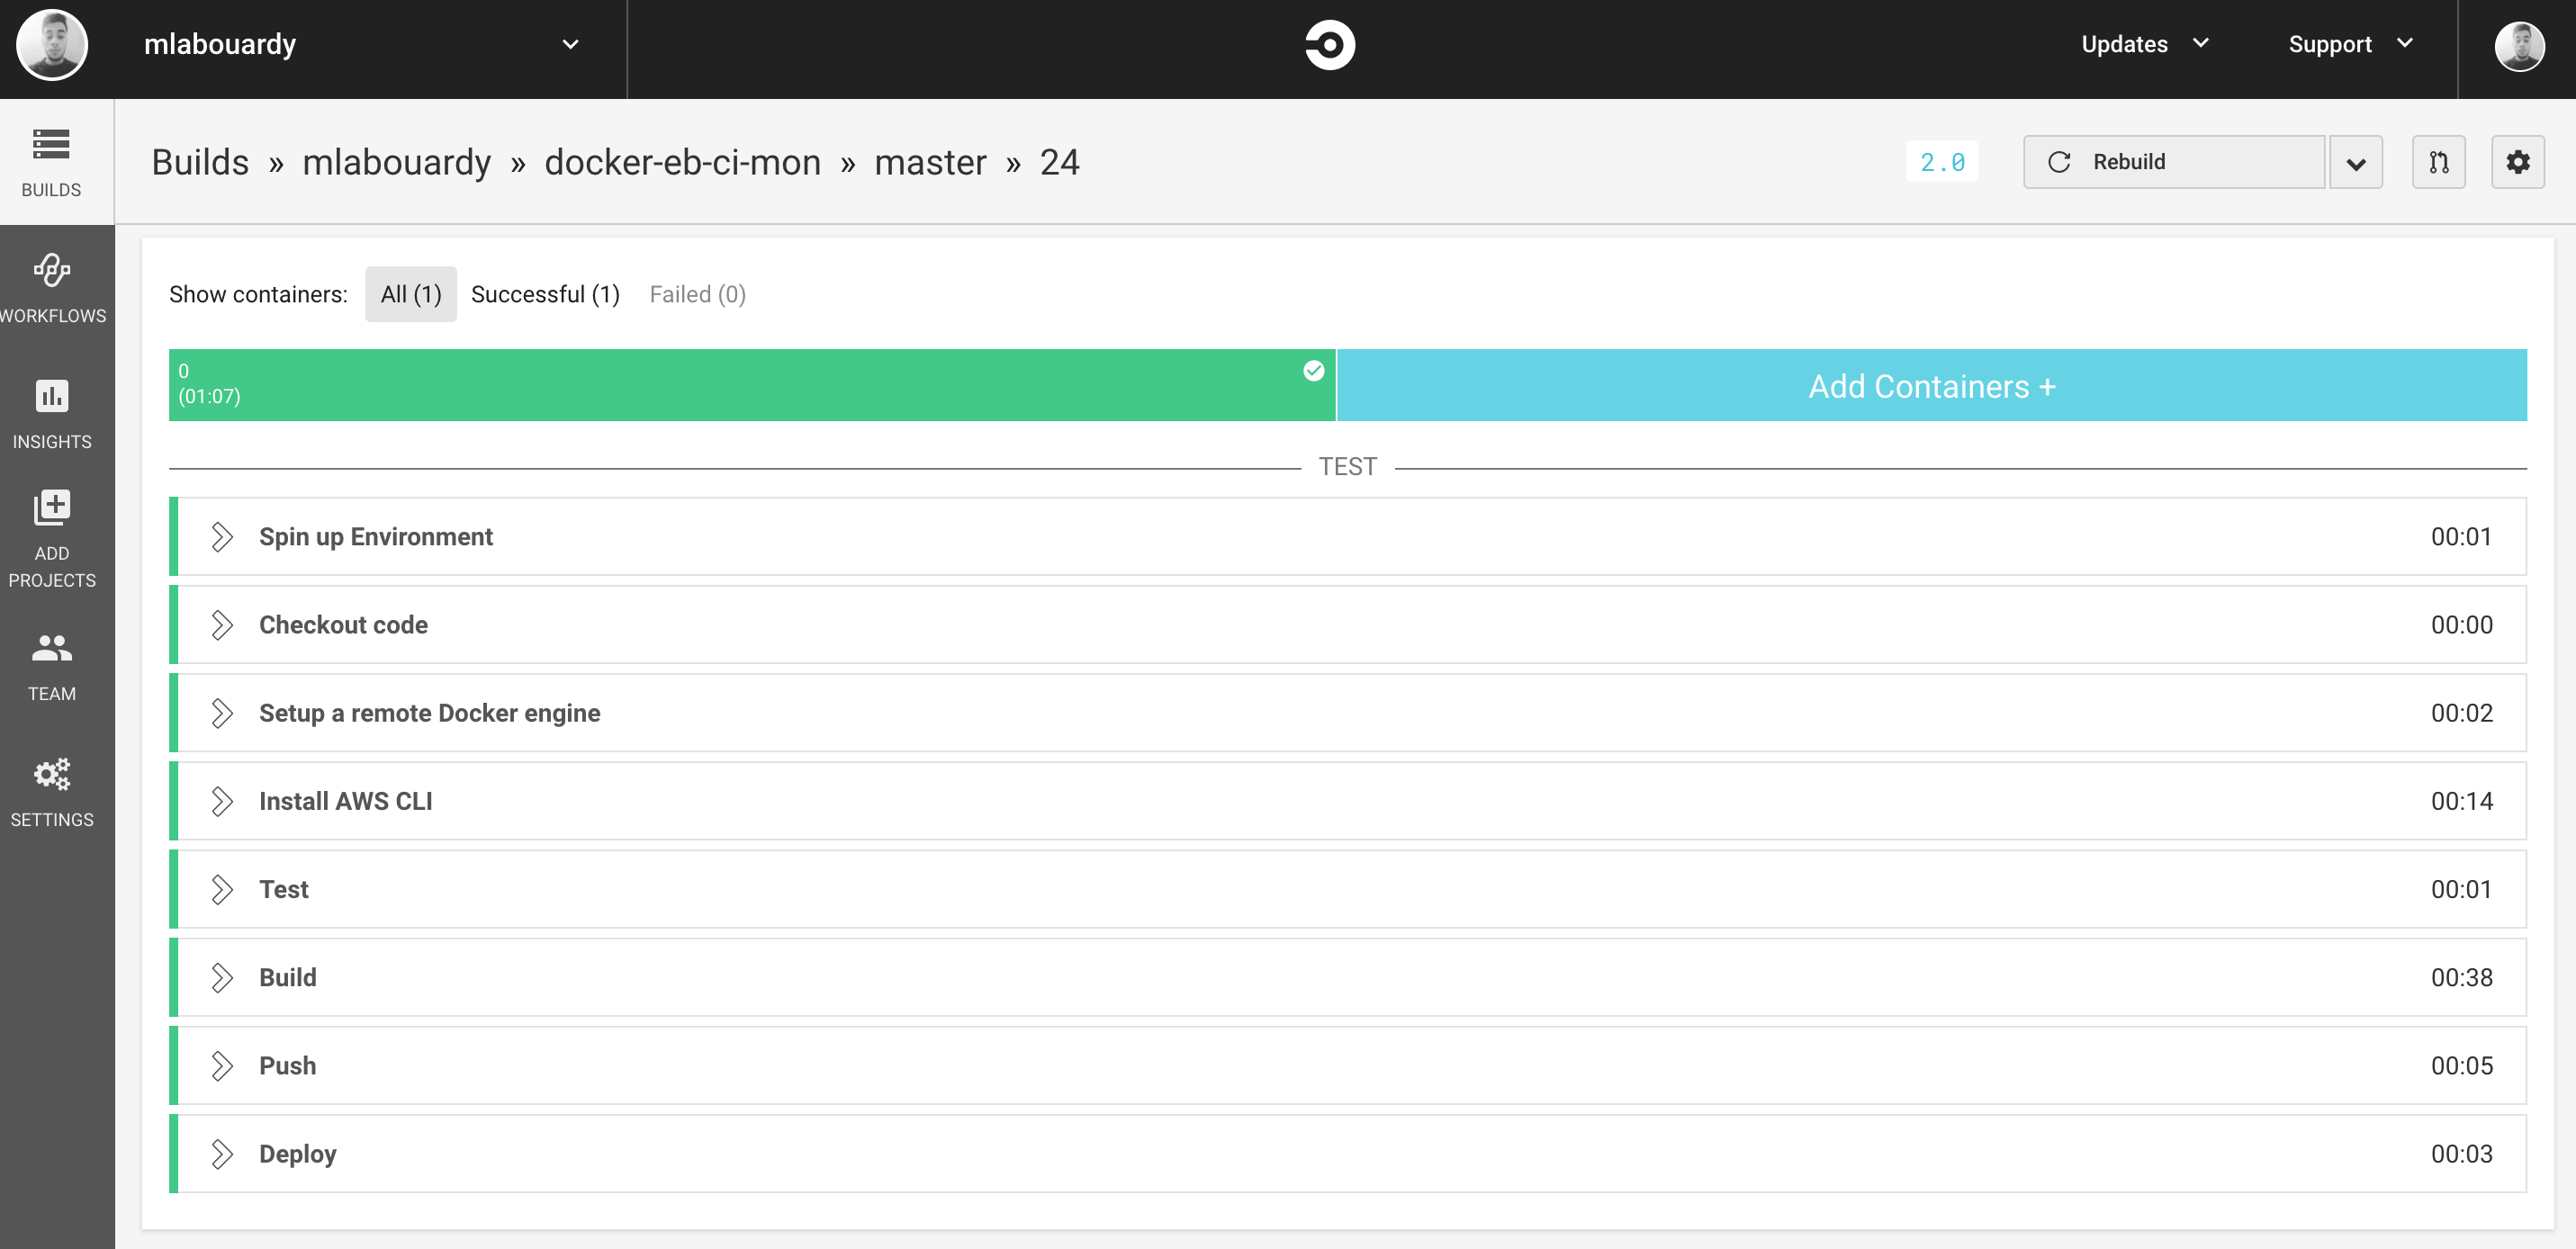
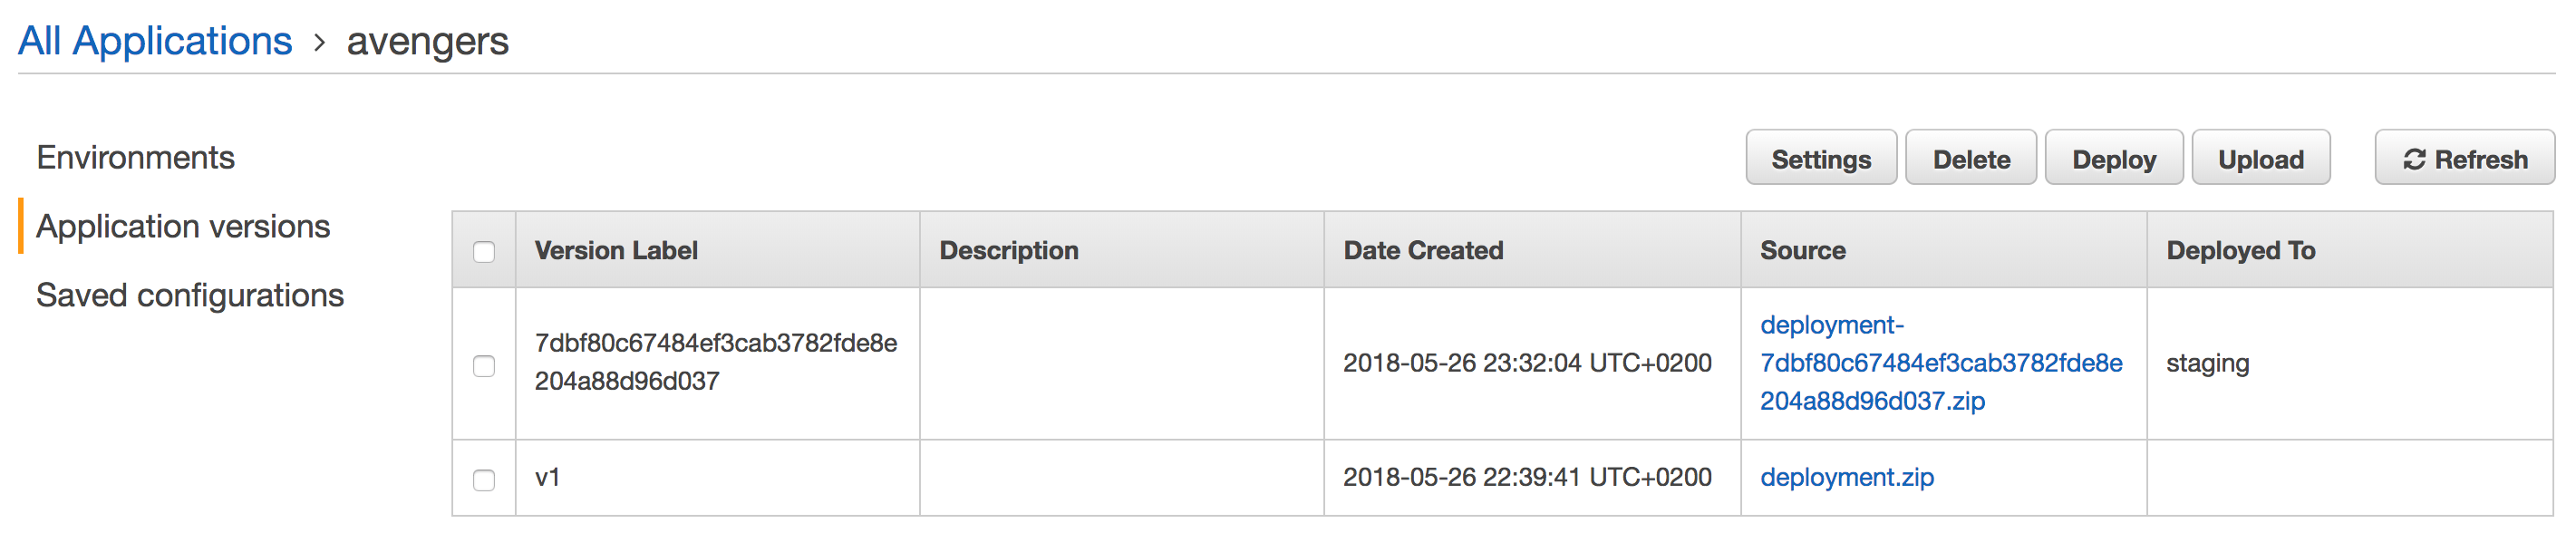
Now, everytime you push a change to your code repository, a build will be triggered:
And a new version will be deployed automatically to Elastic Beanstalk:
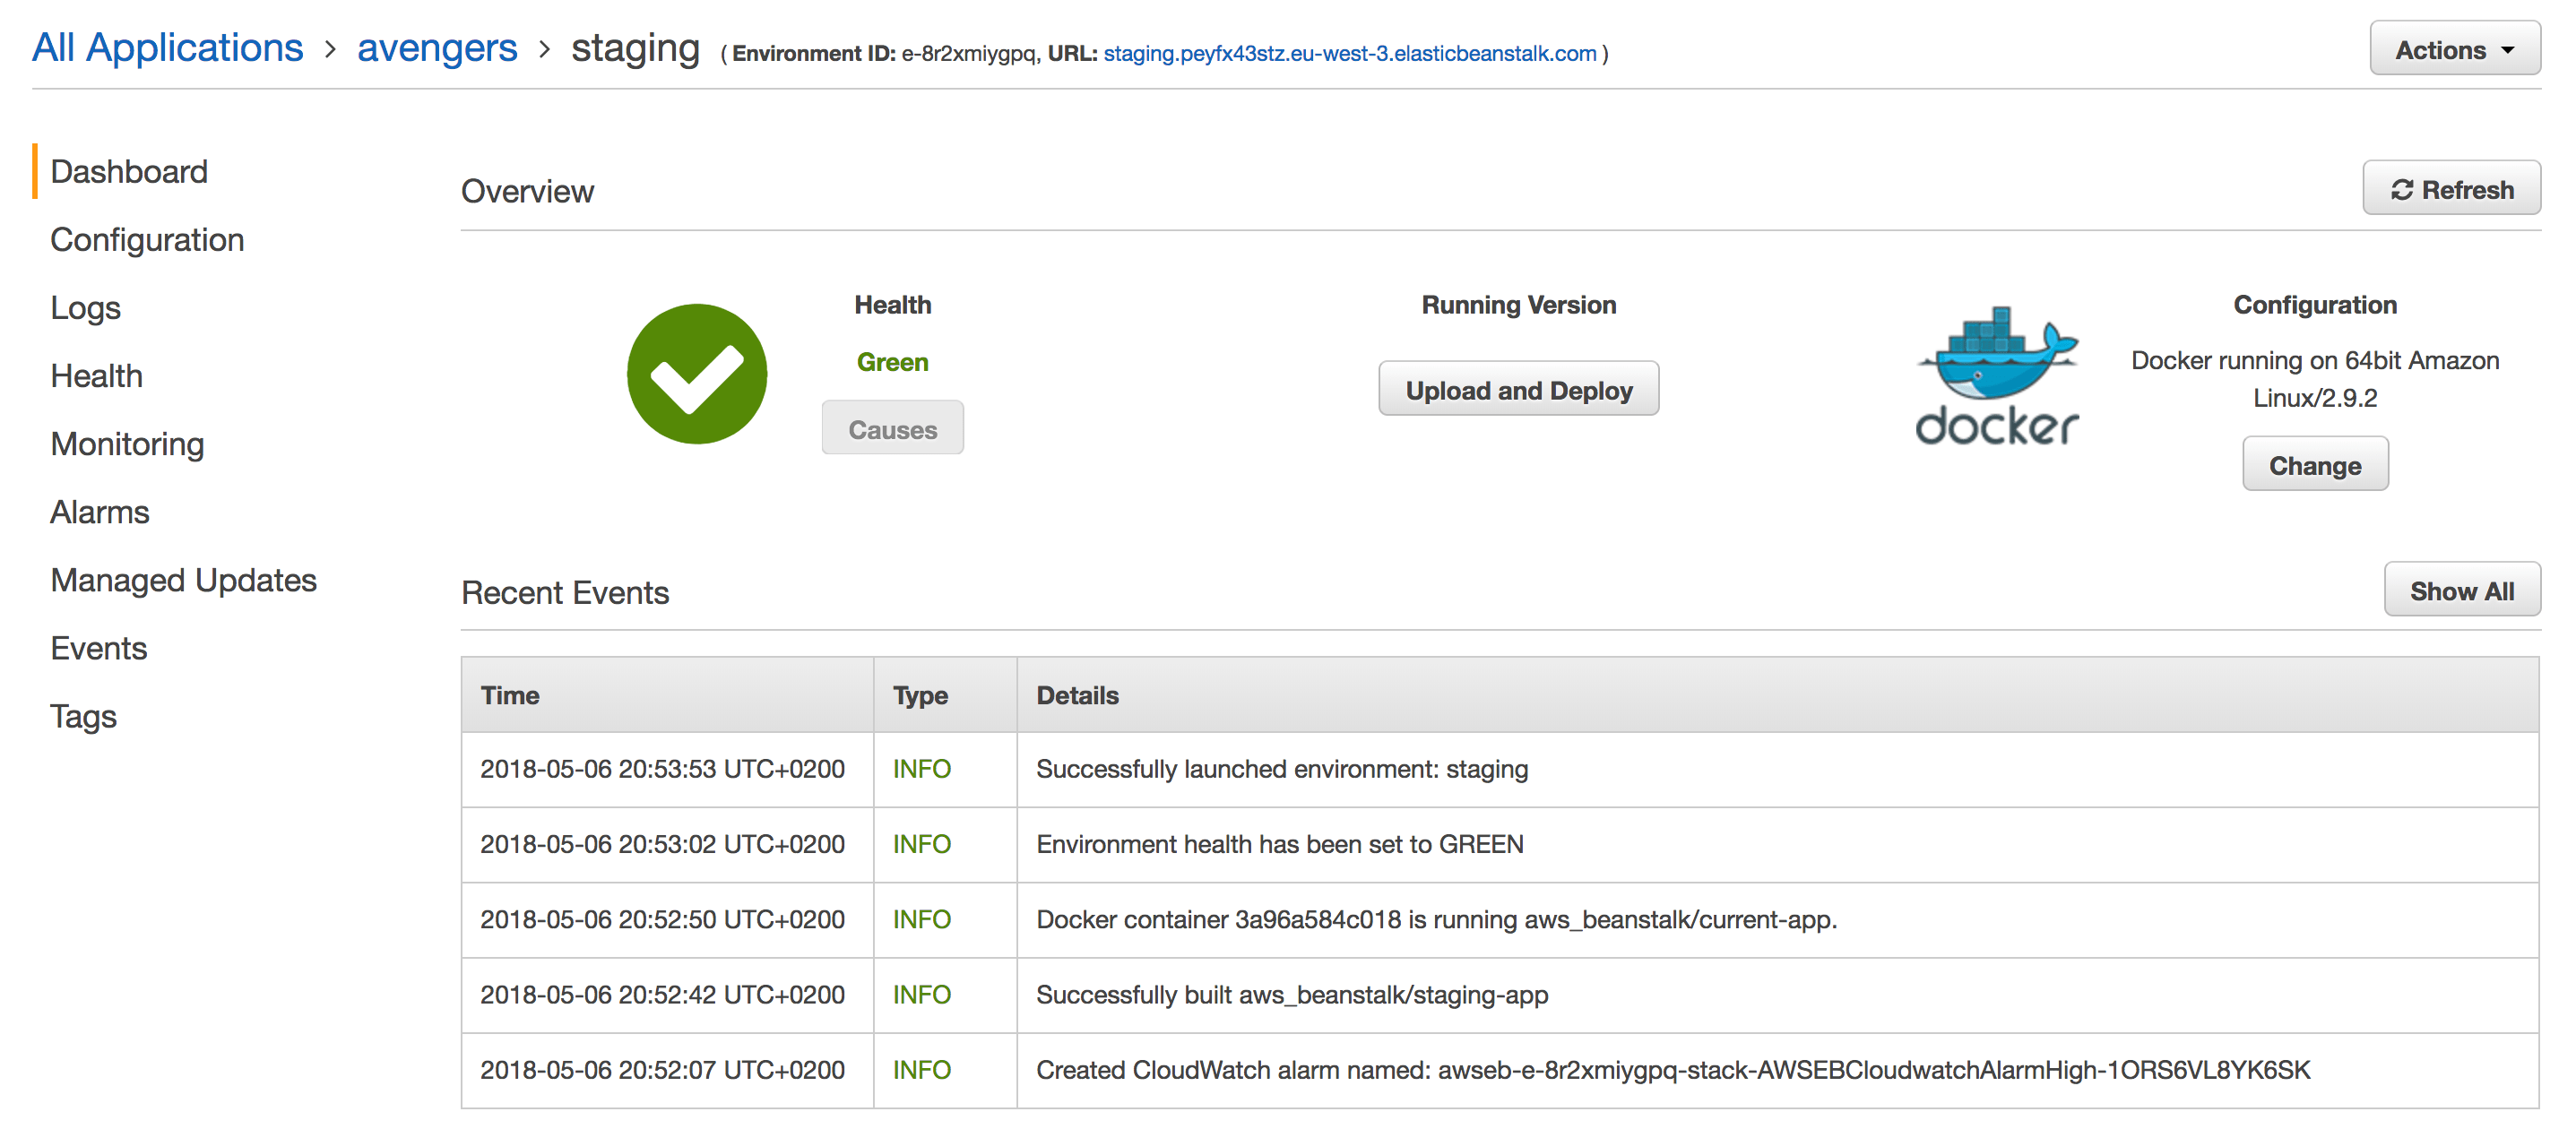
3 – Monitoring
Monitoring your applications is mandatory. Unfortunately, CloudWatch doesn’t expose useful metrics like Memory usage of your applications in Elastic Beanstalk. Hence, in this part, we will solve this issue by creating our custom metrics.
I will install a data collector agent on the instance. The agent will collect metrics and push them to a time-series database.
To install the agent, we will use .ebextensions folder, on which we will create 3 configuration files:
01-install-telegraf.config: install Telegraf on the instance
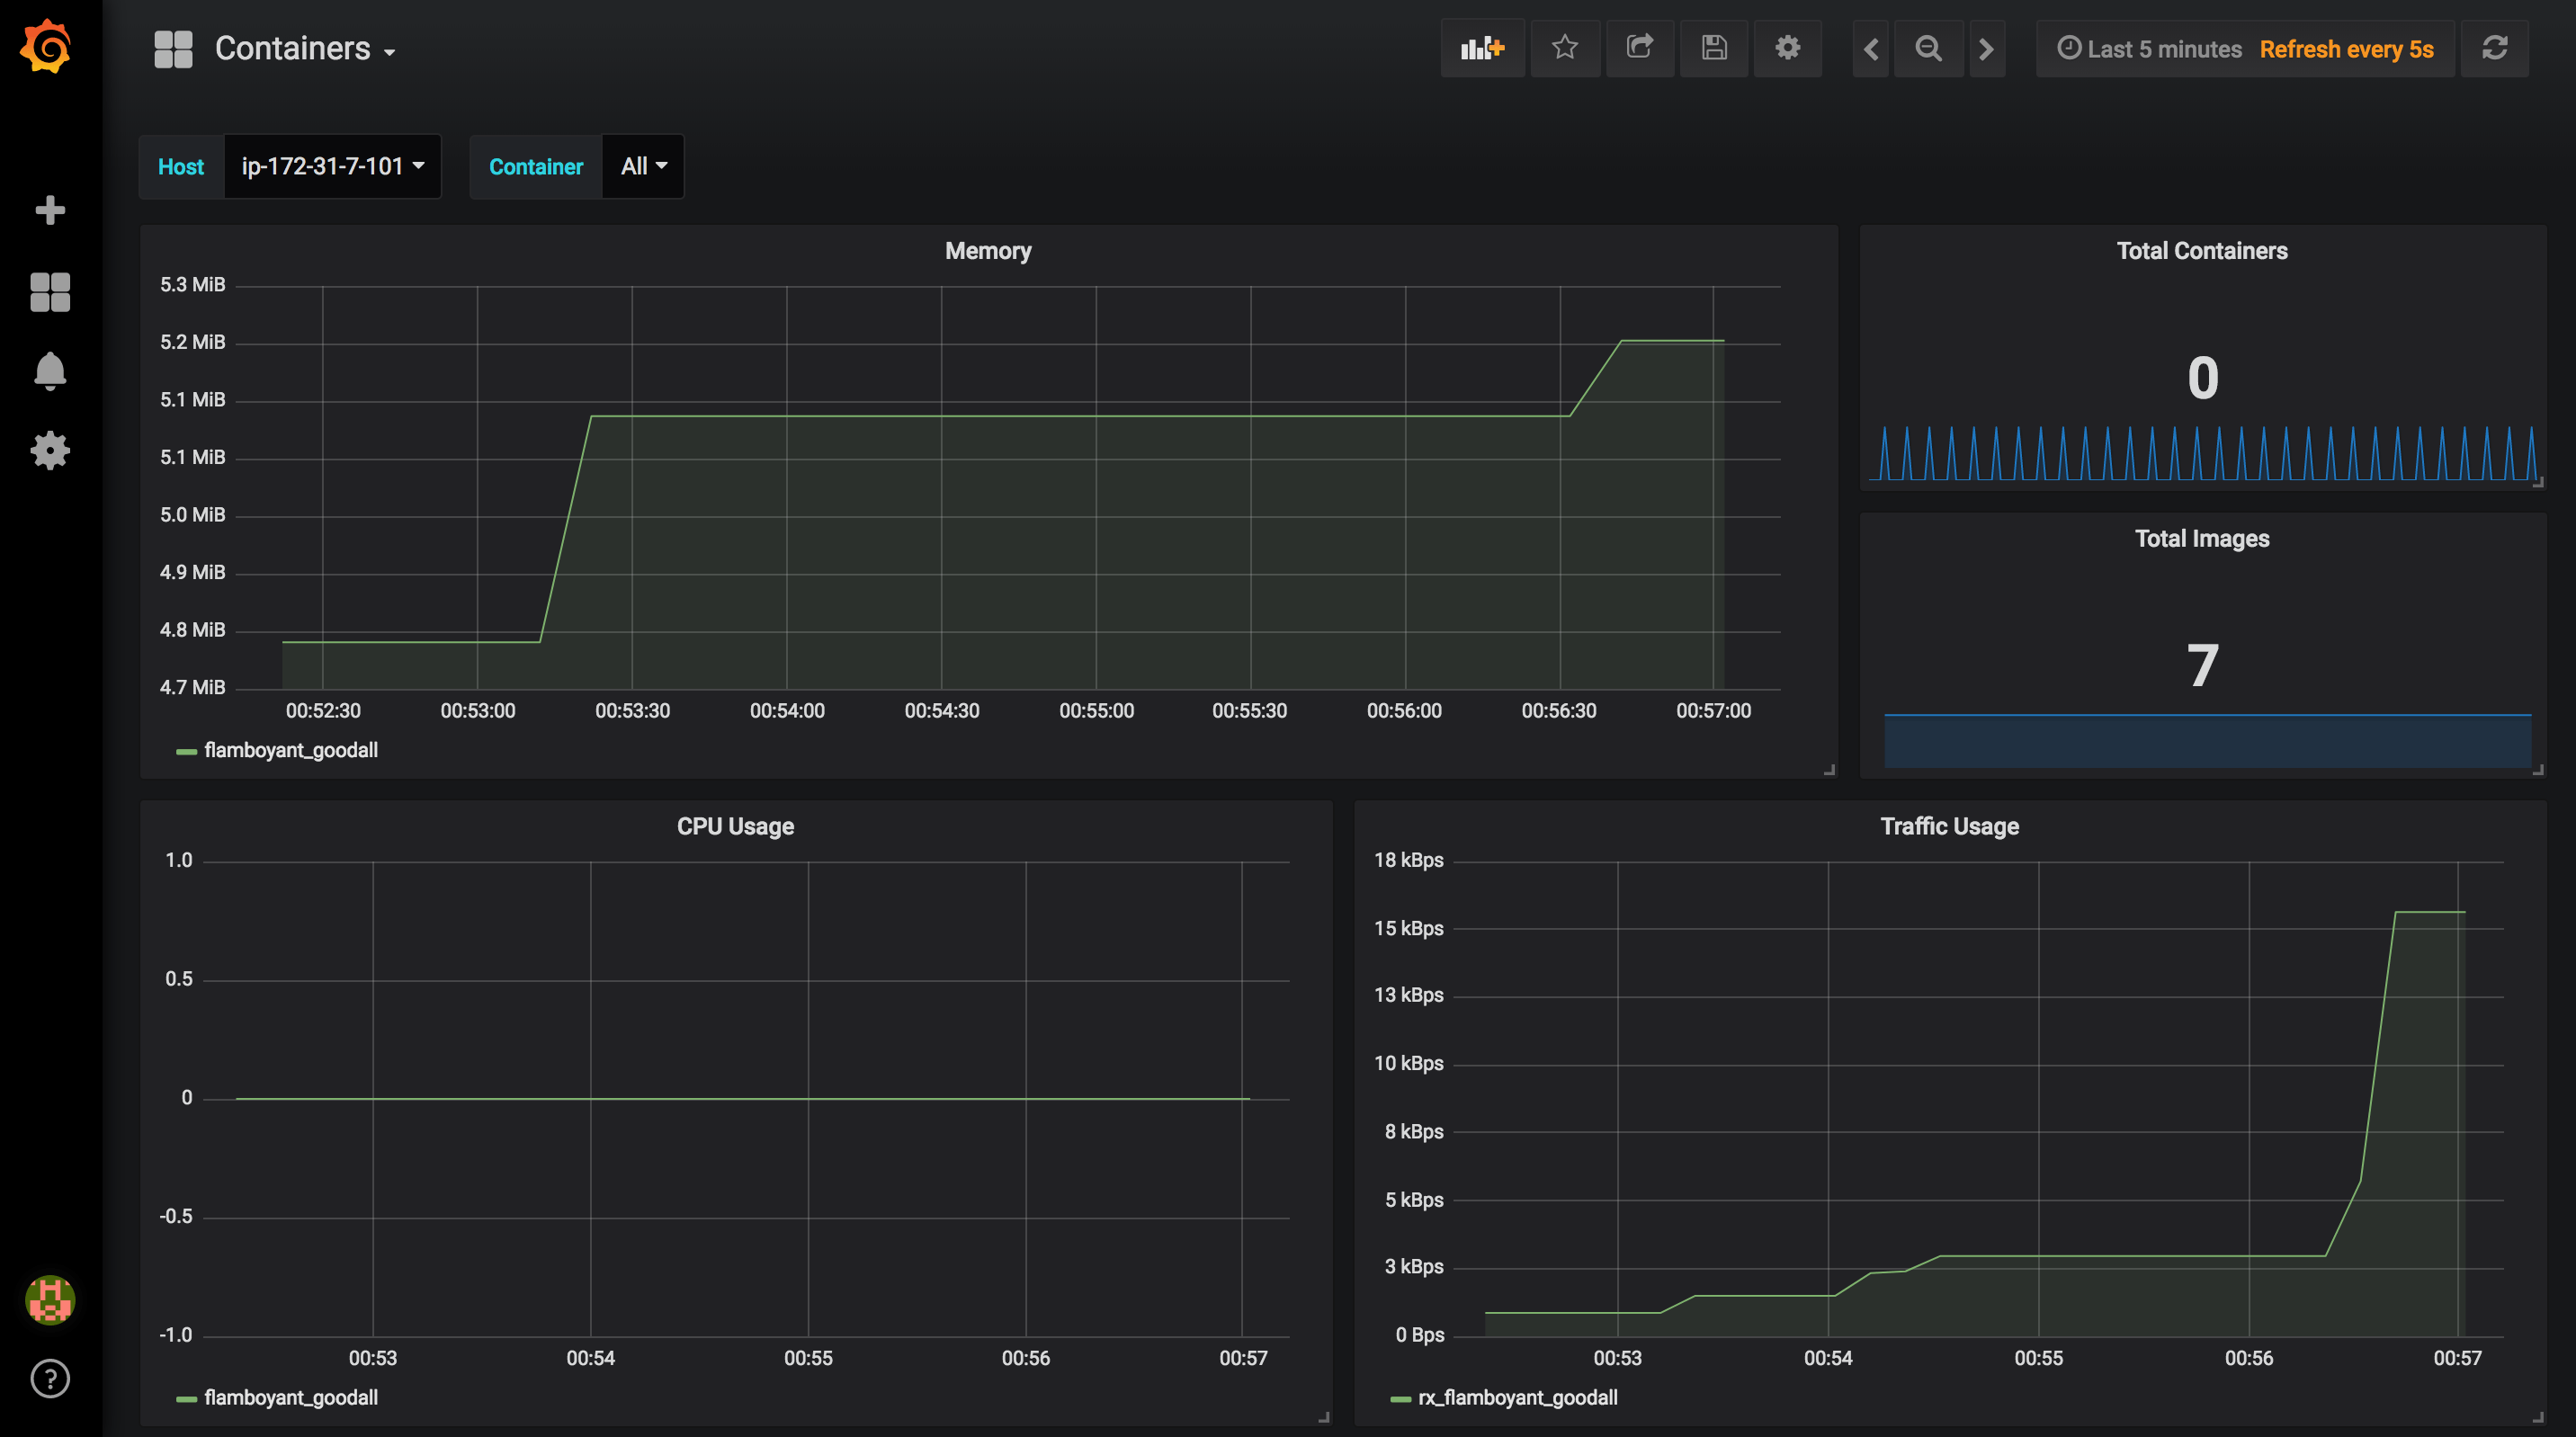
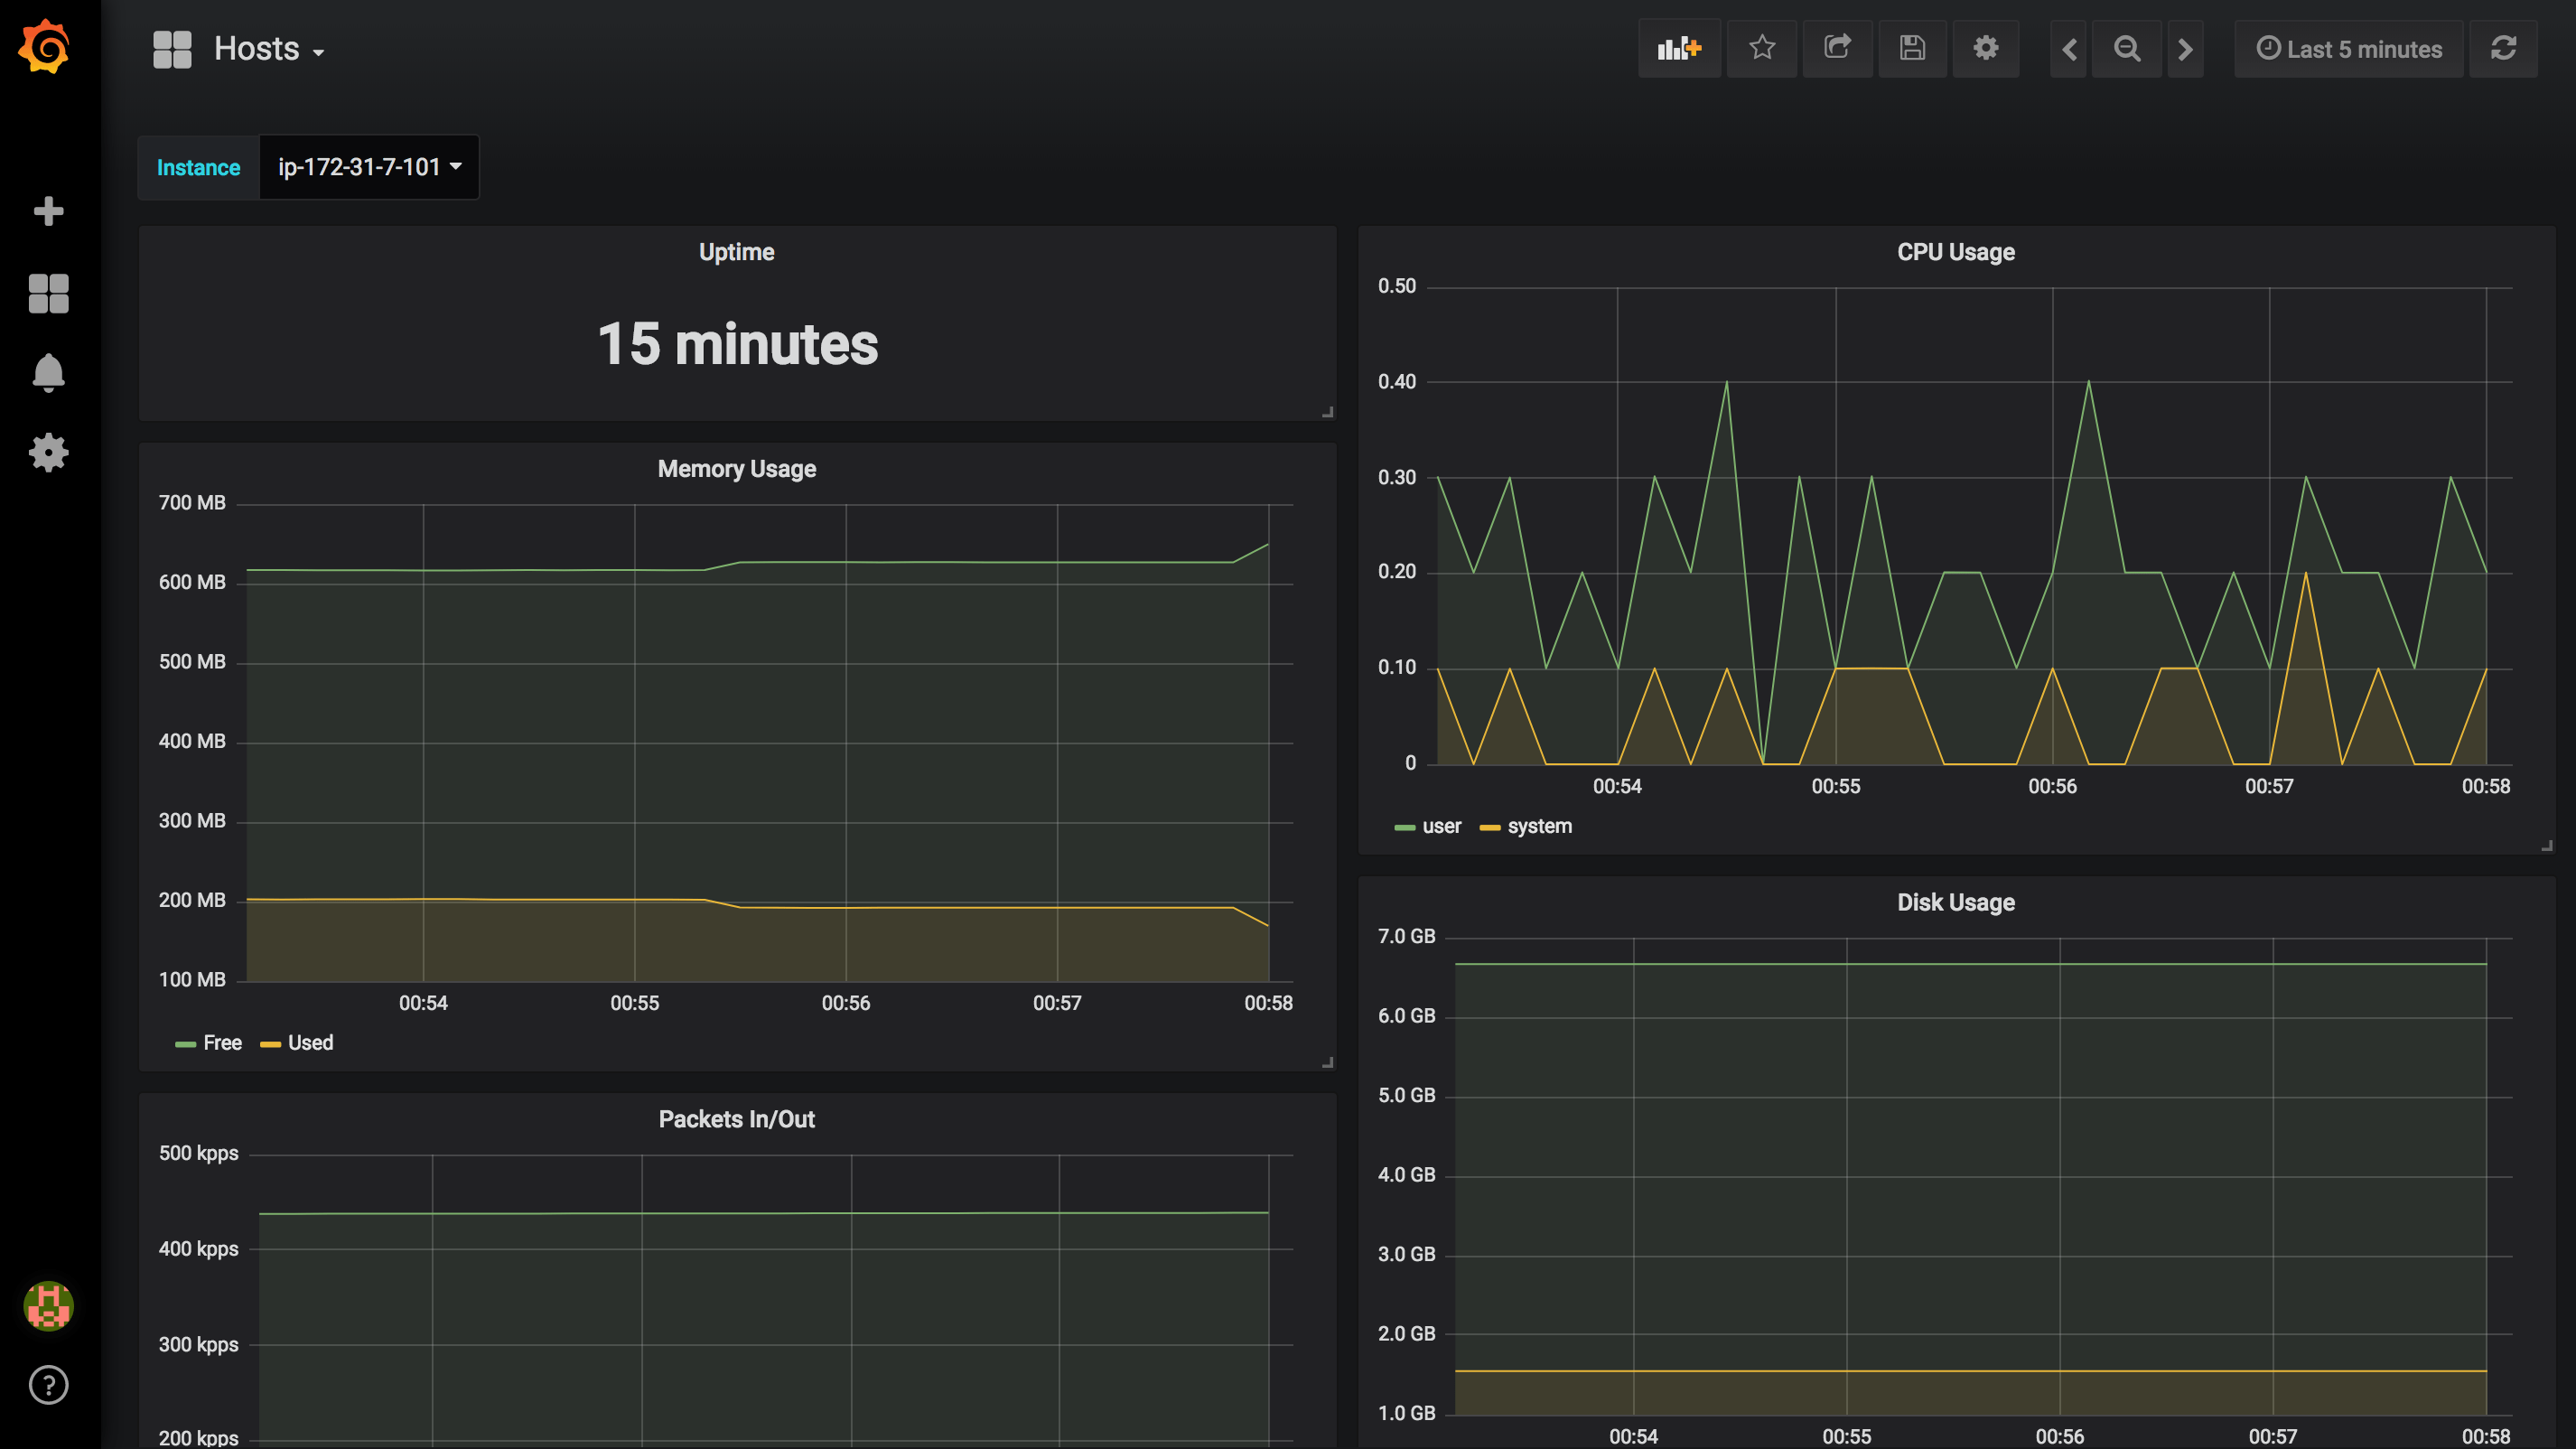
Once the application version is deployed to Elastic Beanstalk, metrics will be pushed to your timeseries database. In this example, I used InfluxDB as data storage and I created some dynamic Dashboards in Grafana to visualize metrics in real-time:
Containers:
Hosts:
Note: for in-depth explaination on how to configure Telegraf, InfluxDB & Grafana read my previous article.
Full code can be found on my GitHub. Make sure to drop your comments, feedback, or suggestions below — or connect with me directly on Twitter @mlabouardy
Having multiple environments is important to build a continuous integration/deployment pipeline and be able to reproduce bugs in production with ease but this comes at price. In order to reduce cost of AWS infrastructure, instances which are running 24/7 unnecessarily (sandbox & staging environments) must be shut down outside of regular business hours.
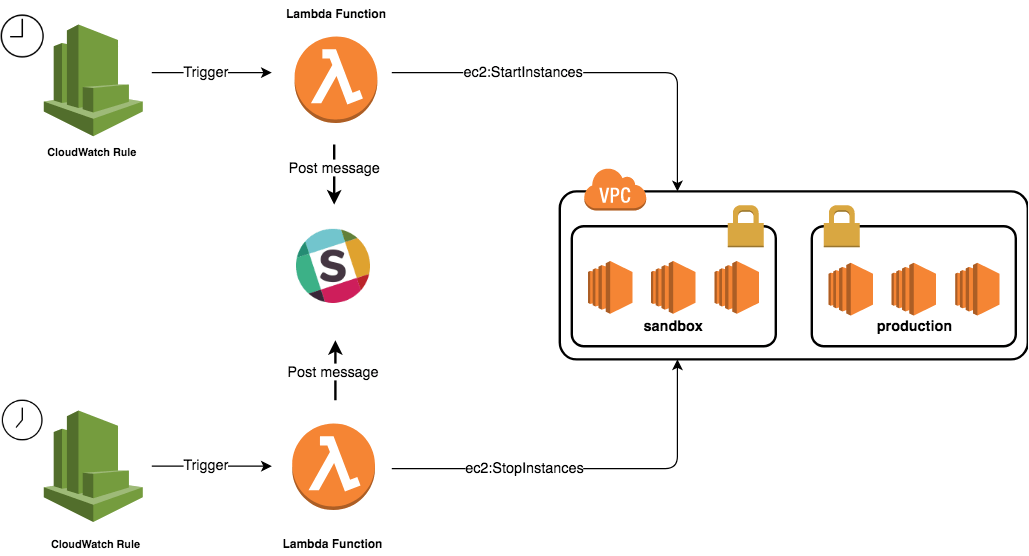
The figure below describes an automated process to schedule, stop and start instances to help cutting costs. The solution is a perfect example of using Serverless computing.
2 Lambda functions will be created, they will scan all environments looking for a specific tag. The tag we use is named ‘Environment’. Instances without an Environment tag will not be affected:
for _, reservation := range res.Reservations { for _, instance := range reservation.Instances { for _, tag := range instance.Tags { if *tag.Key == "Name" { instances = append(instances, Instance{ ID: *instance.InstanceId, Name: *tag.Value, }) } } } }
return instances, nil }
The StartEnvironment function will query the StartInstances method with the list of instance ids returned by the previous function:
Finally, create an IAM role for each function and attach the above policies:
1 2 3 4 5 6 7 8 9 10 11 12 13
#!/bin/bash
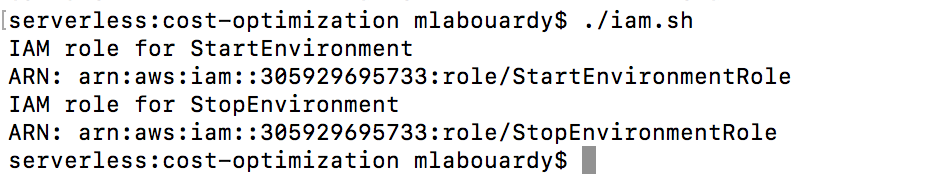
echo "IAM role for StartEnvironment" arn=$(aws iam create-policy --policy-name StartEnvironment --policy-document file://start/policy.json | jq -r '.Policy.Arn') result=$(aws iam create-role --role-name StartEnvironmentRole --assume-role-policy-document file://role.json | jq -r '.Role.Arn') aws iam attach-role-policy --role-name StartEnvironmentRole --policy-arn $arn echo "ARN: $result"
echo "IAM role for StopEnvironment" arn=$(aws iam create-policy --policy-name StopEnvironment --policy-document file://stop/policy.json | jq -r '.Policy.Arn') result=$(aws iam create-role --role-name StopEnvironmentRole --assume-role-policy-document file://role.json | jq -r '.Role.Arn') aws iam attach-role-policy --role-name StopEnvironmentRole --policy-arn $arn echo "ARN: $result"
The script will output the ARN for each IAM role:
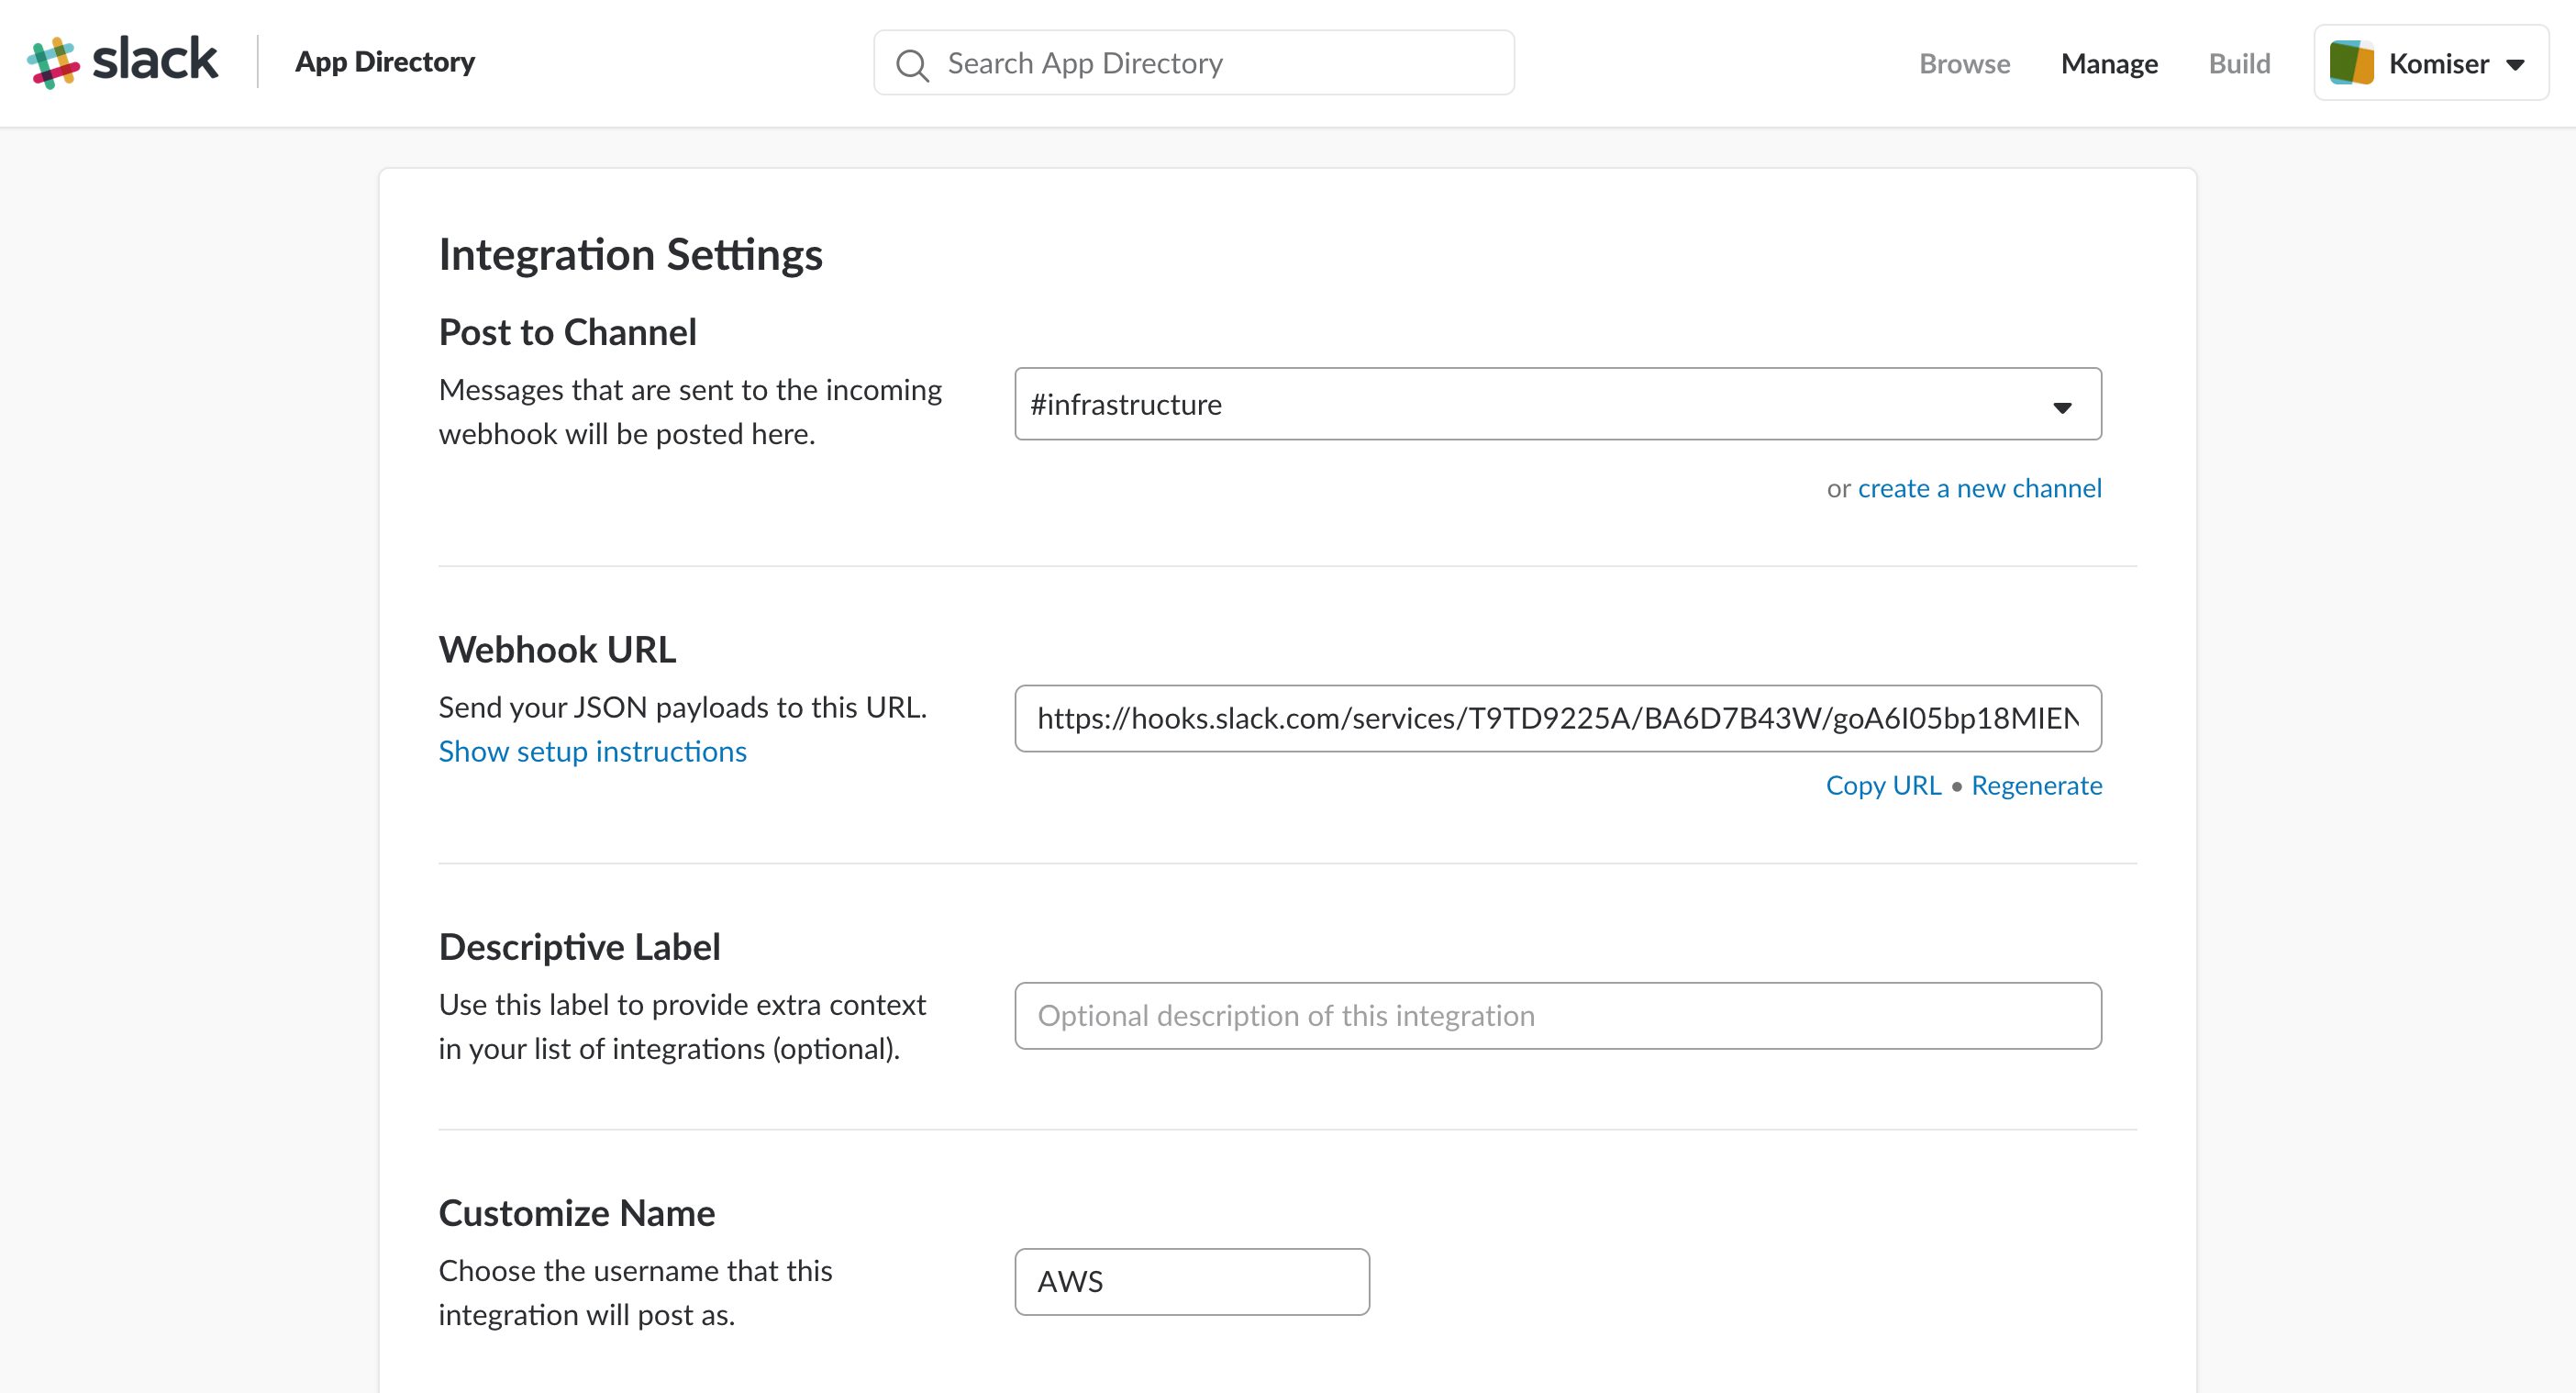
Before jumping to deployment part, we need to create a Slack WebHook to be able to post messages to Slack channel:
Next, use the following script to deploy your functions to AWS Lambda (make sure to replace the IAM roles, Slack WebHook token & the target environment):
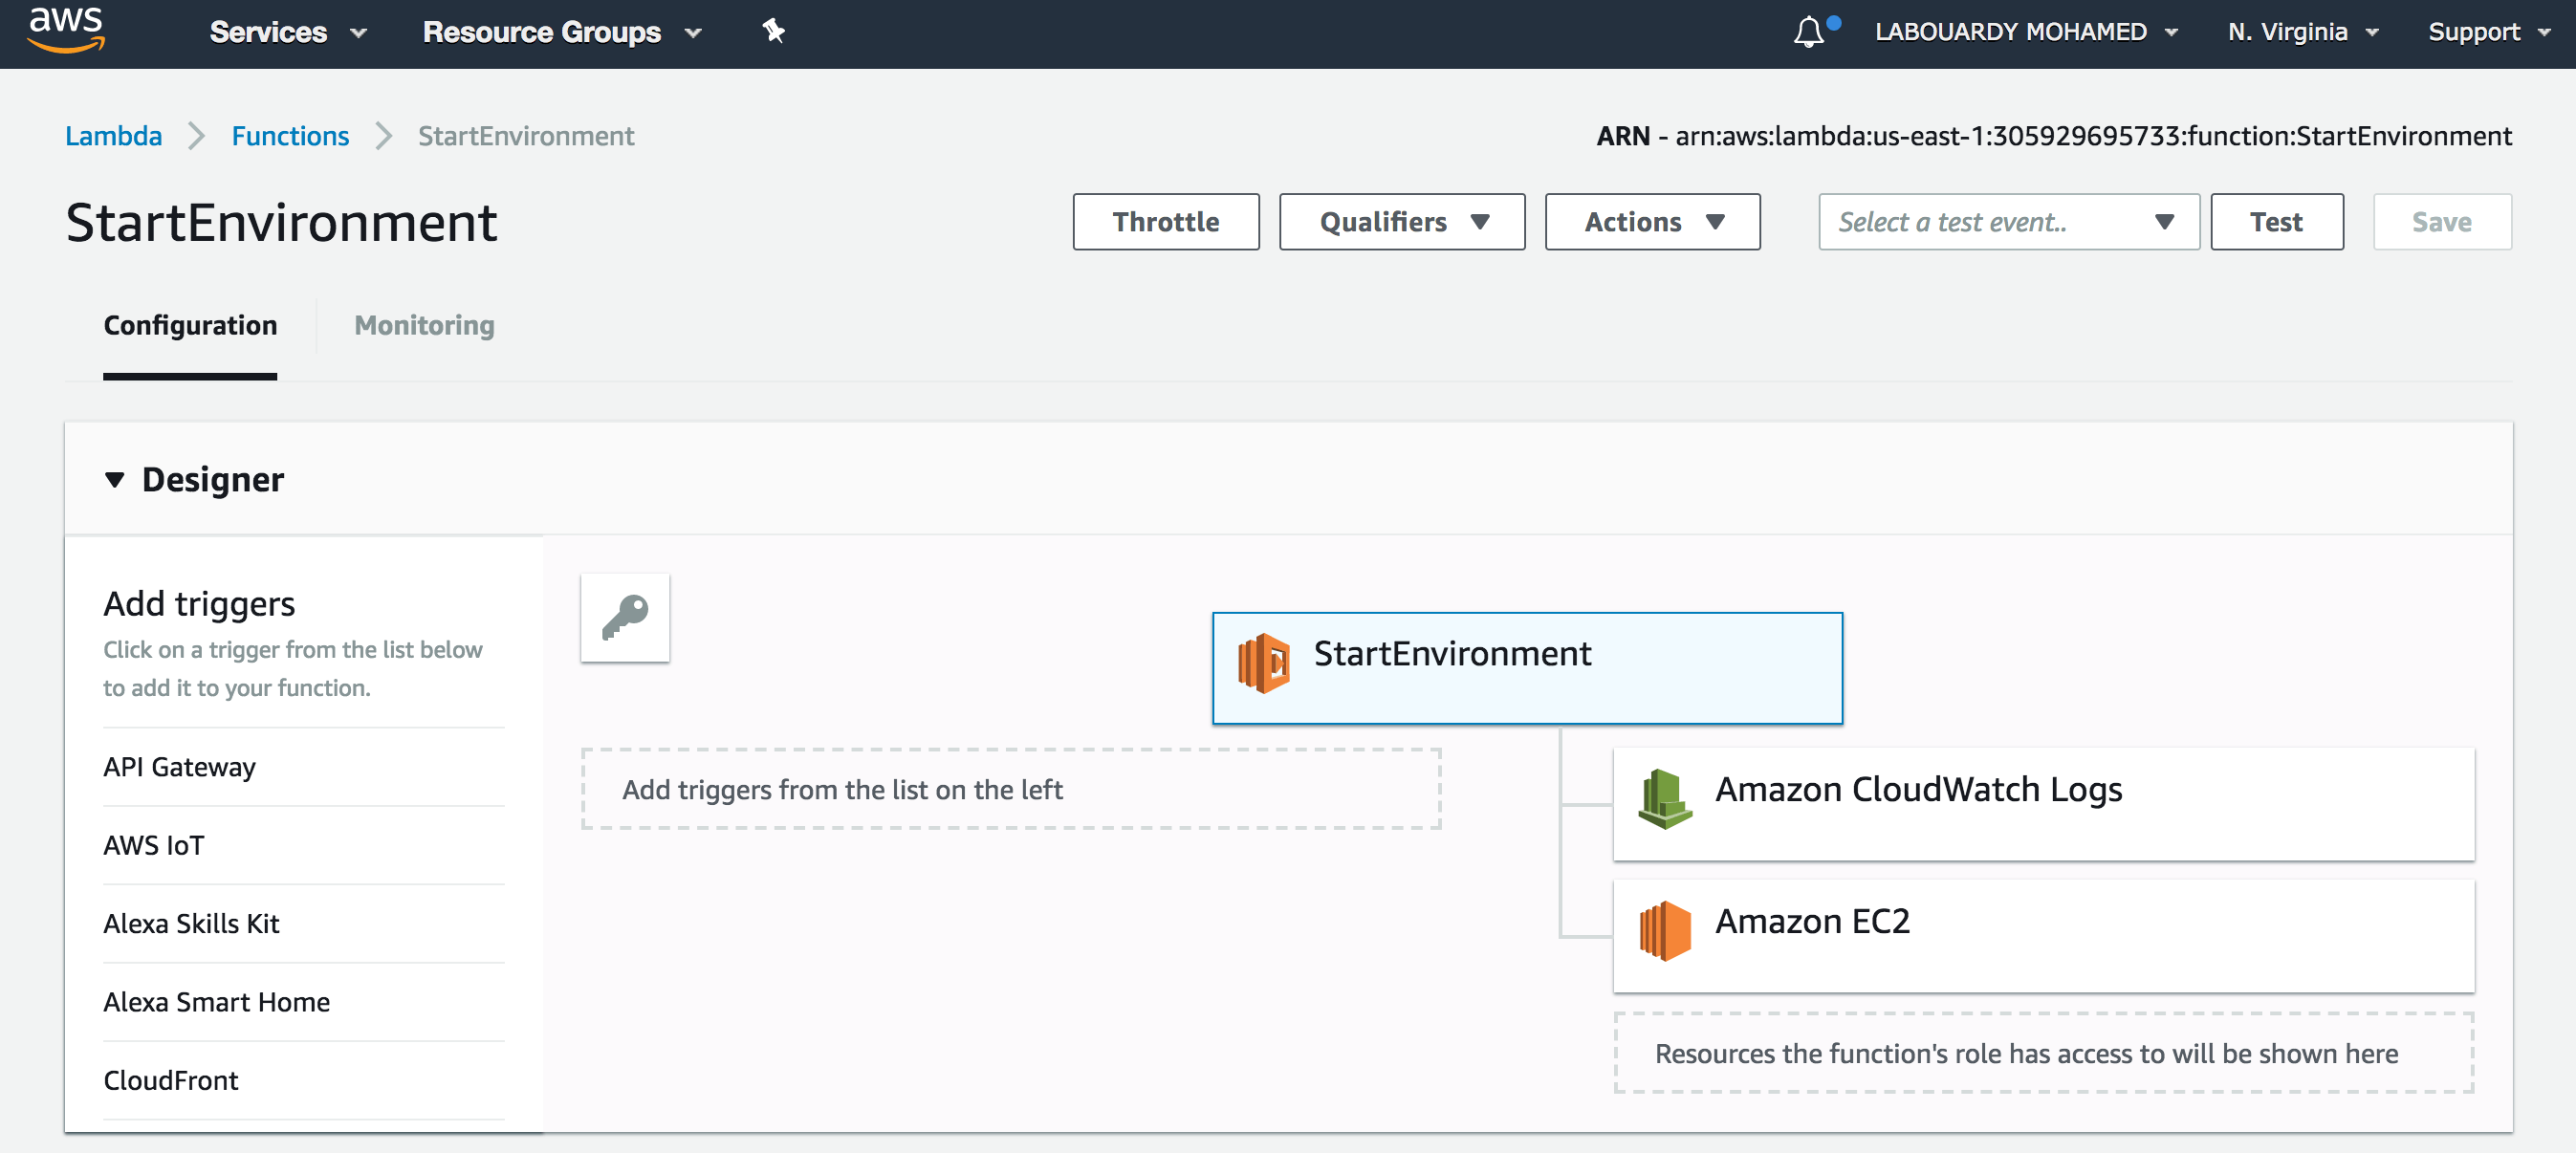
Once deployed, if you sign in to AWS Management Console, navigate to Lambda Console, you should see both functions has been deployed successfully:
StartEnvironment:
StopEnvironment:
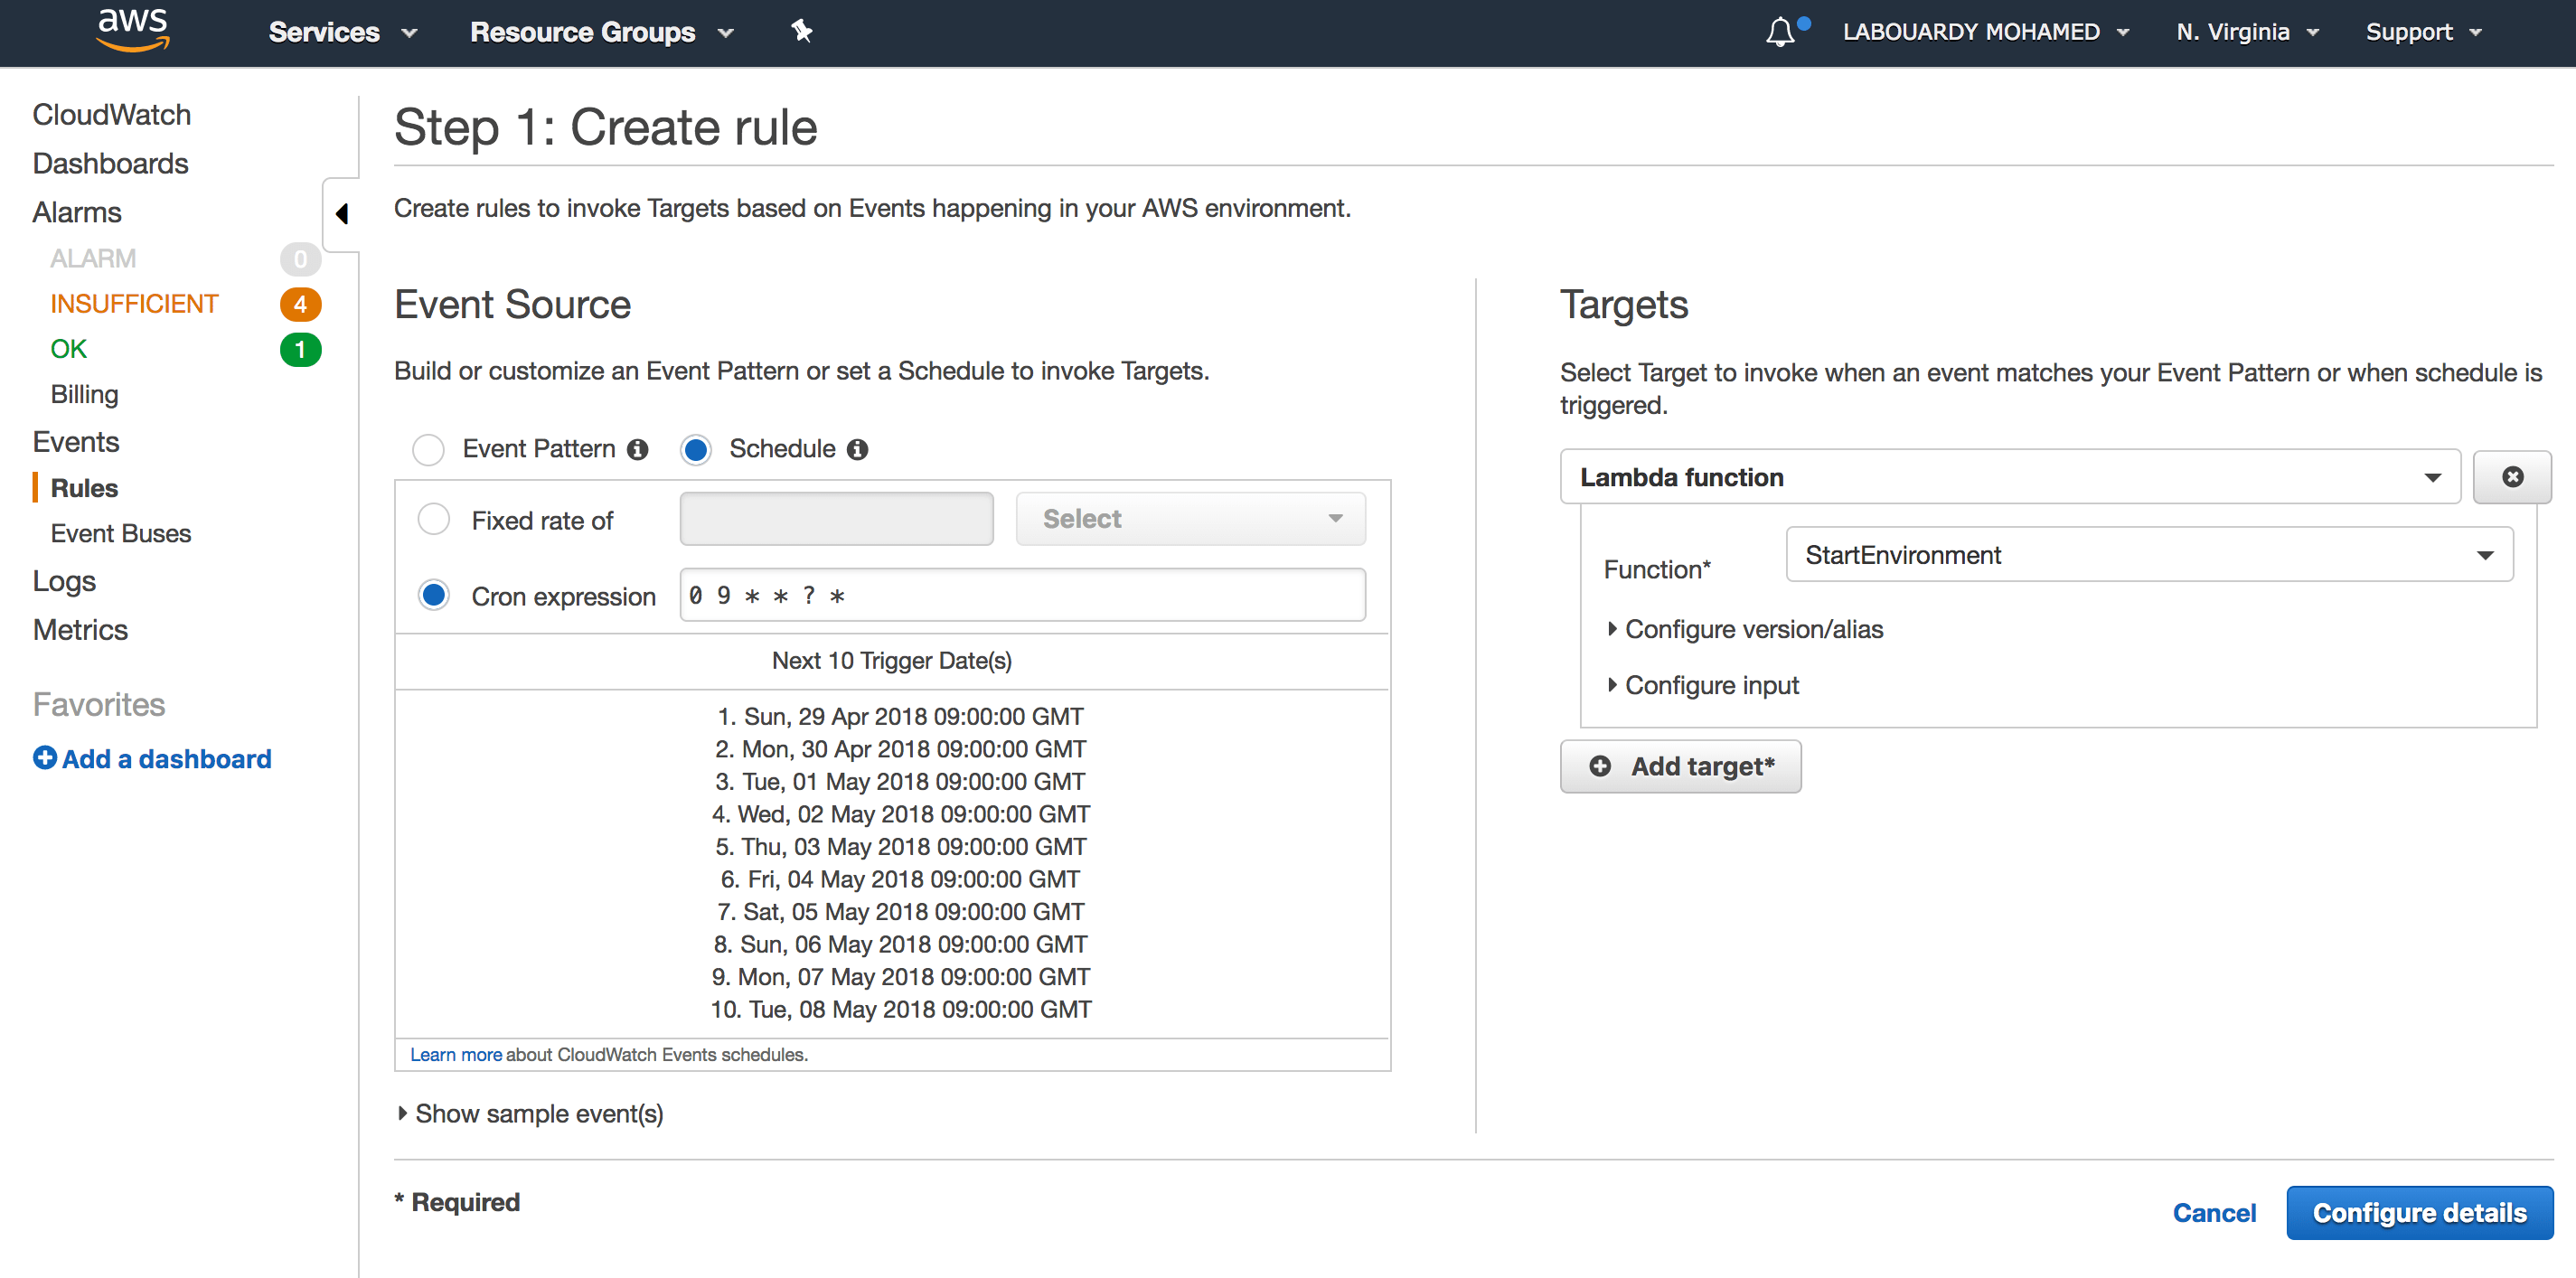
To further automate the process of invoking the Lambda function at the right time. AWS CloudWatch Scheduled Events will be used.
Create a new CloudWatch rule with the below cron expression (It will be invoked everyday at 9 AM):
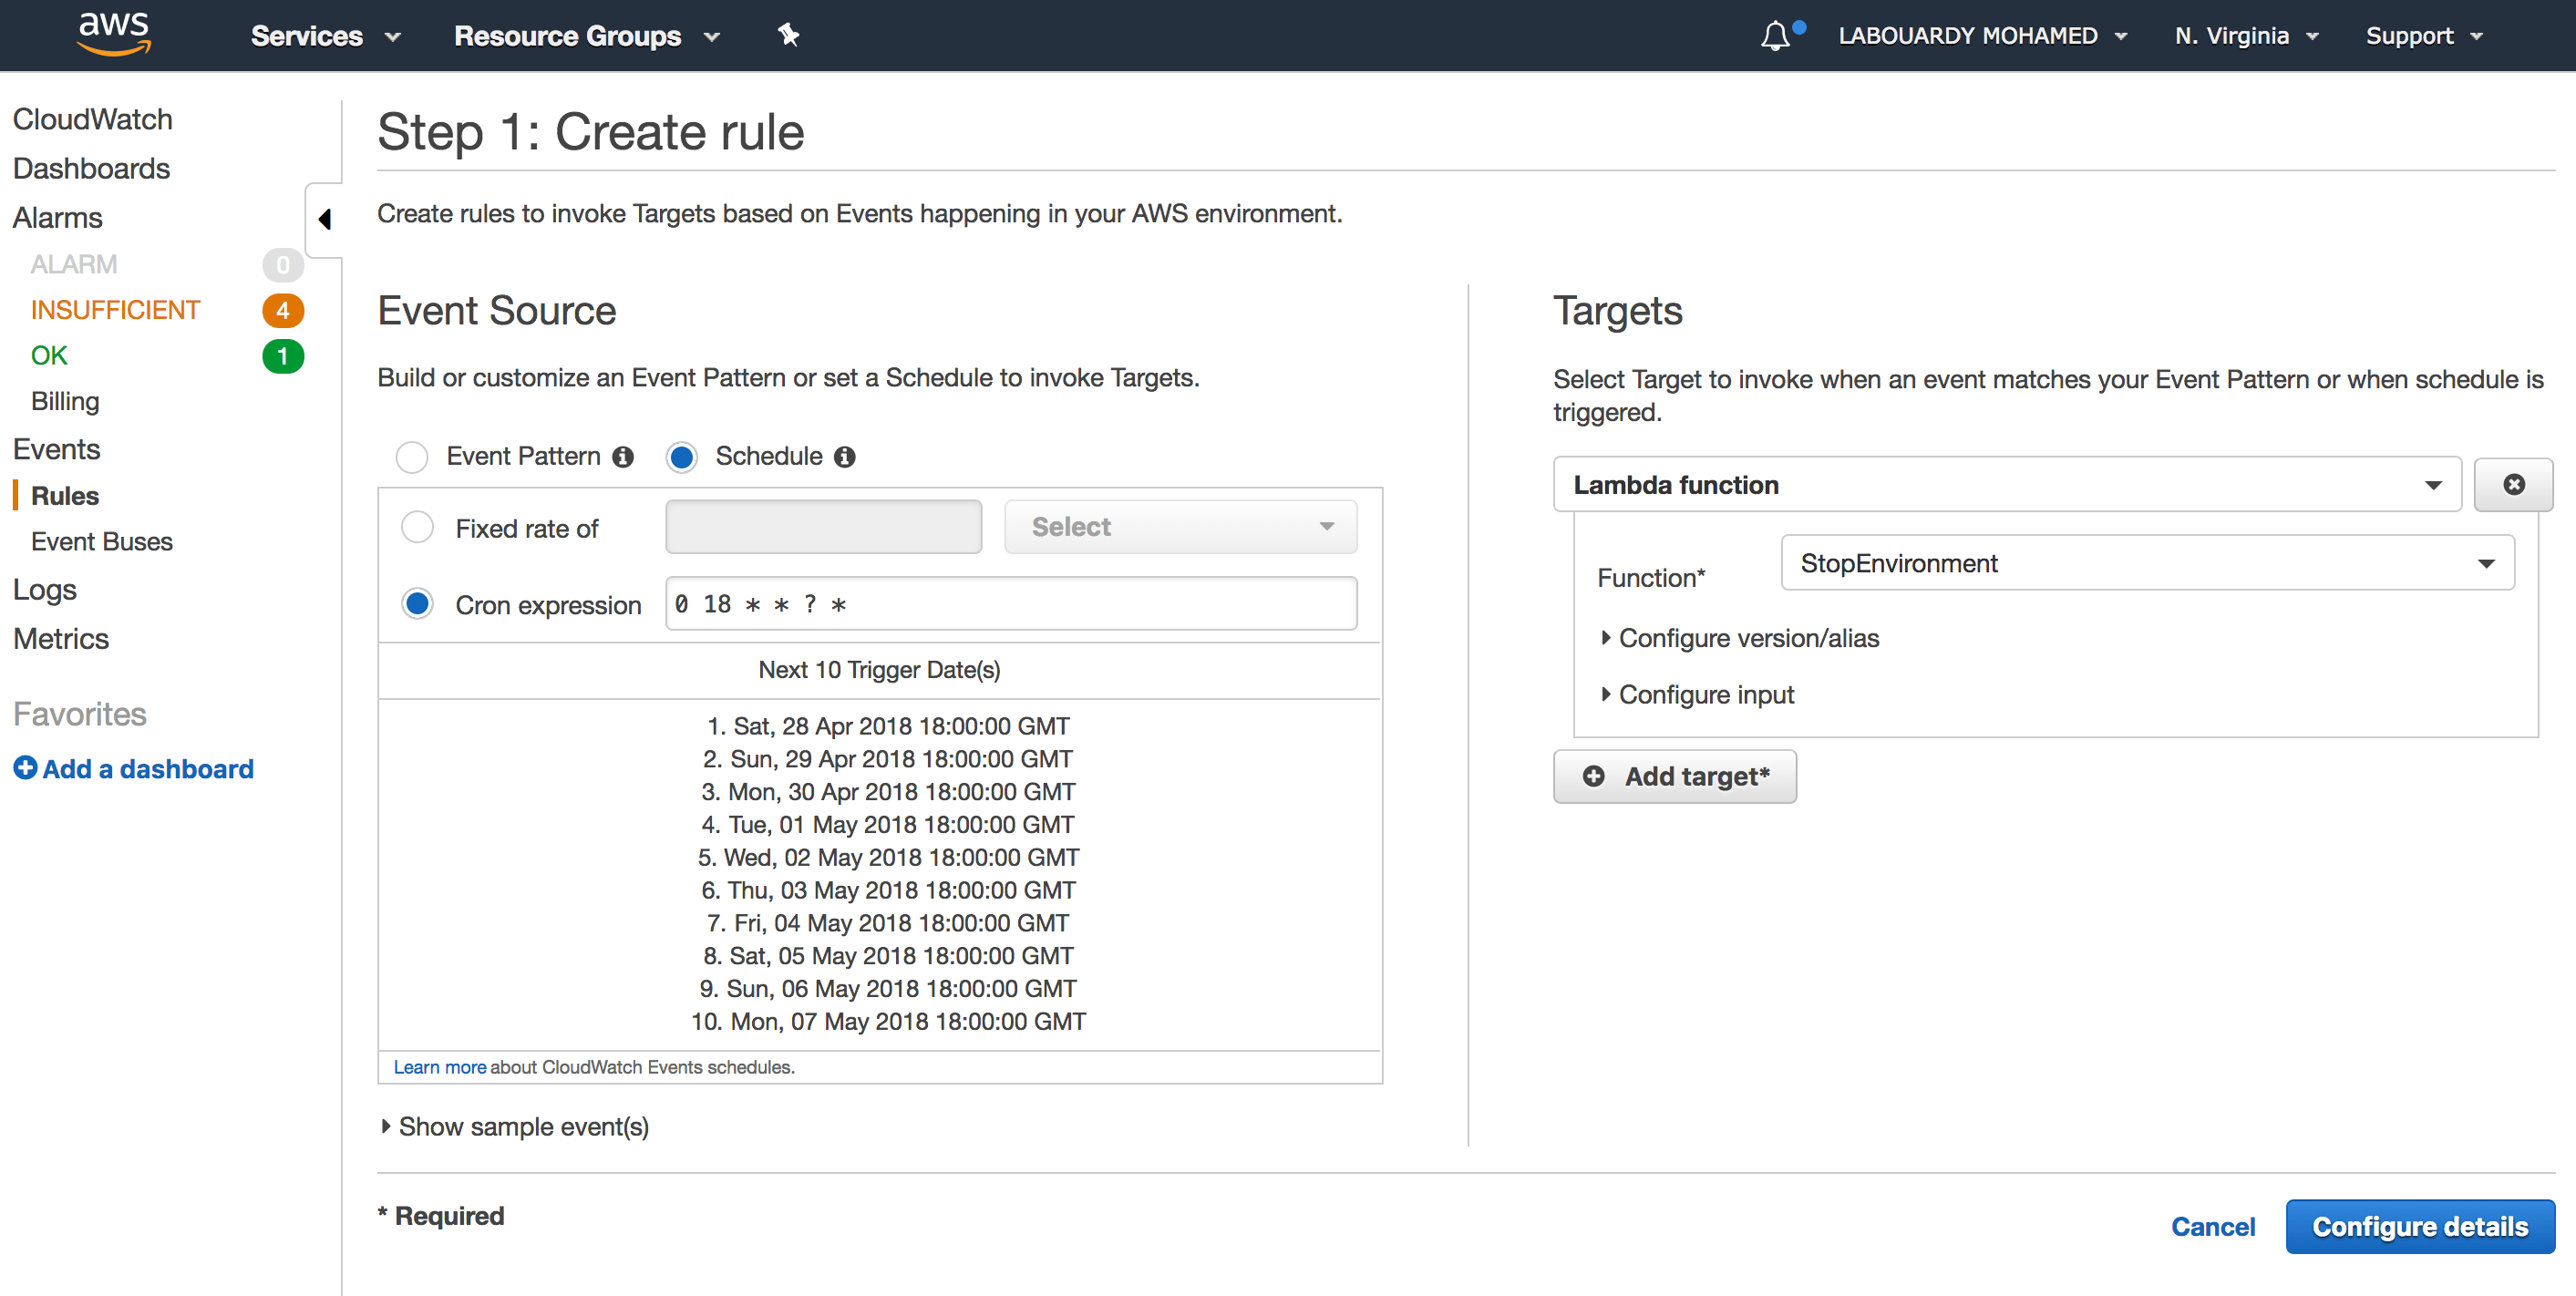
And another rule to stop the environment at 6 PM:
Note: All times are GMT time.
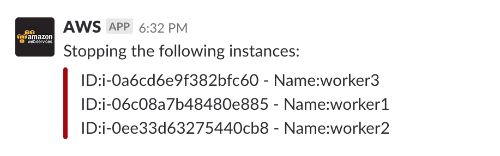
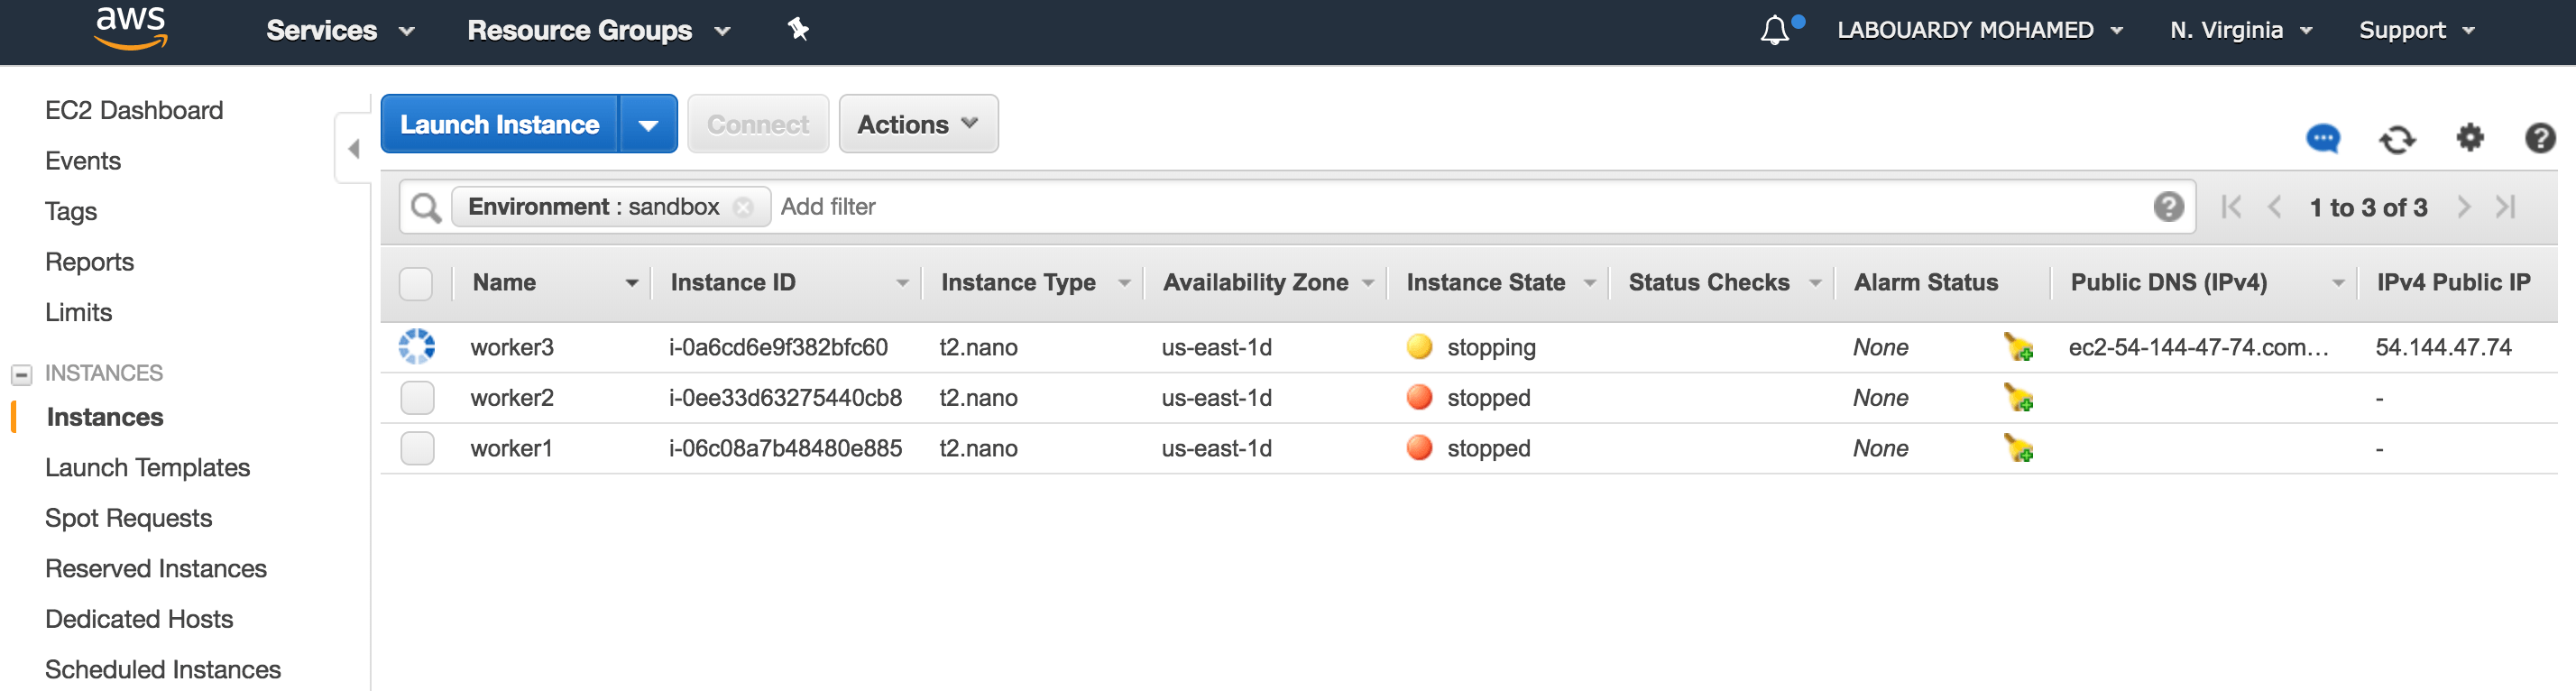
Testing:
a – Stop Environment
Result:
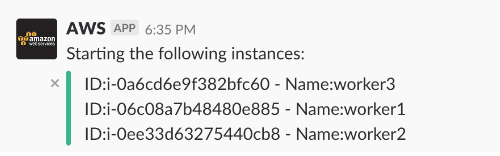
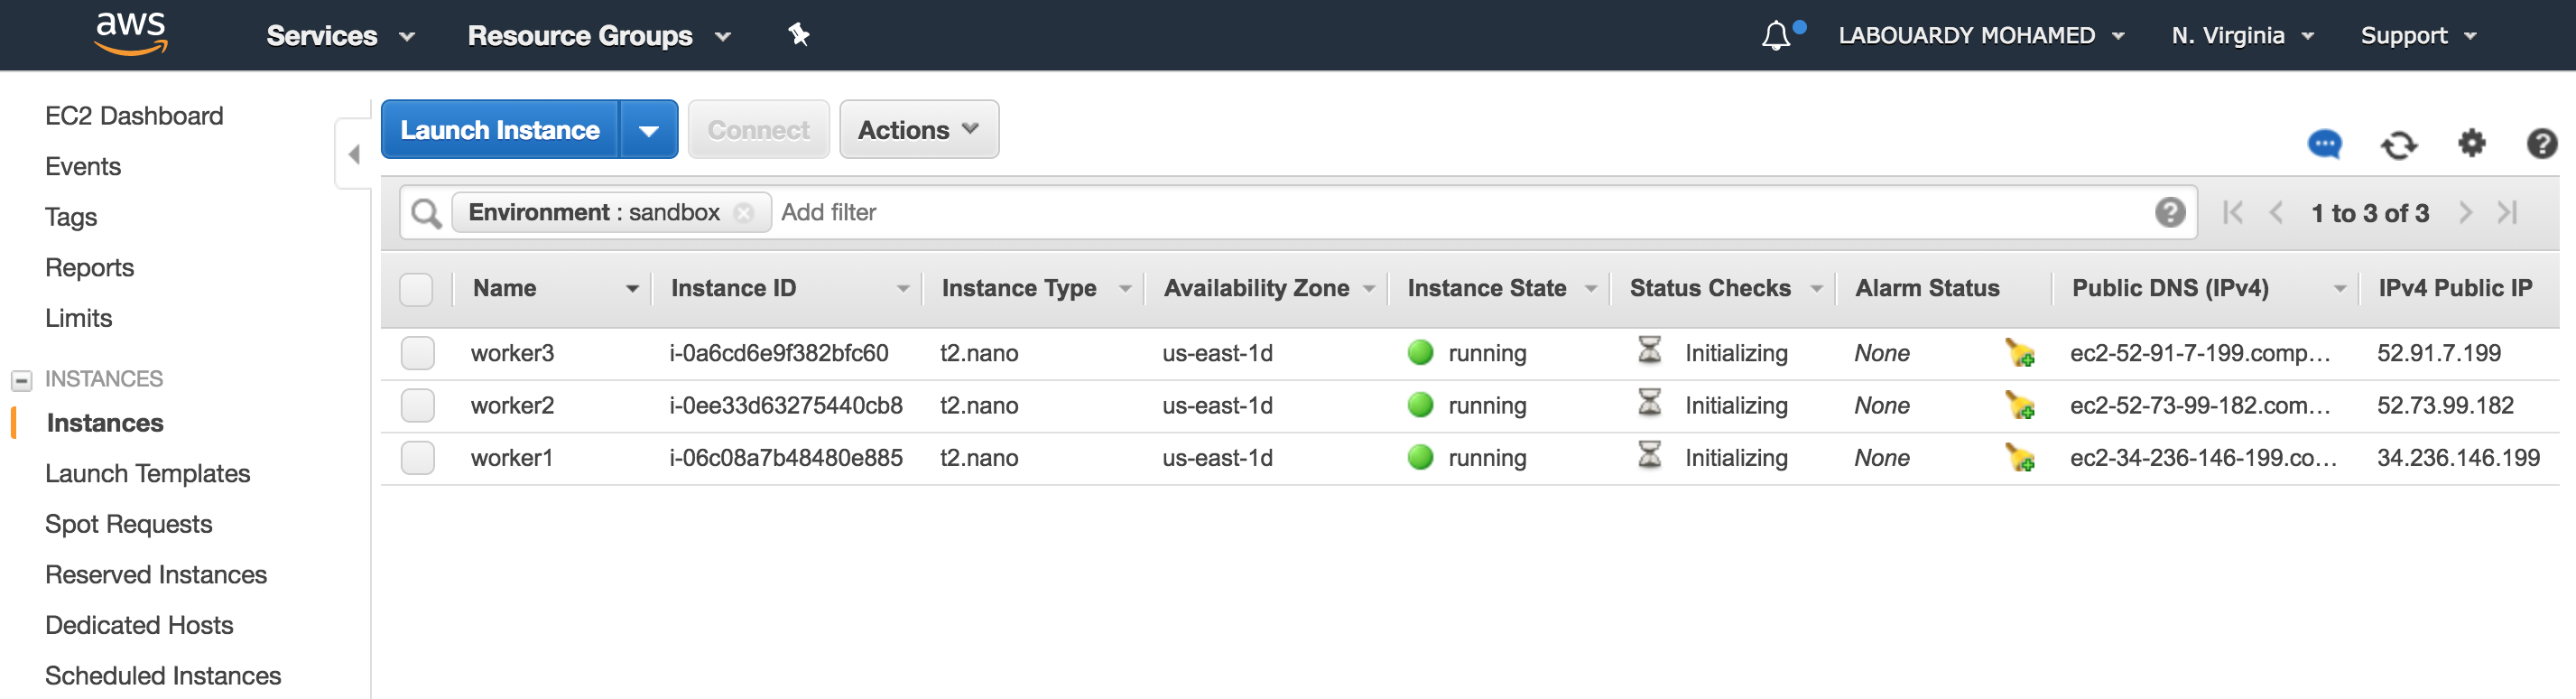
b – Start Environment
Result:
The solution is easy to deploy and can help reduce operational costs.
Full code can be found on my GitHub. Make sure to drop your comments, feedback, or suggestions below — or connect with me directly on Twitter @mlabouardy.
Are you tired of maintaining your CMS (WordPress, Drupal, etc) ? Paying expensive hosting fees? Fixing security issues everyday ?
I discovered not long ago a new blogging framework called Hexo which let you publish Markdown documents in the form of blog post. So as always I got my hands dirty and wrote this post to show you how to build a production-ready blog with Hexo and use the AWS S3 to make your blog Serverless and pay only per usage. Along the way, I will show you how to automate the deployment of new posts by setting up a CI/CD pipeline
To get started, Hexo requires Node.JS & Git to be installed. Once all requirements are installed, issue the following command to install Hexo CLI:
1
npm install -g hexo-cli
Next, create a new empty project:
1
hexo init slowcoder.com
Modify blog global settings in _config.yml file:
1 2 3 4 5 6 7 8
# Site
title: SlowCoder
subtitle: DevOps News and Tutorials
description: DevOps, Cloud, Serverless, Containers news and tutorials for everyone
keywords: programming,devops,cloud,go,mobile,serverless,docker
author: Mohamed Labouardy
language: en
timezone: Europe/Paris
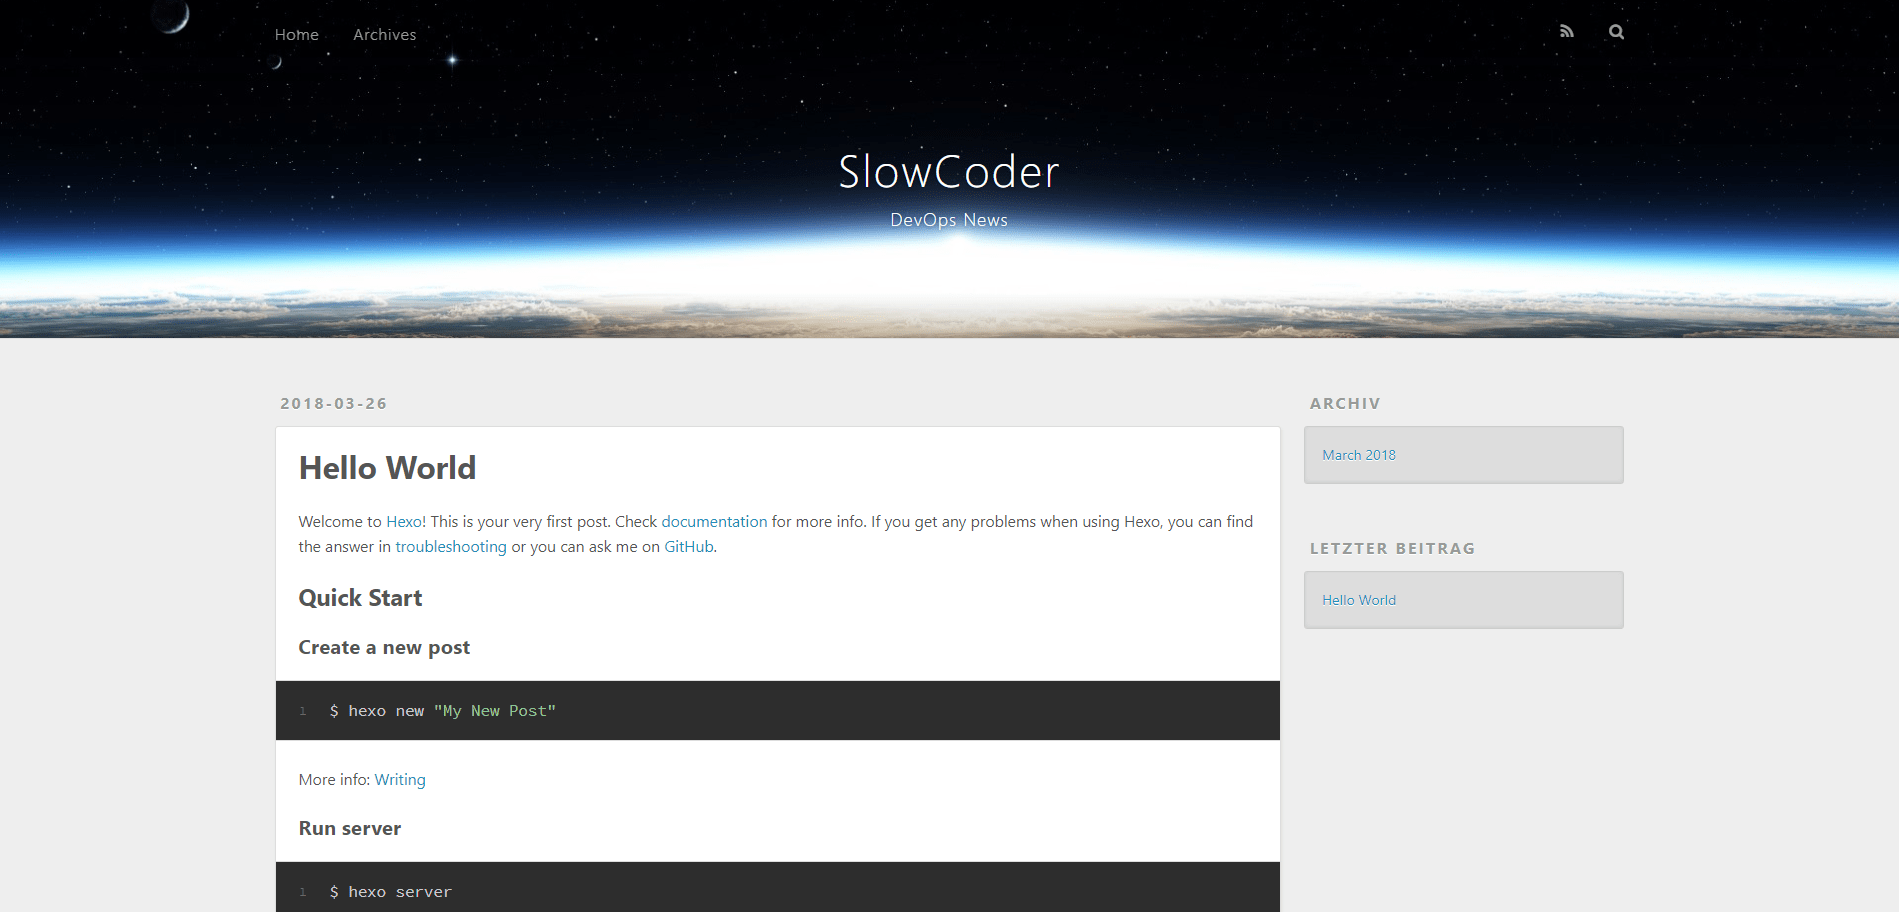
Start a local server with “hexo server“. By default, this is at http://localhost:4000. You’ll see Hexo’s pre-defined “Hello World” test post:
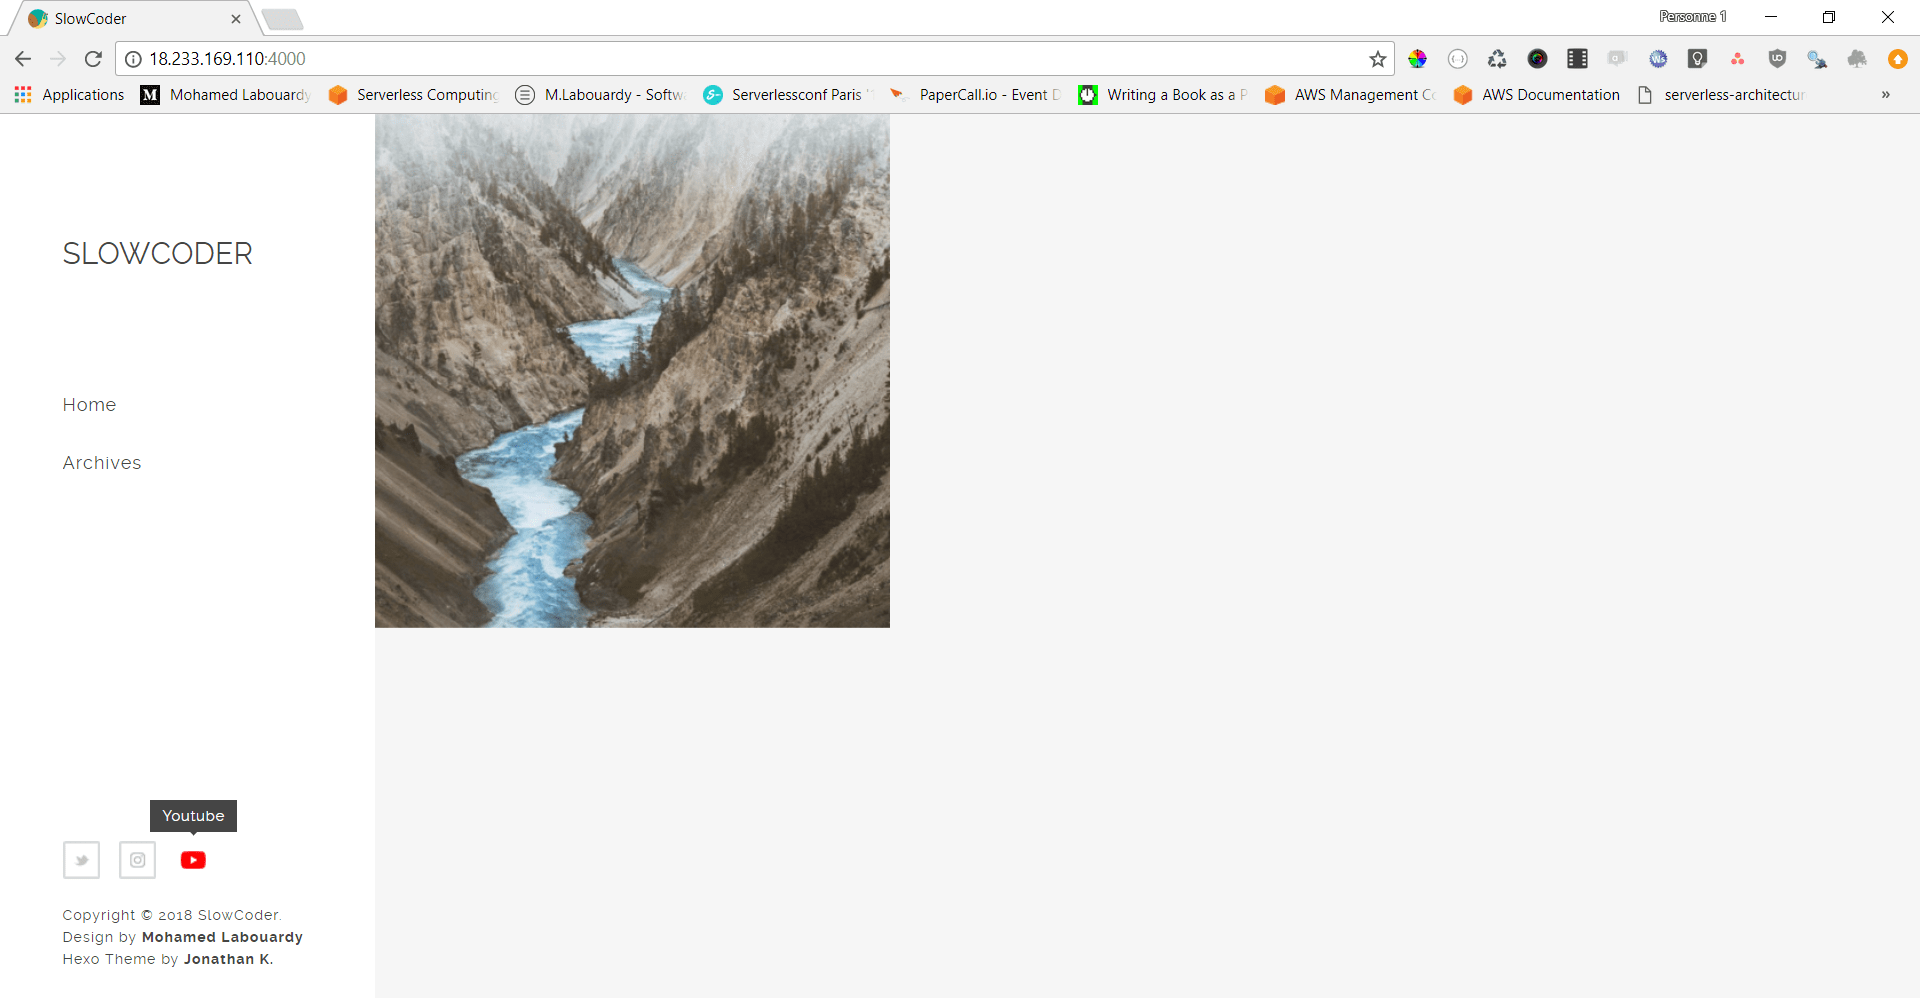
If you want to change the default theme, you just need to go here and find a new one you prefer.
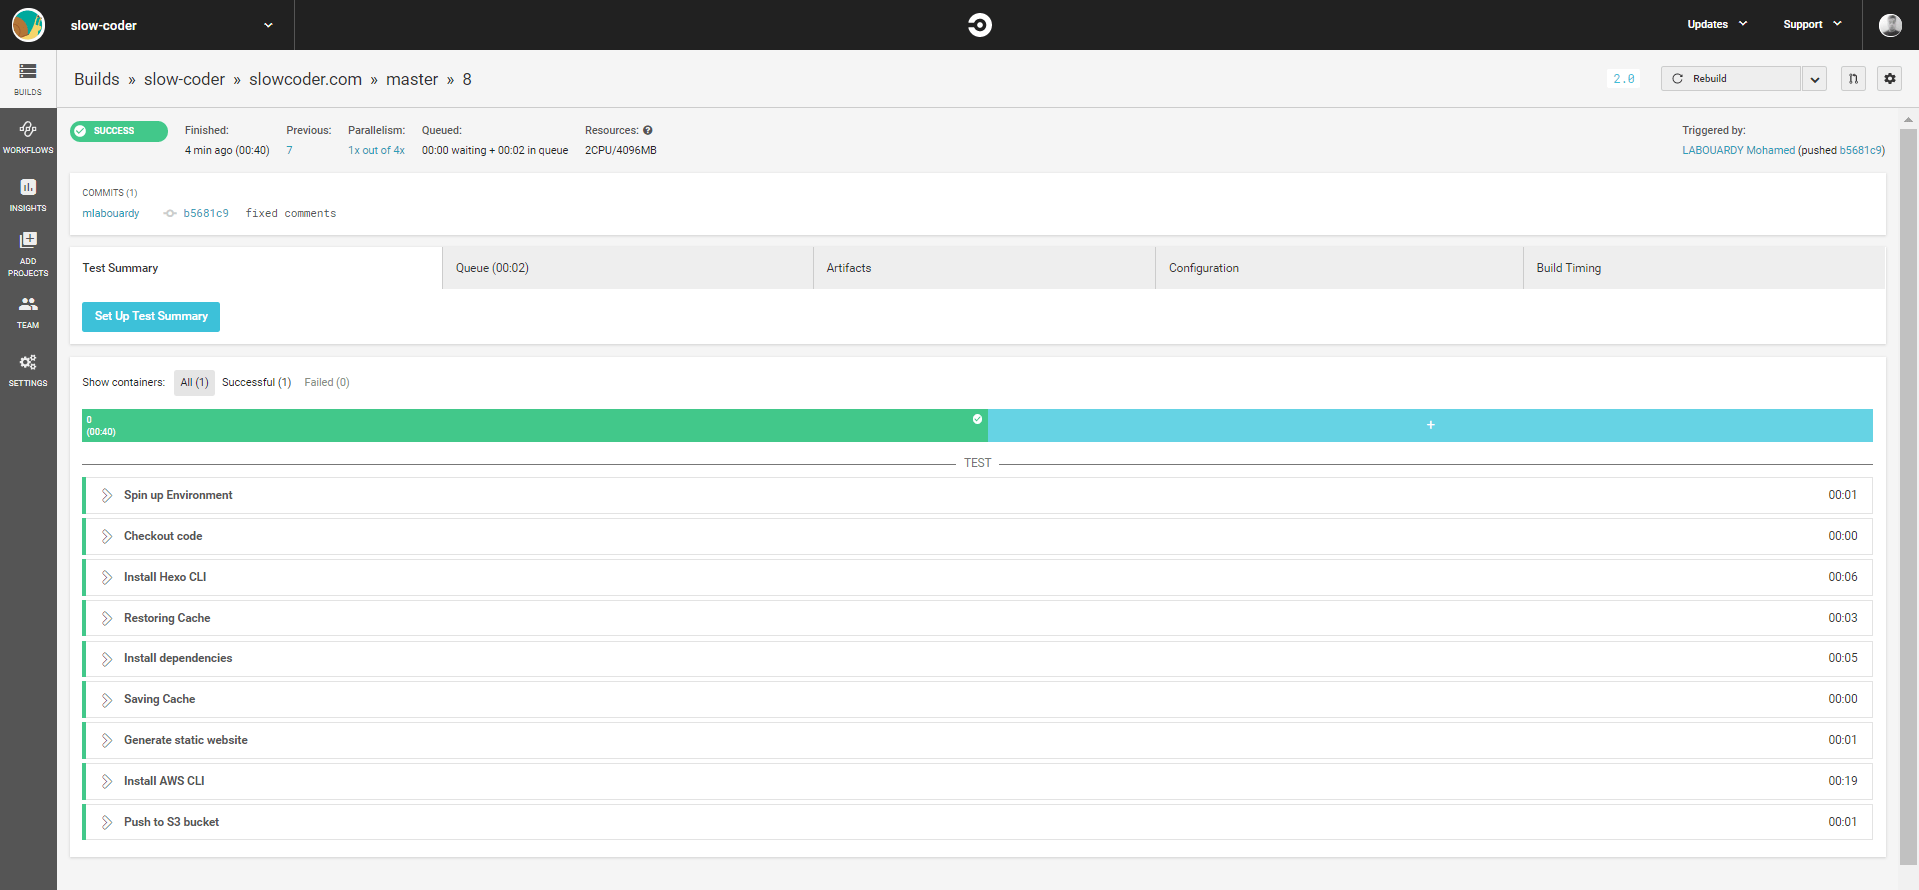
In order to automate the process of deployment of the blog to S3 each time a new article is been published. We will setup a CI/CD pipeline using CircleCI.
Sign in to CircleCI using your GitHub account, then add the circle.yml file to your project: