How We Reduced Lambda Functions Costs by Thousands of Dollars

Serverless Computing or FaaS is the best way to consume cloud computing. In this model, the responsibility for provisioning, maintaining, and patching servers is shifted from the customer to cloud providers. Which allows developers to focus on building new features and innovating, and pay only for the compute time that they consume.

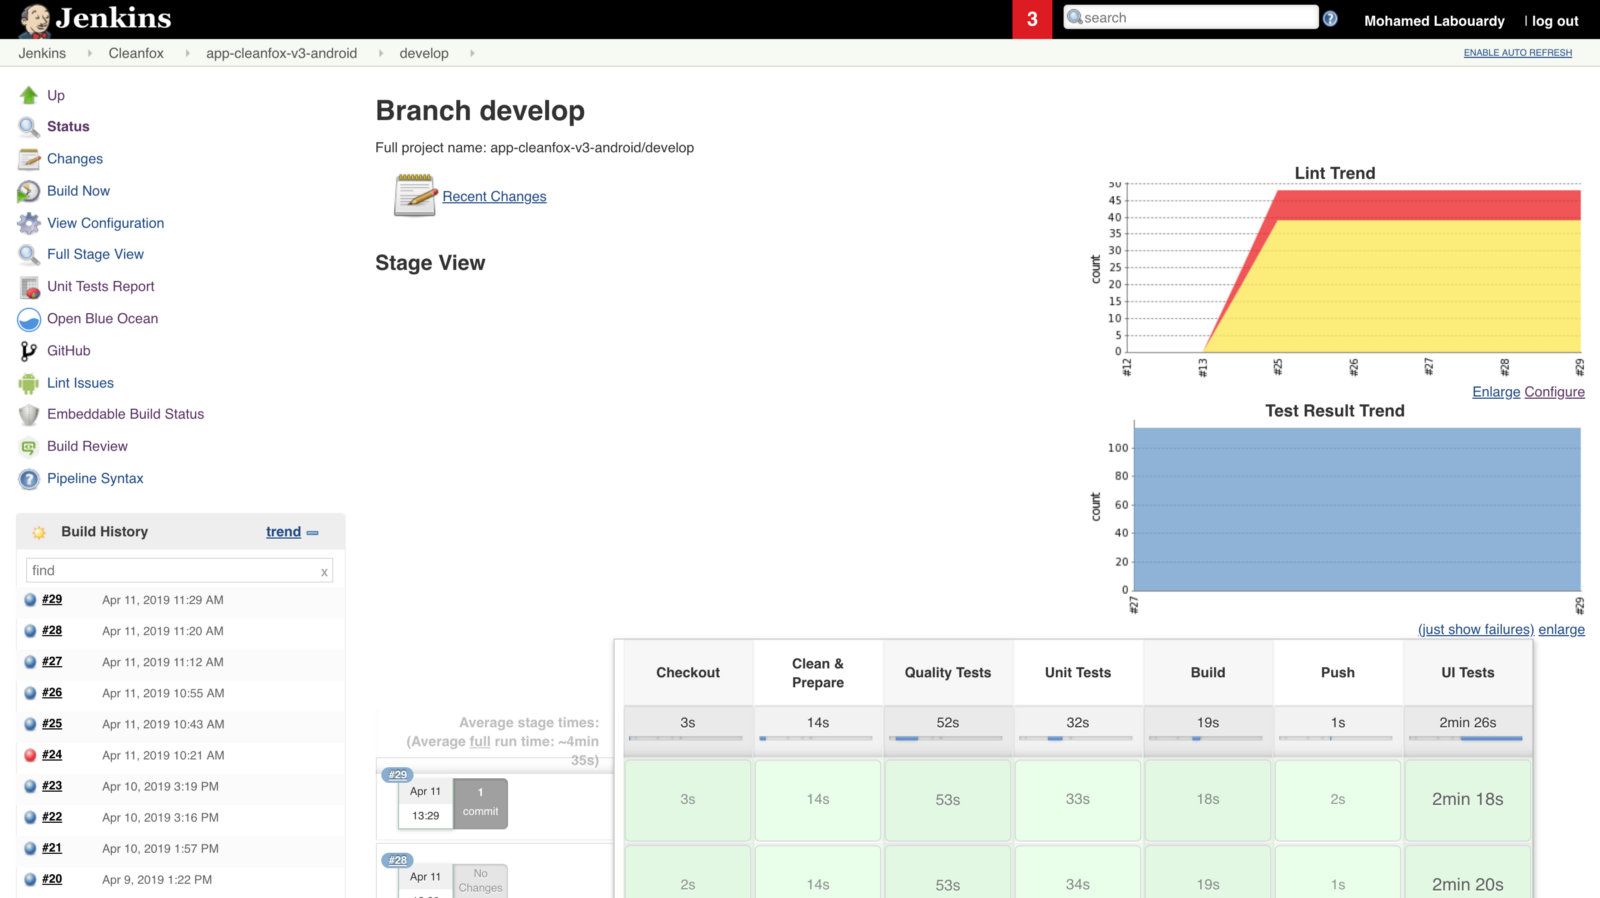
In the last 7 months, we started using Lambda based functions heavily in production. It allowed us to scale quickly and brought agility to our development activities.


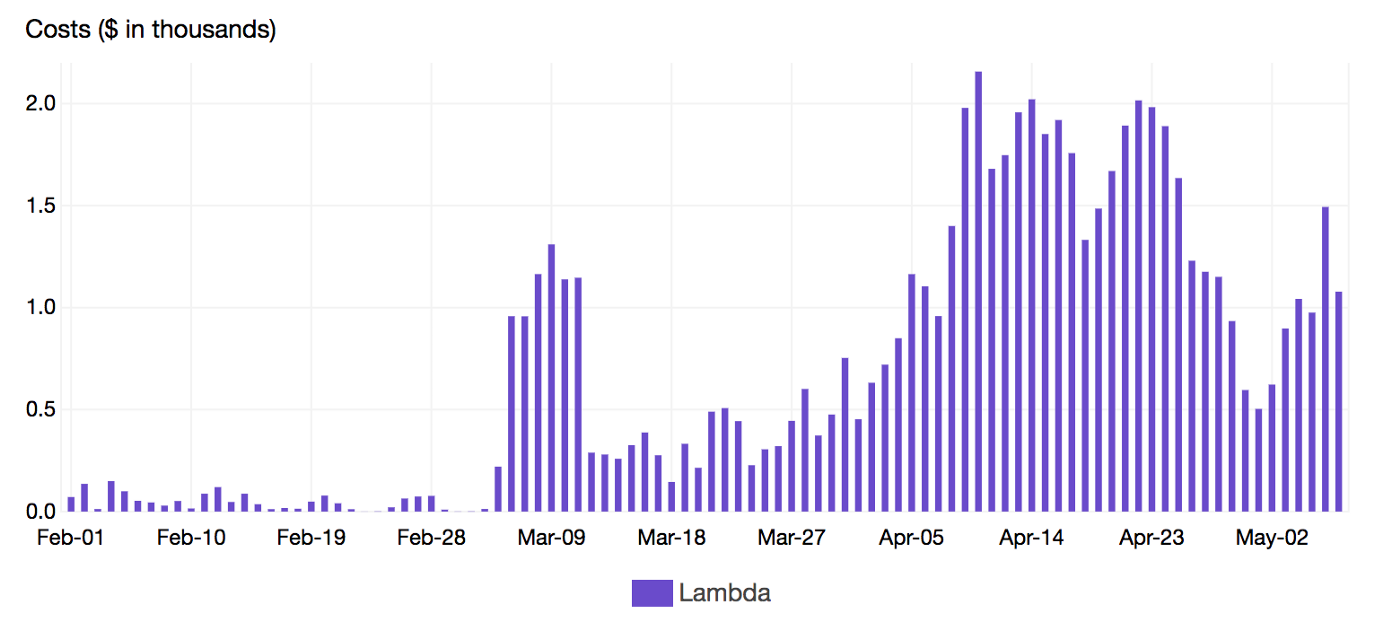
We were serving +80M Lambda invocations per day across multiple AWS regions with an unpleasant surprise in the form of a significant bill.


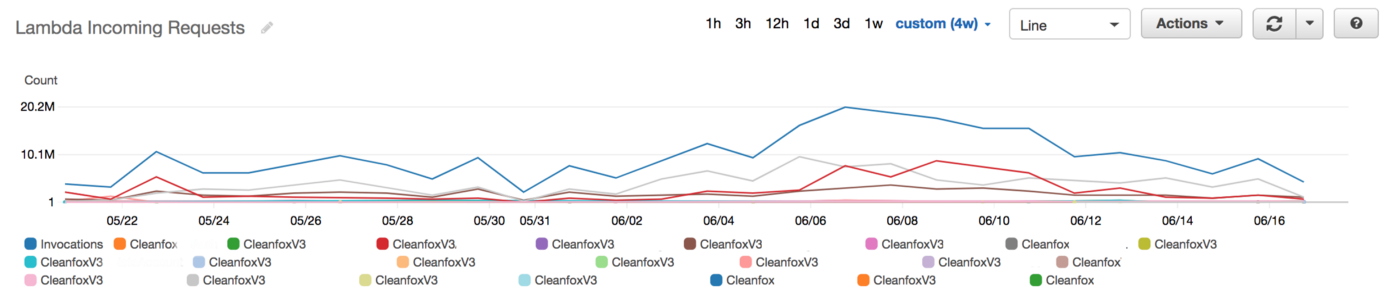
It was very easy and cheap to build a Lambda based applications that we forgot to estimate and optimize the Lambda costs earlier during development phase, so once we start running heavy workloads in production, the cost become significant and we spent thousands of dollars daily


To keep Lambda cost under control, understanding its behavior was critical. Lambda pricing model is based on the following factors:

  • Number of executions.
  • Duration, rounded to the nearest 100ms.
  • Memory allocated to the function.
  • Data transfer (out to the internet, inter-region and intra-region).

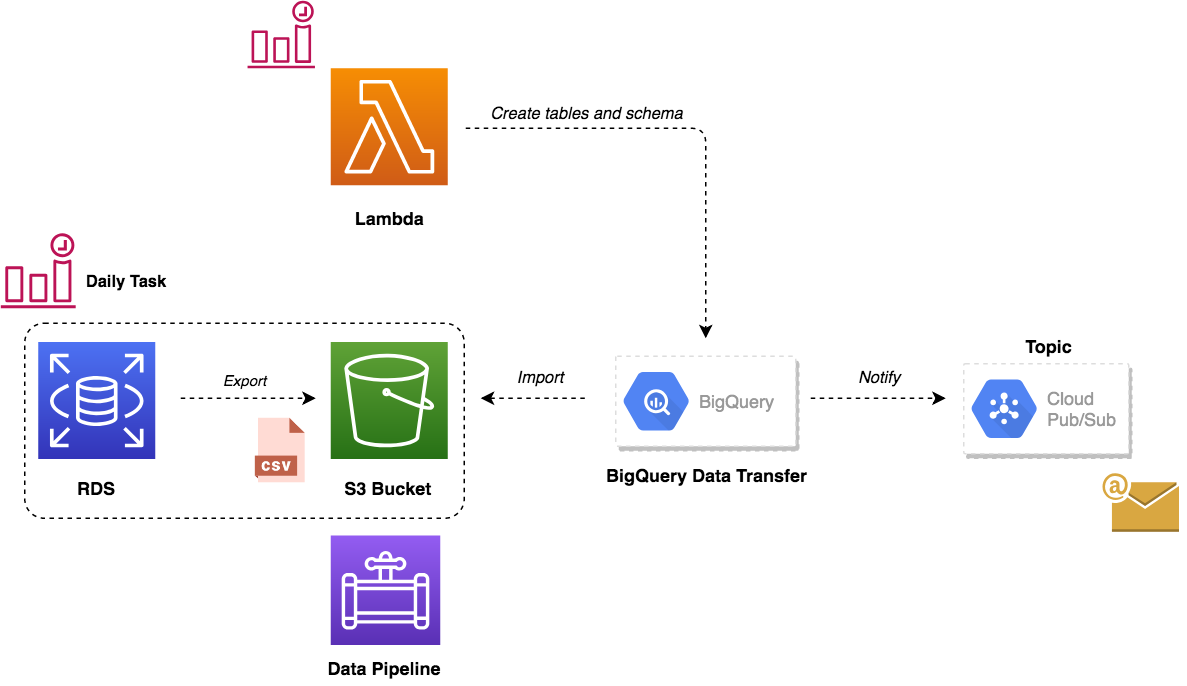
In order to reduce AWS Lambda costs, we monitored Lambda memory usage and execution time based on logs stored in CloudWatch.


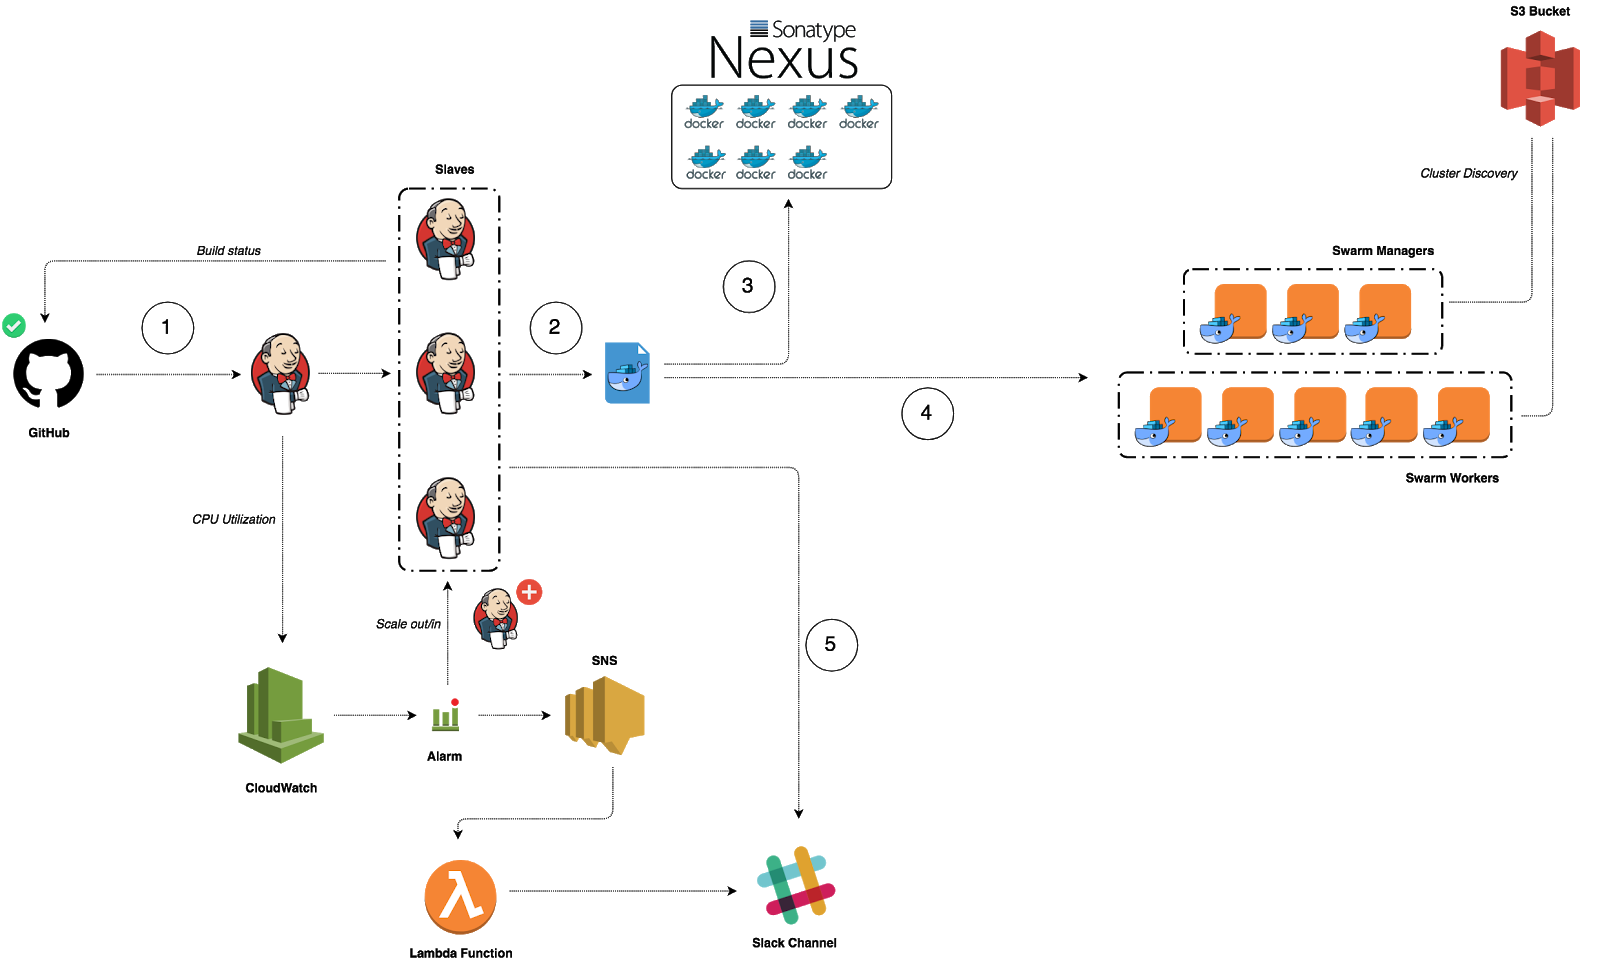
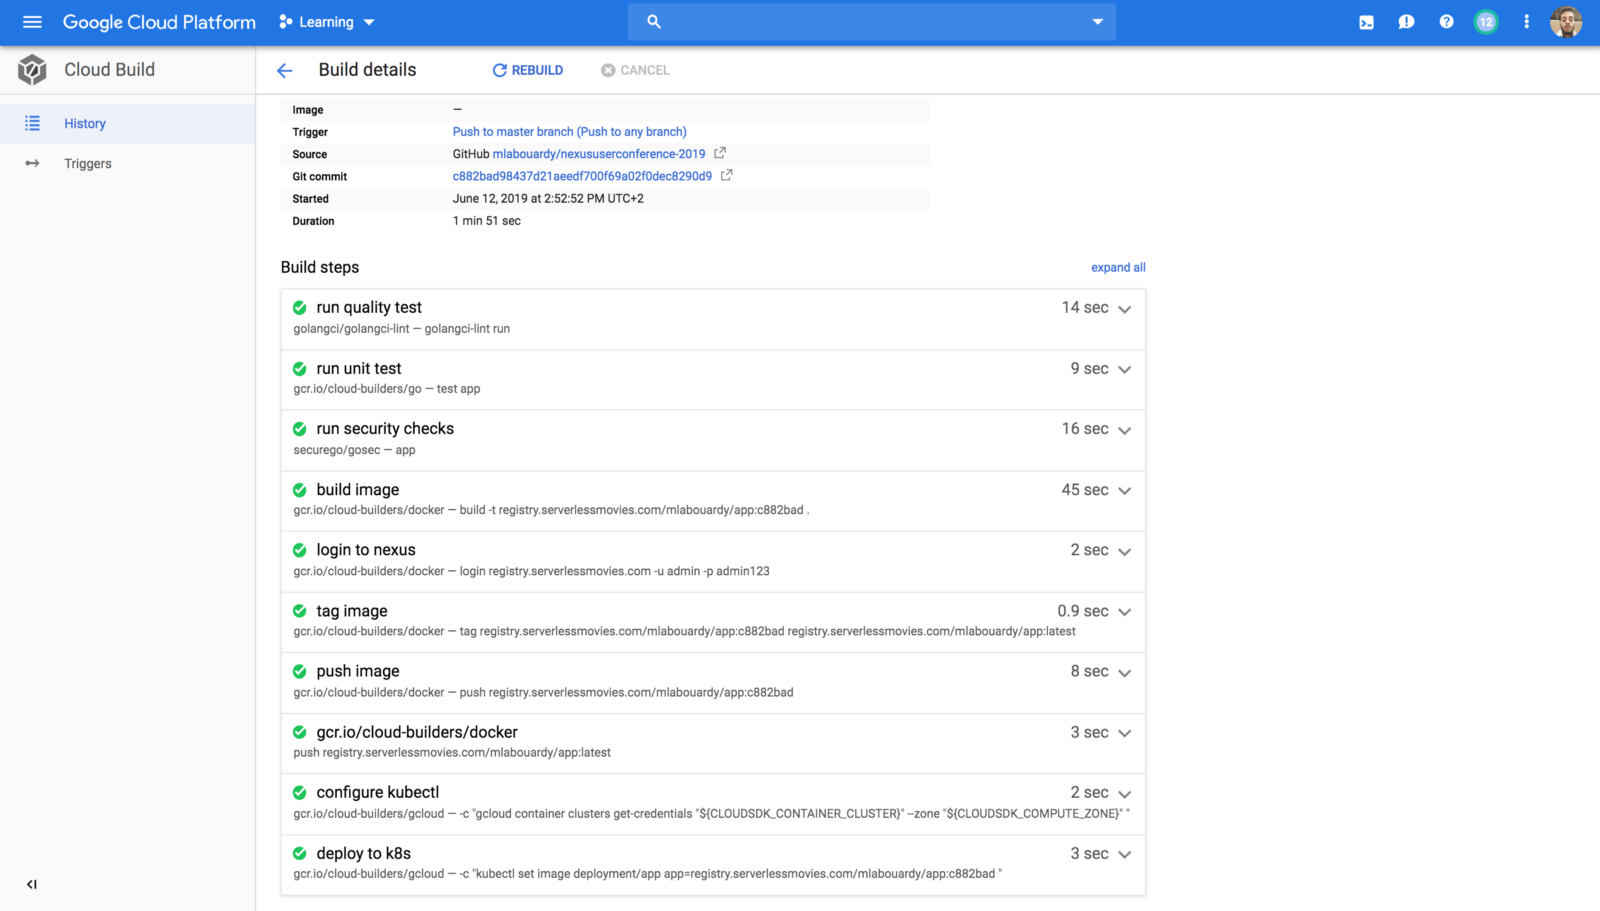
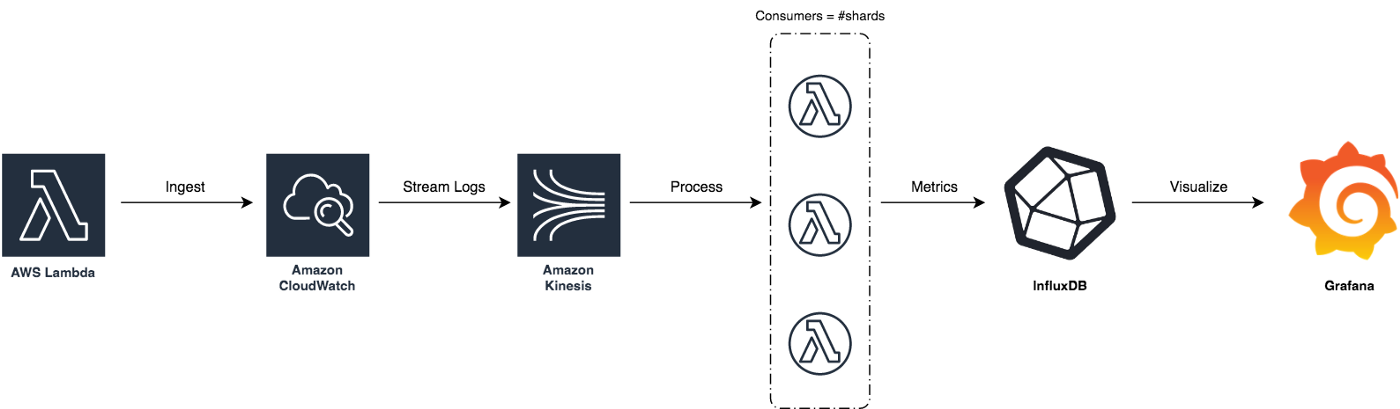
We’ve updated our previous centralized logging platform to extract relevant metrics (Duration, Billed Duration and Memory Size) from “REPORT” log entry reported through CloudWatch and store them into InfluxDB. You can check out the following link for a step-by-step guide on how to setup the following workflow:


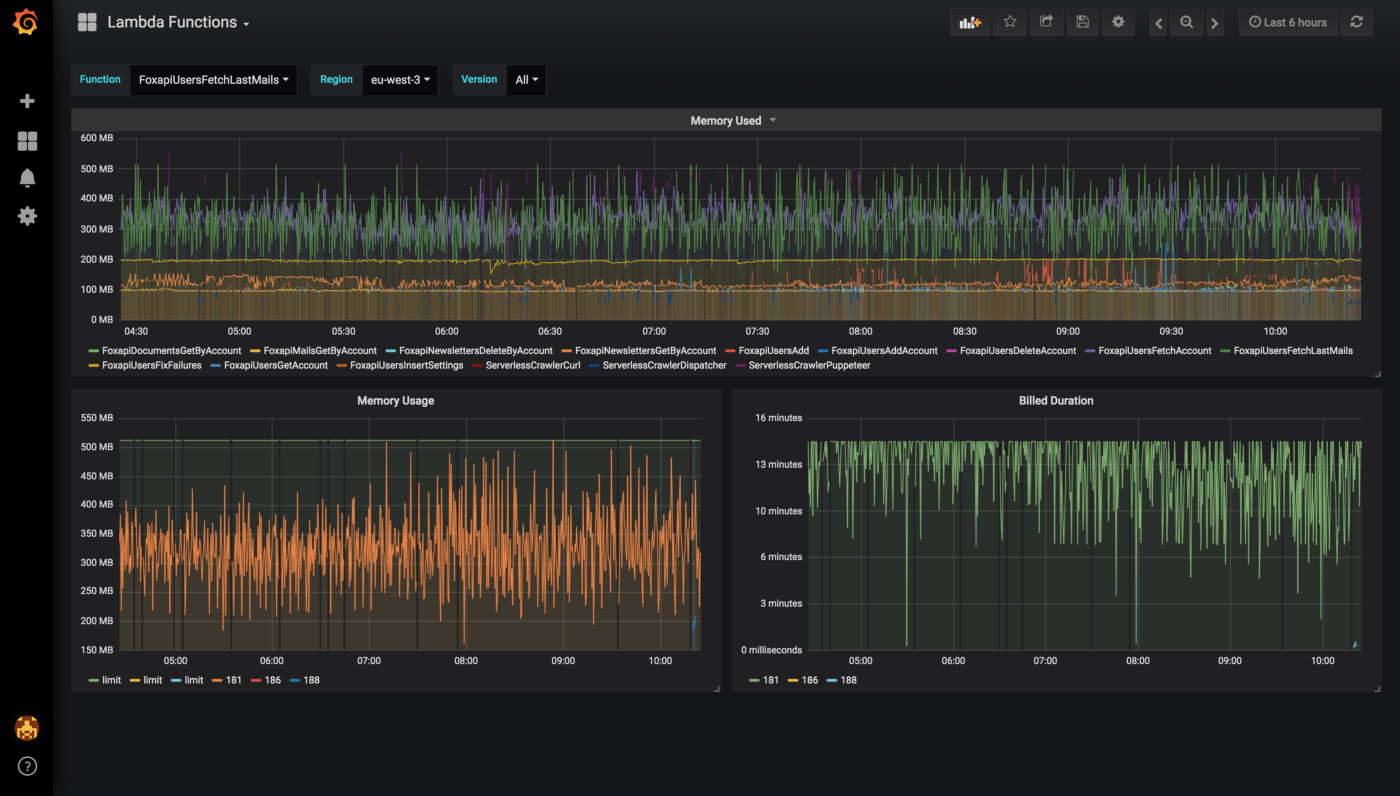
Next, we created dynamic visualizations on Grafana based on metrics available in the timeseries database and we were able to monitor in near real-time Lambda runtime usage. A graphical representation of the metrics for Lambda functions is shown below:


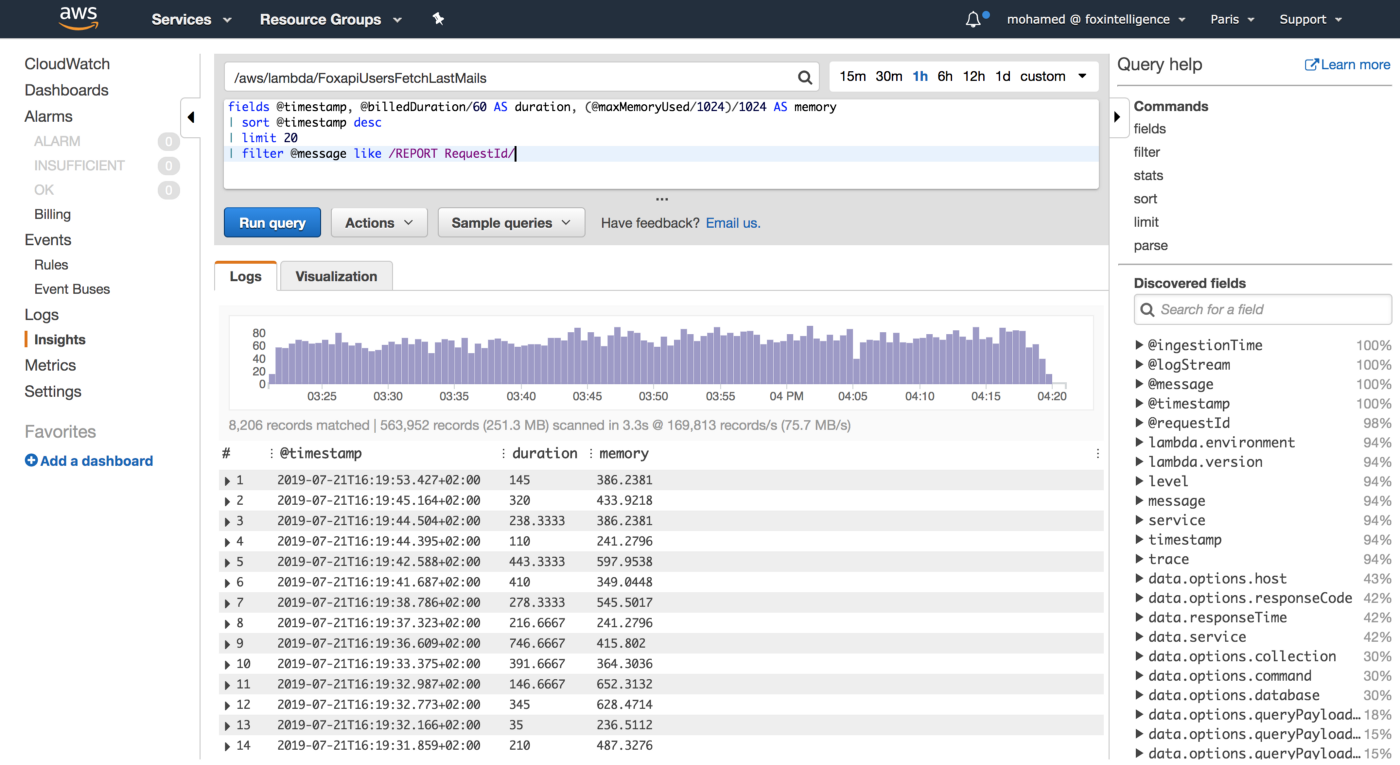
You can also use CloudWatch Logs Insights to issue ad-hoc queries to analyse statistics from recents invocations of your Lambda functions:


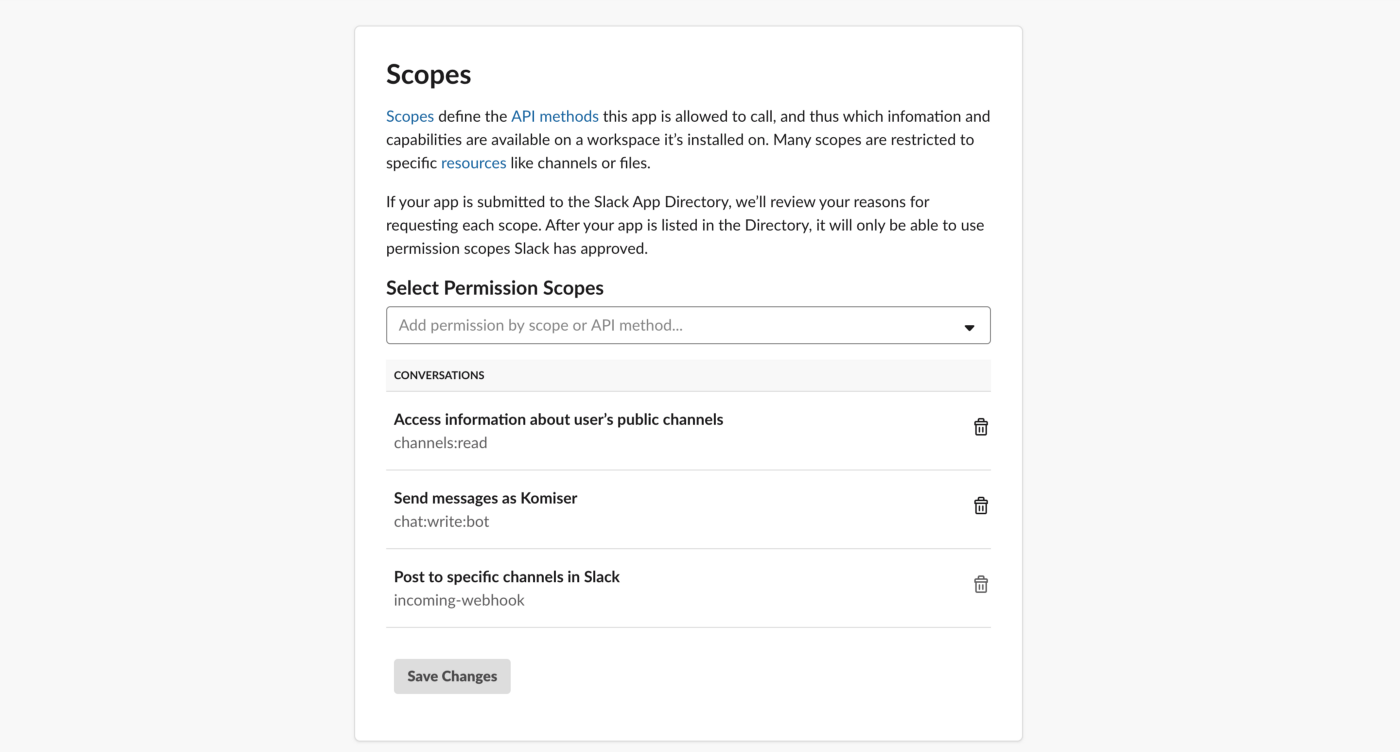
We leveraged these metrics to set Slack notifications when memory allocation is either too low (risk of failure) or too high (risk of over-paying) and to identify the billed duration, memory usage for the ten most expensive Lambda functions. When performing heuristic analysis of Lambda logs, we gain insights into the right sizing of each Lambda function deployed in our AWS account and we avoided excessive over-allocation of memory. Hence, significantly reduced the Lambda’s cost.

Memory allocation can make a big difference in your Lambda function cost. Too much allocated memory and you’ll overpay. Too little and your function will be at risk of failing. Therefore, you want to keep a healthy balance when it comes to memory allocation.

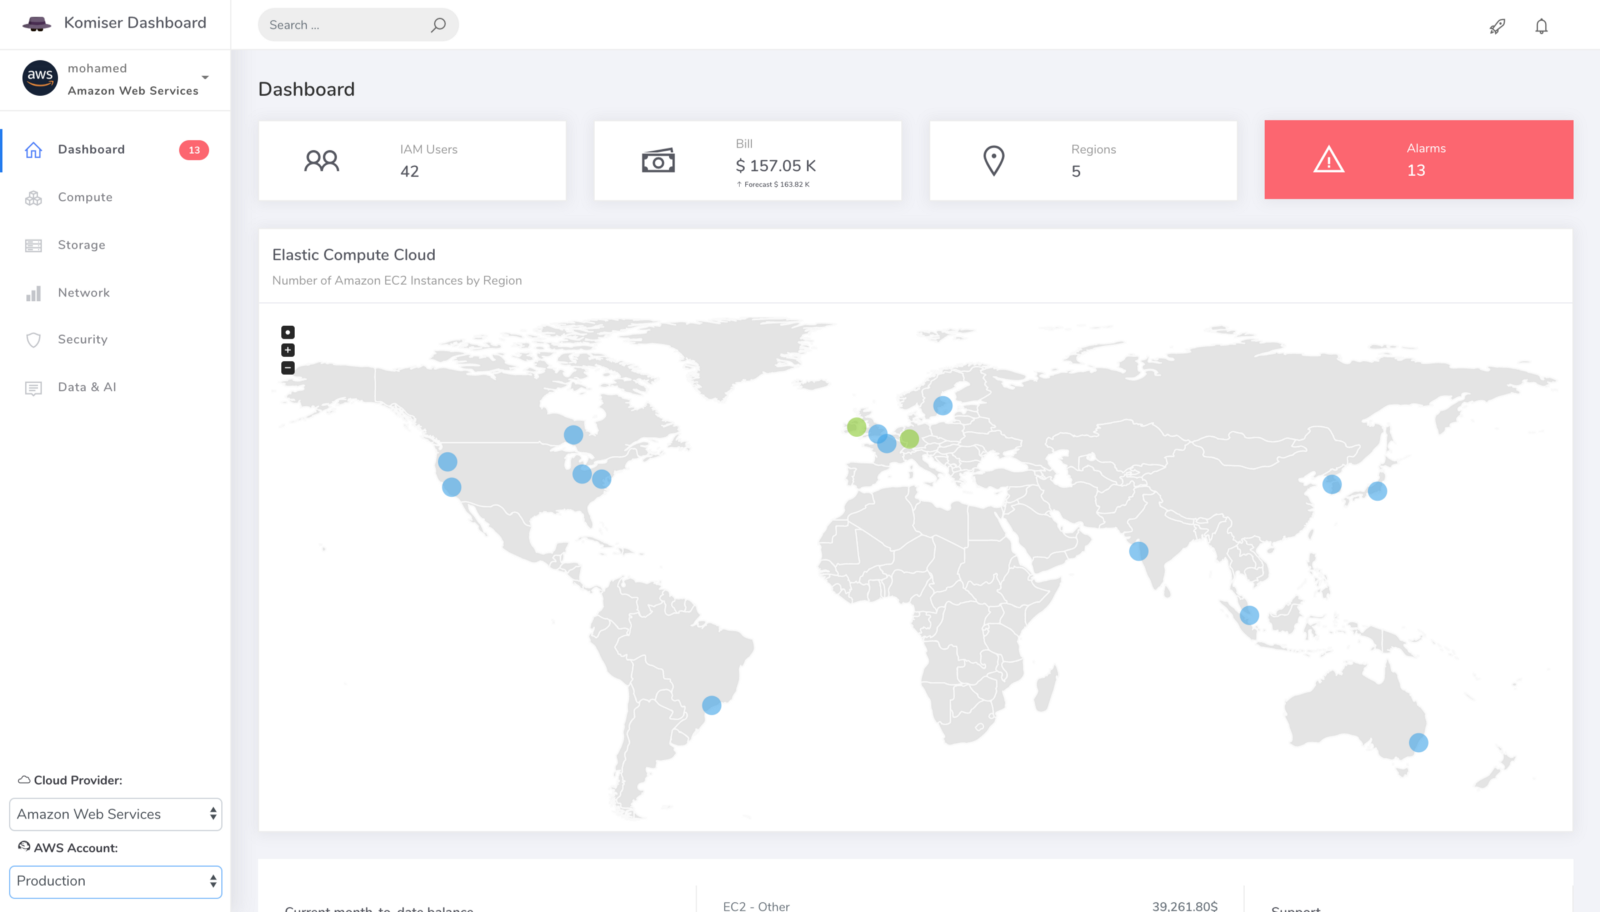
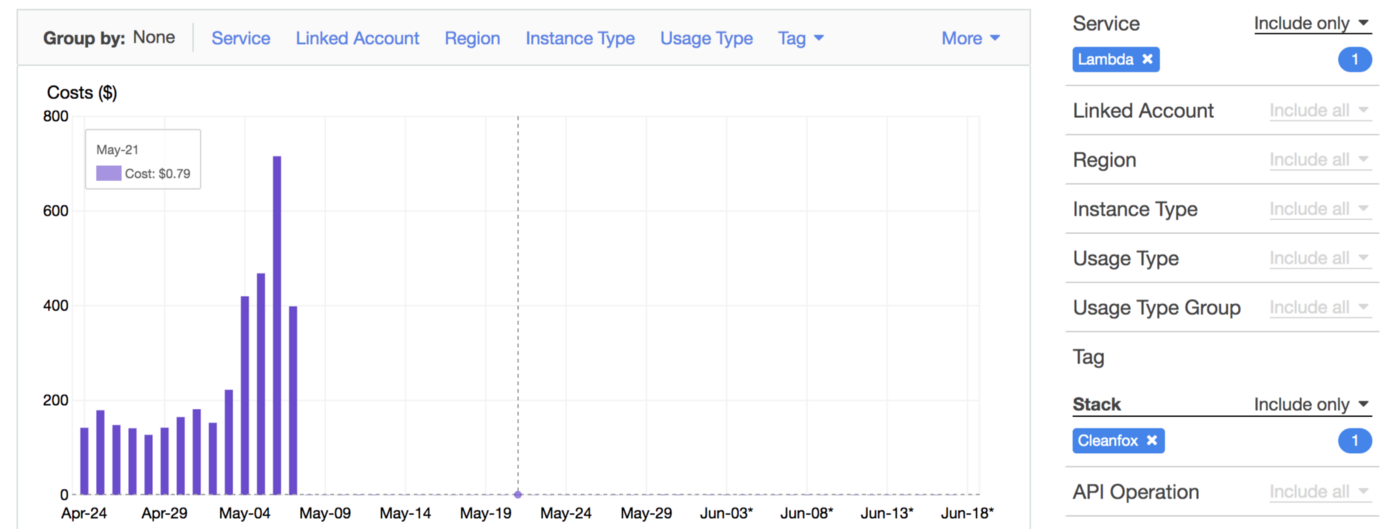
To gather more insights and uncover hidden costs, we had to identify the most expensive functions. Thats where Lambda Tags comes into the play. We leveraged those metadata to breakdown the cost per Stack (project):


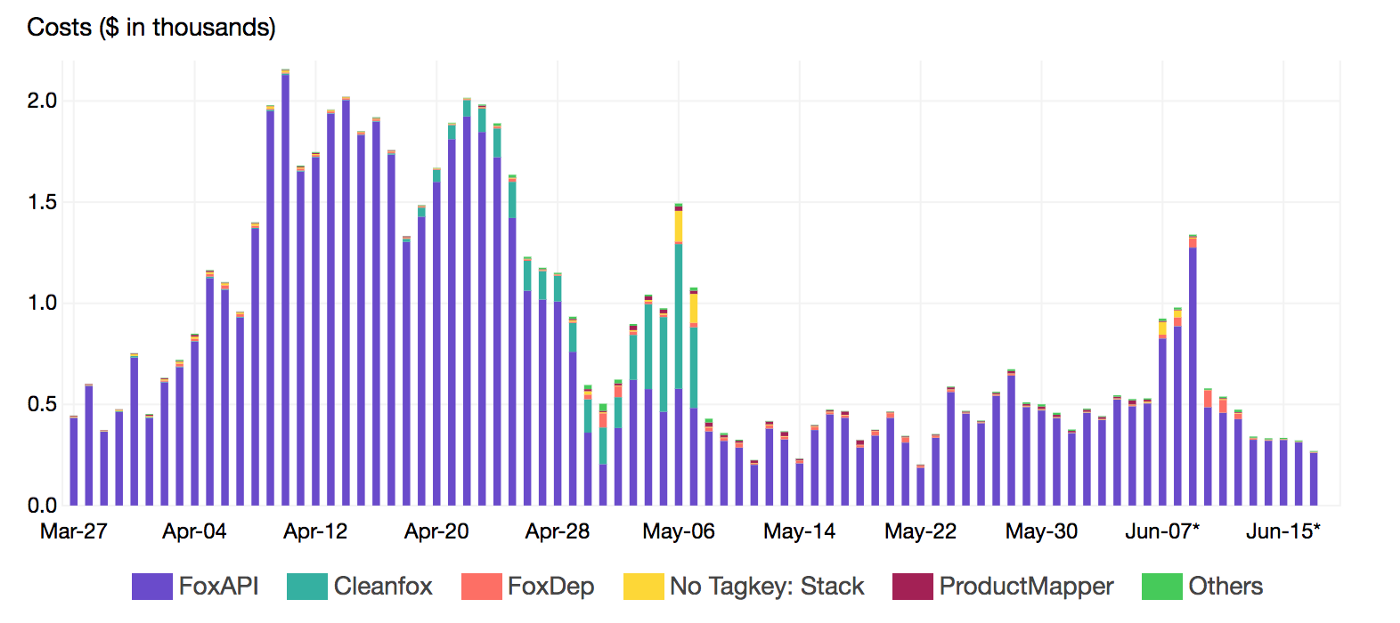
By reducing the invocation frequency (control concurrency with SQS), we reduced the cost up to 99% and CO2 emissions footprint of our B2C app Cleanfox 🚀💰


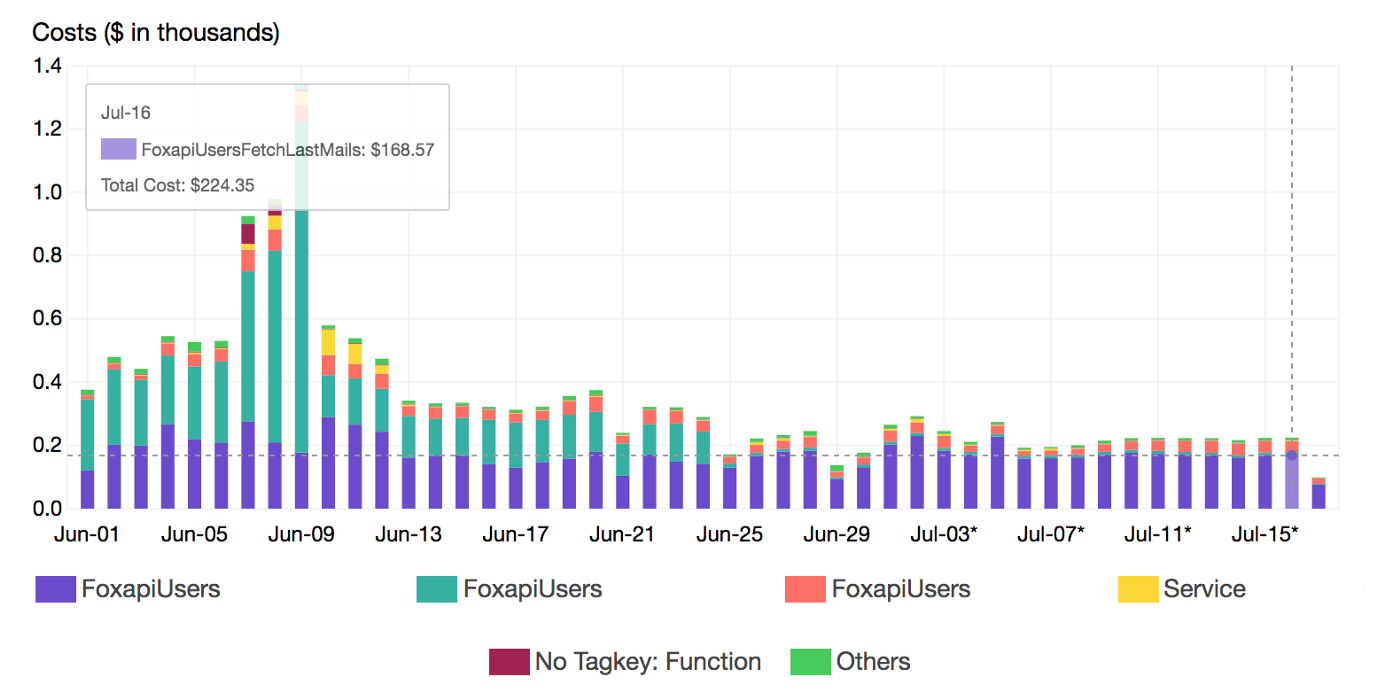
At a deeper level, we also breakdown the cost by Lambda function name using a secondary tag which is Function tag:


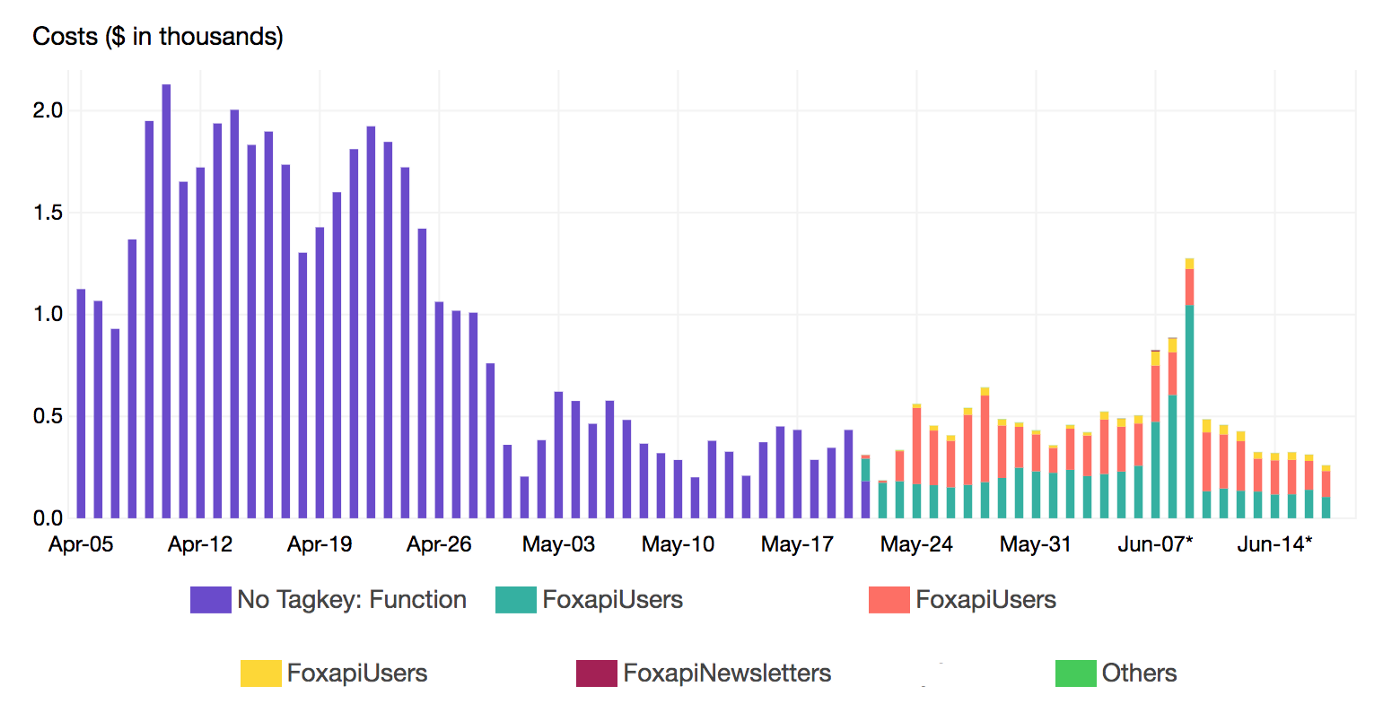
Once the target functions were identified, we reviewed the execution flow and applied some optimisation in our code to shorten the running time and resources needed (Memory and CPU)


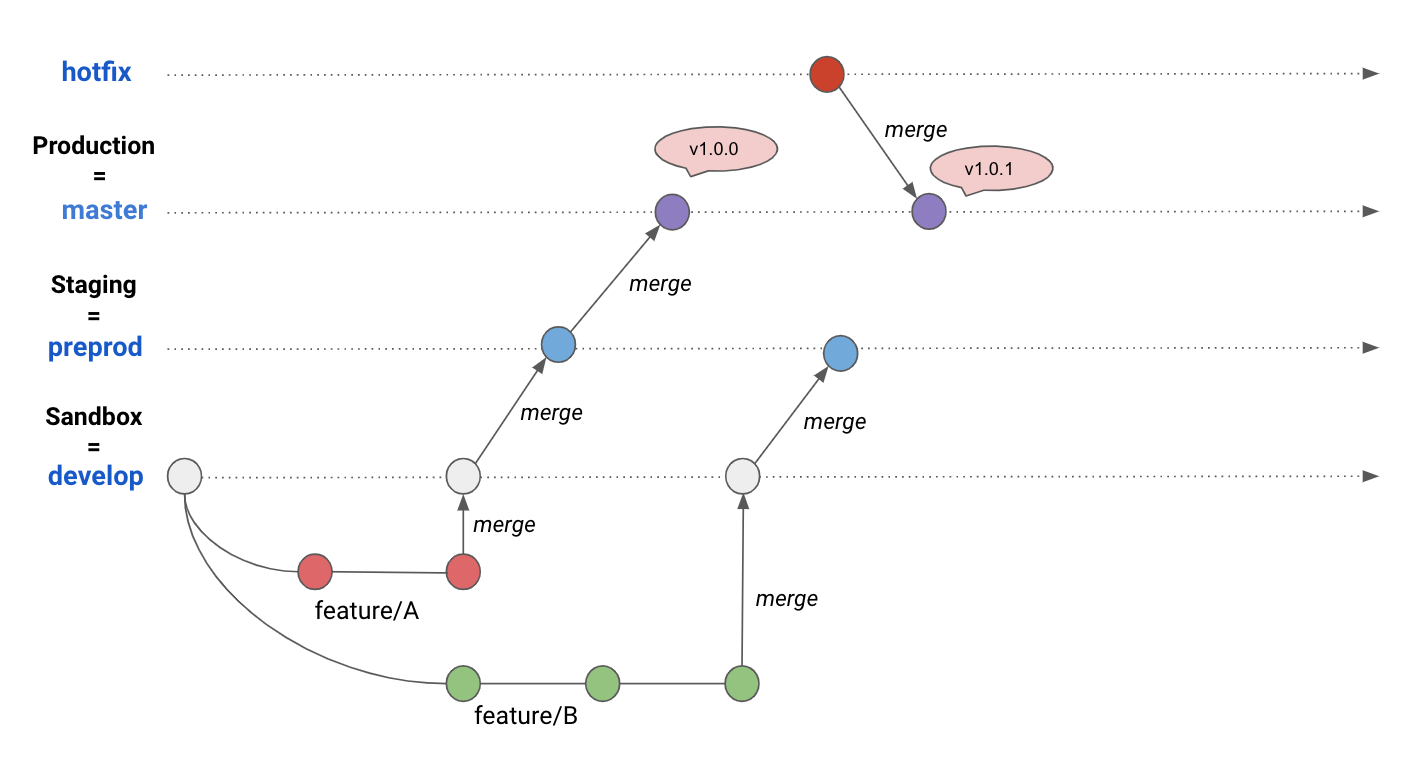
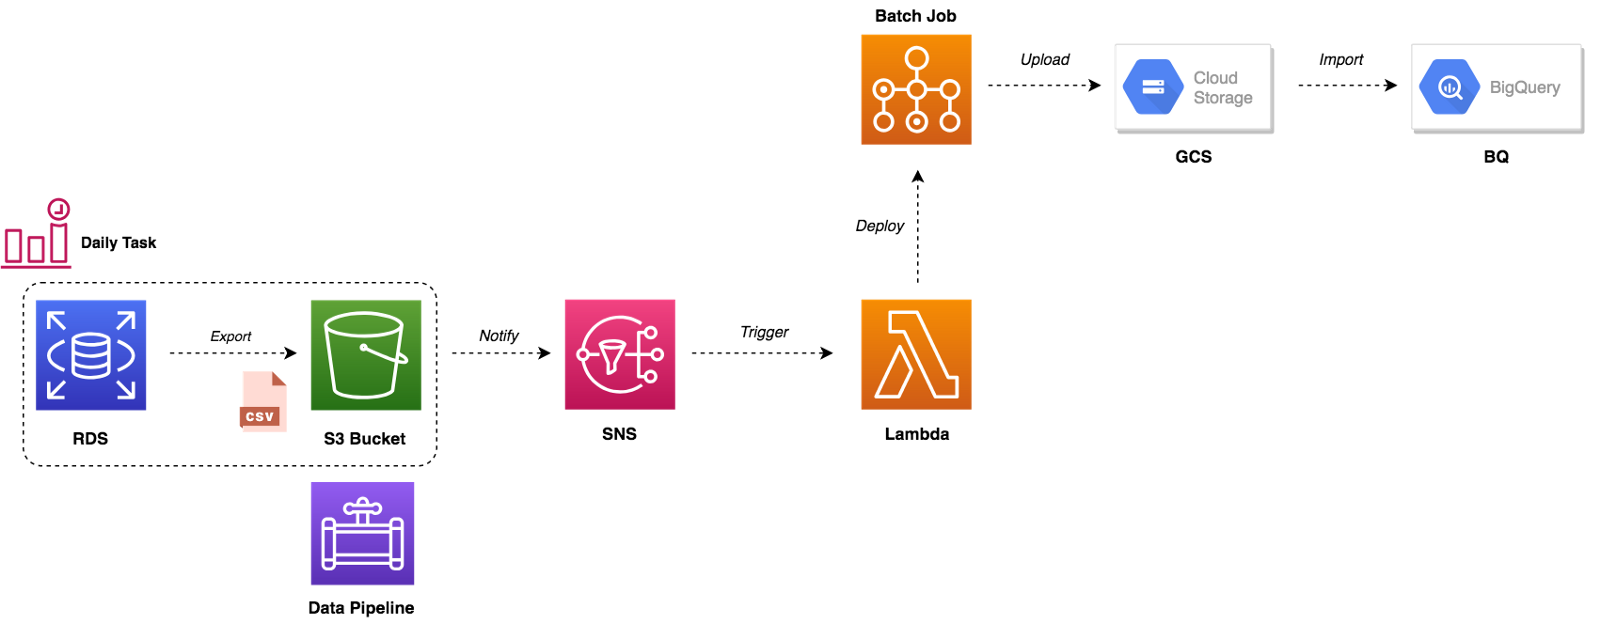
By continuously monitoring increases in spend, we end up building scalable, secure and resilient Lambda based solutions while maintaining maximum cost-effectiveness. Also, we are now configuring Lambda runtime parameters appropriately at the sandbox stage and we’re evaluating alternative services like Spot Instances & Batch Jobs to run heavy non-critical workloads considering the hidden costs of Serverless.

Drop your comments, feedback, or suggestions below — or connect with me directly on Twitter @mlabouardy.

Komiser EE:Setting Up Budget Alerts

Based on the latest survey and emails you were a lot to ask for Slack notifications.


We’re thrilled to announce the release of a new feature that allows you to setup daily spending alerts for AWS, GCP and DigitalOcean accounts.

Configuration

Head over to Your Apps and click the green “Create New App” button. A dialog like this will pop up:


Generate OAuth Token:


Add the below permission scopes and reinstall the app in the target workspace:


On Komiser EE Dashboard, navigate to “Dashboard” section:


Click on “Create Alert” button:


Fill out the form and click on create:


That’s it, you will receive everyday (at 9am GMT) a slack notification with the current monthly cost of each cloud account configured on your Komiser EE account:


Drop your comments, feedback, or suggestions below — or connect with me directly on Twitter @mlabouardy.

Komiser Stays Open

Komiser EE is built on top of Komiser CE, that means that Komiser continues to evolve and will stay open source. Nothing changes! We are firm believers in open source, and Komiser will continue to be our main priority and a community-driven project.

Announcing DigitalOcean Support

Releases keep rolling ! We’re thrilled to announce the release of Komiser:2.4.0 with support of DigitalOcean 🎊 🎉 From one single dashboard, you can now manage cloud cost, usage, security and governance across all major public cloud providers (AWS, GCP, OVH and DigitalOcean).


DigitalOcean is now supported by both Komiser CE and EE.


Usage

Below are the available downloads for the latest version of Komiser (2.4.0). Please download the proper package for your operating system and architecture.

Linux:

1
wget https://cli.komiser.io/2.4.0/linux/komiser

Windows:

1
wget https://cli.komiser.io/2.4.0/windows/komiser

Mac OS X:

1
wget https://cli.komiser.io/2.4.0/osx/komiser

Note: make sure to add the execution permission to Komiser chmod +x komiser and update the user’s $PATH variable.

Komiser is also available as a Docker image:

Docker:

1
docker run -d -p 3000:3000 --name komiser mlabouardy/komiser:2.4.0

To use Komiser CE/EE, you’ll first generate a personal access token. You can generate a new one by signing in to the DigitalOcean Control Panel.

Click the API link in the main navigation, which takes you to to the Applications & API page on the Tokens/Keys tab. In the Personal access tokens section, click the Generate New Token button.


Set DIGITALOCEAN_ACCESS_TOKEN environment variable:

1
export DIGITALOCEAN_ACCESS_TOKEN=value

If you point your browser to http://localhost:3000, you should be able to see your DigitalOcean projects:


You can now analyze and identify potential cost savings on your DigitalOcean cloud environment on one single dashboard.

The documentation can be found on https://docs.komiser.io.

Komiser is written in Golang and is MIT licensed — contributions are welcomed whether that means providing feedback or testing existing and new features.

Announcing Komiser Entreprise Edition

In just few months, Komiser, the Cloud Environment Inspector, has become a key player in cloud cost optimization ecosystem. With more than 2,200 stars on Github and 190,000 downloads, Komiser is widely used by major companies in their production environments.

Today we’re announcing Komiser Enterprise Edition (EE), our new commercial product, has reached public beta. Komiser EE allows you to identify potential cost savings on all major public cloud providers (AWS, GCP, OVH, Azure and DigitalOcean). Komiser EE is available in three tiers: Essentials, Business and Entreprise tiers :


For consistency, we are also renaming the open source Komiser products to Komiser Community Edition (CE).

Highlights

New Landing Page


Multiple Cloud Accounts Support


Reserved Instances Advisor


Early access to features


Early Access

Komiser EE is available in early access starting today. The registration process is as simple and automated as possible, so don’t fear endless registration forms nor crowded waiting queues before trying it out. Visit our website at https://cloud.komiser.io and get started in less than a minute!

Komiser Stays Open

Komiser EE is built on top of Komiser CE, that means that Komiser continues to evolve and will stay open source. Nothing changes! We are firm believers in open source, and Komiser will continue to be our main priority and a community-driven project.

Building a CI/CD on GCP with Kubernetes

Last year I have given a talk at Nexus User Conference 2018 on how to build a CI/CD pipeline from scratch on AWS to deploy Dockerized Microservices and Serverless Functions. You can read my previous Medium post for step by step guide:


In 2019 edition of Nexus User Conference, I have presented how to build a CI/CD workflow on GCP with GKE, Cloud Build and Infrastructure as Code tools such us Terraform & Packer. This post will walk you through how to create an automated end-to-end process to package a Go based web application in a Docker container image, and deploy that container image on a Google Kubernetes Engine cluster.


Google Cloud Build allows you to define your pipeline as code in a template file called cloudbuild.yaml (This definition file must be committed to the application’s code repository). The continuous integration pipeline is divided to multiple stages or steps:

  • Quality Test: check whether our code is well formatted and follows Go best practices.
  • Unit Test: launch unit tests. You could also output your coverage and validate that you’re meeting your code coverage requirements.
  • Security Test: inspects source code for common security vulnerabilities.
  • Build: build a Docker image based on Docker multi-stage feature.
  • Push: tag and store the artifact (Docker image) to a Docker private registry.
1
2
3
4
5
6
7
8
9
10
11
12
13
14
15
16
17
18
19
20
21
22
23
24
25
26
27
28
29
30
31
32
33
steps:
- id: 'run quality test'
name: "golangci/golangci-lint"
args: ["golangci-lint","run"]

- id: 'run unit test'
name: 'gcr.io/cloud-builders/go'
args: ['test', 'app']
env: ['GOPATH=.']

- id: 'run security checks'
name: "securego/gosec"
args: ['app']
env: ['GOPATH=.']

- id: 'build image'
name: 'gcr.io/cloud-builders/docker'
args: ['build', '-t', 'registry.serverlessmovies.com/mlabouardy/app:$SHORT_SHA', '.']

- id: 'login to nexus'
name: 'gcr.io/cloud-builders/docker'
args: ['login', 'registry.serverlessmovies.com', '-u', '${_NEXUS_USERNAME}', '-p', '${_NEXUS_PASSWORD}']

- id: 'tag image'
name: 'gcr.io/cloud-builders/docker'
args: ['tag', 'registry.serverlessmovies.com/mlabouardy/app:$SHORT_SHA', 'registry.serverlessmovies.com/mlabouardy/app:latest']

- id: 'push image'
name: 'gcr.io/cloud-builders/docker'
args: ['push', 'registry.serverlessmovies.com/mlabouardy/app:$SHORT_SHA']

- name: 'gcr.io/cloud-builders/docker'
args: ['push', 'registry.serverlessmovies.com/mlabouardy/app:latest']

Now we have to connect the dots. We are going to add a build trigger to initiate our pipeline. To do this, you have to navigate to Cloud Build console and create a new Trigger. Fill the details as shown in the screenshot below and create the trigger.


Notice the usage of variables instead of hardcoding Nexus Registry credentials for security purposes.

A new Webhook will be created automatically in your GitHub repository to watch for changes:


All good! now everything is configured and you can push your features in your repository and the pipeline will jump to action.


One the CI finishes the Docker image will be pushed into the hosted Docker registry, if we jump back to Nexus Repository Manager, the image should be available:


Now the docker image is stored in a registry, we will deploy it to a Kubernetes cluster, so similarly we will create a Kubernetes cluster based on GKE using Terraform:

1
2
3
4
5
6
7
8
9
10
11
12
13
14
15
16
17
18
19
20
21
22
23
24
25
26
27
28
29
30
31
32
33
34
35
36
37
38
resource "google_container_cluster" "cluster" {
name = "${var.environment}"
location = "${var.zone}"

remove_default_node_pool = true

initial_node_count = "${var.k8s_nodes}"

master_auth {
username = ""
password = ""

client_certificate_config {
issue_client_certificate = false
}
}
}

resource "google_container_node_pool" "pool" {
name = "k8s-node-pool-${var.environment}"
location = "${var.zone}"
cluster = "${google_container_cluster.cluster.name}"
node_count = "${var.k8s_nodes}"

node_config {
preemptible = true
machine_type = "${var.instance_type}"

metadata {
disable-legacy-endpoints = "true"
}

oauth_scopes = [
"https://www.googleapis.com/auth/logging.write",
"https://www.googleapis.com/auth/monitoring",
]
}
}

Once the cluster is created, we will provision a new shell machine, and issue the below command to configure kubectl command-line tool to communicate with the cluster:

1
gcloud container clusters get-credentials CLUSTER_NAME --region REGION


Our image is stored in a private Docker repository. Hence, we need to generate credentials for K8s nodes to be able to pull the image from the private registry. Authenticate with the registry using docker login command. Then, create a Secret based on Docker credentials stored in config.json file (This file hold the authorization token)

1
2
3
4
5
docker login REGISTRY_URL -u USER -p PASSWORD

kubectl create secret generic nexus \
--from-file=.dockerconfigjson=/home/$USER/.docker/config.json \
--type=kubernetes.io/dockerconfigjson

Now we are ready to deploy our container:

1
2
3
4
5
6
7
8
9
10
11
12
13
14
15
16
17
18
19
20
21
22
apiVersion: apps/v1
kind: Deployment
metadata:
name: app
spec:
replicas: 1
selector:
matchLabels:
app: app
template:
metadata:
labels:
app: app
spec:
containers:
- name: app
image: registry.serverlessmovies.com/mlabouardy/app:latest
ports:
- containerPort: 3000
imagePullPolicy: Always
imagePullSecrets:
- name: nexus

To pull the image from the private registry, Kubernetes needs credentials. The imagePullSecrets field in the configuration file specifies that Kubernetes should get the credentials from a Secret named nexus.

Run the following command to deploy your application, listening on port 3000:

1
kubectl apply -f deployment.yml

By default, the containers you run on GKE are not accessible from the Internet, because they do not have external IP addresses. You must explicitly expose your application to traffic from the Internet. I’m going to use the LoadBalancer type service for this demo. But you are free to use whatever you like.

1
2
3
4
5
6
7
8
9
10
11
apiVersion: v1
kind: Service
metadata:
name: app
spec:
ports:
- port: 80
targetPort: 3000
selector:
app: app
type: LoadBalancer

Once you’ve determined the external IP address for your application, copy the IP address.


Point your browser to that URL to check if your application is accessible:


Finally, to automatically deploy our changes to K8s cluster, we need to update the cloudbuild.yaml file to add continuous deployment steps. We will apply a rolling update to the existing deployment with an image update:

1
2
3
4
5
6
7
8
9
10
11
12
13
14
15
16
17
18
19
20
21
22
23
24
25
26
27
- id: 'configure kubectl'
name: 'gcr.io/cloud-builders/gcloud'
env:
- 'CLOUDSDK_COMPUTE_ZONE=${_CLOUDSDK_COMPUTE_ZONE}'
- 'CLOUDSDK_CONTAINER_CLUSTER=${_CLOUDSDK_CONTAINER_CLUSTER}'
- 'KUBECONFIG=/kube/config'
entrypoint: 'sh'
args:
- '-c'
- |
gcloud container clusters get-credentials "$${CLOUDSDK_CONTAINER_CLUSTER}" --zone "$${CLOUDSDK_COMPUTE_ZONE}"
volumes:
- name: 'kube'
path: /kube

- id: 'deploy to k8s'
name: 'gcr.io/cloud-builders/gcloud'
env:
- 'KUBECONFIG=/kube/config'
entrypoint: 'sh'
args:
- '-c'
- |
kubectl set image deployment/app app=registry.serverlessmovies.com/mlabouardy/app:$SHORT_SHA
volumes:
- name: 'kube'
path: /kube

Test it out by pushing some changes to your repository, within a minute or two, it should get pushed to your live infrastructure.


That’s it! You’ve just managed to build a solid CI/CD pipeline in GCP for whatever your application code may be.

You can take this workflow further and use GitFlow branching model to separate your deployment environments to test new changes and features without breaking your production:


Drop your comments, feedback, or suggestions below — or connect with me directly on Twitter @mlabouardy.

Komiser:Multiple AWS Accounts Support

Releases keep rolling ! I’m thrilled to announce the release of Komiser:2.2.0 with support of multiple AWS accounts 🎊 🎉


But that’s not all, check the whole changelog to get an idea of the awesome work that has been done on this release. Lots of bugs have been fixed and we also have been working on adding amazing features.

Highlights

Komiser support multiple AWS accounts through named profiles that are stored in the config and credentials files. You can configure additional profiles by using aws configure with the --profile option, or by adding entries to the config and credentials files.

The following example shows a credentials file with 3 profiles (production, staging & sandbox accounts):

1
2
3
4
5
6
7
8
9
[Production]
aws_access_key_id=<AWS_ACCESS_KEY_ID>
aws_secret_access_key=<AWS_SECRET_ACCESS_KEY>
[Staging]
aws_access_key_id=<AWS_ACCESS_KEY_ID>
aws_secret_access_key=<AWS_SECRET_ACCESS_KEY>
[Sandbox]
aws_access_key_id=<AWS_ACCESS_KEY_ID>
aws_secret_access_key=<AWS_SECRET_ACCESS_KEY>

To enable multiple AWS accounts feature, add the multiple option to Komiser:

1
komiser start --port 3000 --redis localhost:6379 --duration 30 --multiple

If you point your browser to http://localhost:3000, you should be able to see your accounts


You can now analyze and identify potential cost savings on unlimited AWS environments (Production, Staging, Sandbox, etc) on one single dashboard.

The versioned documentation can be found on https://docs.komiser.io.

Komiser is written in Golang and is MIT licensed — contributions are welcomed whether that means providing feedback or testing existing and new features.


https://komiser.io

Drop your comments, feedback, or suggestions below — or connect with me directly on Twitter @mlabouardy.

Komiser:Detect potential cost savings on GCP

I’m super excited to annonce the release of Komiser:2.1.0 with beta support of Google Cloud Platform. You can now use one single open source tool to detect both AWS and GCP overspending.

Highlights


With the GDPR becoming real in EU, logging and storage of (potentially) personally identifiable information now need to be reduced in many organizations. Komiser allows you to analyze and manage cloud cost, usage, security, and governance in one place. Hence, detecting potential vulnerabilities that could put your cloud environment at risk.

It allows you also to control your usage and create visibility across all used services to achieve maximum cost-effectiveness and get a deep understanding of how you spend on the AWS, GCP and Azure.


Usage

Below are the available downloads for the latest version of Komiser (2.1.0). Please download the proper package for your operating system and architecture.

Linux:

1
wget https://cli.komiser.io/2.1.0/linux/komiser

Windows:

1
wget https://cli.komiser.io/2.1.0/windows/komiser

Mac OS X:

1
wget https://cli.komiser.io/2.1.0/osx/komiser

Note: make sure to add the execution permission to Komiser chmod +x komiser and update the user’s $PATH variable.

Komiser is also available as a Docker image:

Docker:

1
docker run -d -p 3000:3000 --name komiser mlabouardy/komiser:2.1.0

Note that we need to provide the three environment variables AWS_DEFAULT_REGION, AWS_ACCESS_KEY_ID and AWS_SECRET_ACCESS_KEY set in the container such as that the CLI can automatically authenticate with AWS.

Create a service account with Viewer permission, see Creating and managing service accounts docs.

Enable the below APIs for your project through GCP Console, gcloud or using the Service Usage API. You can find out more about these options in Enabling an API in your GCP project docs.

1
2
3
4
5
6
7
8
9
10
11
12
13
14
15
16
17
appengine.googleapis.com
bigquery-json.googleapis.com
compute.googleapis.com
cloudfunctions.googleapis.com
container.googleapis.com
cloudresourcemanager.googleapis.com
cloudkms.googleapis.com
dns.googleapis.com
dataflow.googleapis.com
dataproc.googleapis.com
iam.googleapis.com
monitoring.googleapis.com
pubsub.googleapis.com
redis.googleapis.com
serviceusage.googleapis.com
storage-api.googleapis.com
sqladmin.googleapis.com

To analyze and optimize the infrastructure cost, you need to export your daily cost to BigQuery, see Export Billing to BigQuery docs.

Provide authentication credentials to your application code by setting the environment variable GOOGLE_APPLICATION_CREDENTIALS:

1
export GOOGLE_APPLICATION_CREDENTIALS="[PATH]"

That should be it. Try out the following from your command prompt to start the server:

1
komiser start --port 3000 --dataset project-id.dataset-name.table-name

If you point your favorite browser to http://localhost:3000, you should see Komiser awesome dashboard:


The versioned documentation can be found on https://docs.komiser.io.

Komiser is written in Golang and is MIT licensed — contributions are welcomed whether that means providing feedback or testing existing and new features.


https://komiser.io

Drop your comments, feedback, or suggestions below — or connect with me directly on Twitter @mlabouardy.

Komiser:Optimize Cost and Security on AWS

Over the last decade, the cost of Amazon Web Services (AWS) has become a primary concern of businesses. That’s no surprise: AWS has many services that offer a range of IT resources — from IT infrastructure and bandwidth to analytics tools and machine learning — and each affects the total cloud bill.

While AWS offers many fully-managed services like CloudWatch, CloudTrail, Trusted Advisor, etc to help you detect potential cost savings. Understanding and managing cloud costs isn’t simple with AWS.

That’s why, I came up one year ago, with an open source tool called Komiser to help reduce your AWS infrastructure cost based on custom recommendations.

After 1 year of intense development, I’m thrilled to announce the fresh new release of Komiser: 2.0.0 with support of new AWS services:


AWS Services supported by Komiser

Highlights


With the GDPR becoming real in EU, logging and storage of (potentially) personally identifiable information now need to be reduced in many organizations. Komiser allows you to analyze and manage cloud cost, usage, security, and governance in one place. Hence, detecting potential vulnerabilities that could put your cloud environment at risk.

It allows you also to control your usage and create visibility across all used services to achieve maximum cost-effectiveness and get a deep understanding of how you spend on the AWS, GCP and Azure.


Usage

Below are the available downloads for the latest version of Komiser (2.0.0). Please download the proper package for your operating system and architecture.

Linux:

1
wget https://cli.komiser.io/2.0.0/linux/komiser

Windows:

1
wget https://cli.komiser.io/2.0.0/windows/komiser

Mac OS X:

1
wget https://cli.komiser.io/2.0.0/osx/komiser

Note: make sure to add the execution permission to Komiser chmod +x komiser and update the user’s $PATH variable.

Komiser is also available as a Docker image:

Docker:

1
docker run -d -p 3000:3000 --name komiser mlabouardy/komiser:2.0.0

If you point your favorite browser to http://localhost:3000, you should see Komiser awesome dashboard:


The versioned documentation can be found on https://docs.komiser.io.

Komiser is written in Golang and is MIT licensed — contributions are welcomed whether that means providing feedback or testing existing and new features.


https://komiser.io

Drop your comments, feedback, or suggestions below — or connect with me directly on Twitter @mlabouardy.

Ingest Data from RDS MySQL to Google BigQuery

In analytics, where queries over hundreds of gigabytes are the norm, performance is paramount and has a direct effect on the productivity of your team: running a query for hours means days of iterations between business questions. At Foxintelligence, we needed to move from traditional relational databases, like Postgres and MySQL to columnar database solutions. While RDBS like MySQL is great for normal transactional operations, it has significant drawbacks when it comes to real-time analytics on large amount of data. We found Google BigQuery to deliver superior results significantly for usability, performance, and cost for almost all our analytical use-cases, especially at scale.

Both Amazon RedShift and Google BigQuery provide much of the same functionalities, there are some fundamental differences between how these two operate. So you need to pick the right solution based on your data and business.

Once we decided which data warehouse we will use, we had to replicate data from RDS MySQL to Google BigQuery. This post walks you through the process of creating a data pipeline to achieve the replication between the two systems.

We used AWS Data Pipeline to export data from MySQL and feed it to BigQuery. The figure below summarises the entire workflow:


The pipeline starts based on a defined schedule and period, it launches a spot instance that will copy data from MySQL database to CSV files (split by table name) to an Amazon S3 bucket and then sending an Amazon SNS notification after the copy activity completes successfully. Following is our pipeline that accomplishes that:


Once the pipeline is finished, CSV files will be generated in the output S3 bucket:


The SNS notification will trigger a Lambda function, it will deploy a batch job based on a Docker image stored on our private Docker registry. The container will upload CSV files from S3 to GCS and load data to BigQuery:

You can use Storage Transfer Service to easily migrate your data from Amazon S3 to Cloud Storage.

1
2
3
4
5
6
7
8
9
10
11
12
13
14
15
16
17
18
19
20
21
22
23
24
25
26
27
28
29
30
31
32
33
34
#!/bin/bash

echo "Download BigQuery Credentials"

aws s3 cp s3://$GCP_AUTH_BUCKET/auth.json .

echo "Upload CSV to GCS"

mkdir -p csv
rm tables

for raw in $(aws s3 ls s3://$S3_BUCKET/ | awk -F " " '{print $2}');
do
table=${raw%/}
if [[ $table != "" && $table != df* ]]
then
echo "Table: $table"
csv=$(aws s3 ls s3://$S3_BUCKET/$table/ | awk -F " " '{print $4}' | grep ^ | sort -r | head -n1)

echo $table >> tables

echo "CSV: $csv"

echo "Copy csv from S3"
aws s3 cp s3://$S3_BUCKET/$table/$csv csv/$table.csv

echo "Upload csv to GCP"
gsutil cp csv/$table.csv gs://$GS_BUCKET/$table.csv
fi
done

echo "Import CSV to BigQuery"

python app.py

We have written a Python script to clean up raw data (encoding issues), transform (map MySQL data types to BQ data types) and load CSV file to BigQuery:

1
2
3
4
5
6
7
8
9
10
11
12
13
14
15
16
17
18
19
20
21
22
23
24
25
26
27
28
29
30
31
32
33
34
35
36
37
38
39
40
41
42
43
44
45
46
47
48
49
50
51
52
53
54
55
56
57
58
59
60
61
62
63
64
65
66
67
68
69
70
71
72
73
74
75
76
77
78
79
80
import mysql.connector
import os
import time
from mysql.connector import Error
from google.cloud import bigquery

bigquery_client = bigquery.Client()

def mapToBigQueryDataType(columnType):
if columnType.startswith('int'):
return 'INT64'
if columnType.startswith('varchar'):
return 'STRING'
if columnType.startswith('decimal'):
return 'FLOAT64'
if columnType.startswith('datetime'):
return 'DATETIME'
if columnType.startswith('text'):
return 'STRING'
if columnType.startswith('date'):
return 'DATE'
if columnType.startswith('time'):
return 'TIME'

def wait_for_job(job):
while True:
job.reload()
if job.state == 'DONE':
if job.error_result:
raise RuntimeError(job.errors)
return
time.sleep(1)

try:
conn = mysql.connector.connect(host=os.environ['MYSQL_HOST'],
database=os.environ['MYSQL_DB'],
user=os.environ['MYSQL_USER'],
password=os.environ['MYSQL_PWD'])
if conn.is_connected():
print('Connected to MySQL database')

lines = open('tables').read().split("\n")
for tableName in lines:
print('Table:',tableName)

cursor = conn.cursor()
cursor.execute('SHOW FIELDS FROM '+os.environ['MYSQL_DB']+'.'+tableName)

rows = cursor.fetchall()

schema = []
for row in rows:
schema.append(bigquery.SchemaField(row[0].replace('\'', ''), mapToBigQueryDataType(row[1])))


job_config = bigquery.LoadJobConfig()
job_config.source_format = bigquery.SourceFormat.CSV
job_config.autodetect = True
job_config.max_bad_records = 2
job_config.allow_quoted_newlines = True
job_config.schema = schema

job = bigquery_client.load_table_from_uri(
'gs://'+os.environ['GCE_BUCKET']+'/'+tableName+'.csv',
bigquery_client.dataset(os.environ['BQ_DATASET']).table(tableName),
location=os.environ['BQ_LOCATION'],
job_config=job_config)

print('Loading data to BigQuery:', tableName)

wait_for_job(job)


print('Loaded {} rows into {}:{}.'.format(
job.output_rows, os.environ['BQ_DATASET'], tableName))

except Error as e:
print(e)
finally:
conn.close()

As a result, the tables will be imported to BigQuery:


While this solution worked like a charm, we didn’t stop there. Google Cloud announced the public beta release of BigQuery Data Transfer. This service allows you to automates data movement from multiple data sources like S3 or GCS to BigQuery on a scheduled, managed basis. So it was a great use case to test this service to manage recurring load jobs from Amazon S3 into BigQuery as shown in the figure below:


This services comes with some trade-offs such as Google BigQuery cannot create tables as part of data transfer process. Hence, a Lambda function was used to drop the old dataset, and create the destination tables and their schema in advance of running the transfer. The function handler code is self-explanatory:

1
2
3
4
5
6
7
8
9
10
11
12
13
14
15
16
17
18
19
20
21
22
23
24
25
26
27
28
29
30
31
32
33
34
35
36
37
38
39
40
41
42
43
44
45
46
47
48
49
50
51
func handler(ctx context.Context) error {
client, err := bigquery.NewClient(ctx, os.Getenv("PROJECT_ID"))
if err != nil {
return err
}

err = RemoveDataSet(client)
if err != nil {
return err
}

err = CreateDataSet(client)
if err != nil {
return err
}

uri := fmt.Sprintf("%s:%s@tcp(%s)/%s",
os.Getenv("MYSQL_USERNAME"), os.Getenv("MYSQL_PASSWORD"),
os.Getenv("MYSQL_HOST"), os.Getenv("MYSQL_DATABASE"))

db, err := sql.Open("mysql", uri)
if err != nil {
return err
}

file, err := os.Open("tables")
if err != nil {
return err
}
defer file.Close()

scanner := bufio.NewScanner(file)
for scanner.Scan() {
tableName := scanner.Text()
fmt.Println("Table:", tableName)

columns, _ := GetColumns(tableName, db)
fmt.Println("Columns:", columns)

CreateBQTable(tableName, columns, client)
}

if err := scanner.Err(); err != nil {
return err
}
return nil
}

func main() {
lambda.Start(handler)
}

The function will be triggered by a CloudWatch Event, once the data pipeline finishes exporting CSV files:


Finally, we created Transfer jobs for each table on BigQuery to load data from S3 bucket to BigQuery table:


Using Google BigQuery to store internally hundreds of gigabytes of data (soon terabytes) with the capability to analyse it in few seconds give us a massive push toward business intelligence and data-driven insights.

Like what you’re read­ing? Check out my book and learn how to build, secure, deploy and manage production-ready Serverless applications in Golang with AWS Lambda.

Drop your comments, feedback, or suggestions below — or connect with me directly on Twitter @mlabouardy.

CI/CD for Android and iOS Apps on AWS

Mobile apps have taken center stage at Foxintelligence. After implementing CI/CD workflows for Dockerized Microservices, Serverless Functions and Machine Learning models, we needed to automate the release process of our mobile application — Cleanfox — to deliver features we are working on continuously and ensure high quality app. While the CI/CD concepts remains the same, its practicalities are somewhat different. In this post, I will walk you through how we achieved that, including the lessons learned and formed along the way to boost your Android and iOS application development drastically.


The Jenkins cluster (figure below) consists of a dedicated Jenkins master with a couple of slave nodes inside an autoscaling group. However, iOS apps can be built only on macOS machine. We typically use an unused Mac Mini computer located in the office devoted to these tasks.

We have configured the Mac mini to establish a VPN connection (at system startup) to the OpenVPN server deployed on the target VPC.


We setup an SSH tunnel to the Mac node using dynamic port forwarding. Once the tunnel is active, you can add the machine to Jenkins set of worker nodes:


This guide assumes you have a fresh install of the latest stable version of Xcode along with Fastlane.

Once we had a good part of this done, we used Fastlane to automate the deployment process. This tool offers a set of scripts written in Ruby to handle tedious tasks such as code signing, managing certificates and releasing ipa to the app store for the end users.

1
2
3
4
5
6
7
8
9
10
11
12
13
14
15
16
17
18
19
20
21
22
23
24
25
26
27
28
29
30
31
32
33
34
35
36
37
38
39
40
41
42
43
44
45
46
47
48
49
50
51
52
53
54
55
56
57
58
59
60
61
62
63
64
65
66
67
68
69
70
71
72
73
74
75
76
77
78
79
default_platform(:ios)

platform :ios do

lane :tests do
scan(
scheme: options[:scheme],
clean: true,
skip_detect_devices: true,
build_for_testing: true,
sdk: 'iphoneos',
should_zip_build_products: true
)
firebase_test_lab_ios_xctest(
gcp_project: 'cleanfox-XXXX',
devices: [
{
ios_model_id: 'ipadmini4',
ios_version_id: '12.0',
locale: 'fr_FR',
orientation: 'portrait'
},
{
ios_model_id: 'iphone7plus',
ios_version_id: '12.0',
locale: 'fr_FR',
orientation: 'portrait'
},
{
ios_model_id: 'iphone8',
ios_version_id: '12.0',
locale: 'fr_FR',
orientation: 'portrait'
},
{
ios_model_id: 'iphonexsmax',
ios_version_id: '12.0',
locale: 'fr_FR',
orientation: 'portrait'
}
]
)
end

lane :increment_build do
version = get_version_number
latestBuildNumber = latest_testflight_build_number(version: version)
increment_build_number(
build_number: latestBuildNumber + 1,
xcodeproj: "Cleanfox.xcodeproj"
)
end

lane :develop do
increment_build
build_app(scheme: "Sandbox",
workspace: "Cleanfox.xcworkspace",
include_bitcode: true)
end

lane :beta do
increment_build
build_app(scheme: "Staging",
workspace: "Cleanfox.xcworkspace",
include_bitcode: true)
upload_to_testflight
end

lane :prod_testflight do
increment_build_number(
build_number: latest_testflight_build_number + 1,
xcodeproj: "Cleanfox.xcodeproj"
)
build_app(scheme: "Production",
workspace: "Cleanfox.xcworkspace",
include_bitcode: true)
upload_to_testflight(skip_waiting_for_build_processing: true)
end
end

Also, we created a Jenkinsfile, which defines a set of steps (each step calls a certain actions — lane — defined in the above Fastfile) that will be executed on Jenkins based on the branch name (GitFlow model):

1
2
3
4
5
6
7
8
9
10
11
12
13
14
15
16
17
18
19
20
21
22
23
24
25
26
27
28
29
30
31
32
33
34
35
36
37
38
39
40
41
42
43
44
45
46
47
48
49
50
51
52
53
54
55
56
57
58
59
60
61
62
63
64
65
66
67
68
69
70
71
72
73
74
75
76
77
78
79
80
81
82
83
84
85
86
87
88
89
90
91
92
93
94
95
def bucket = 'mobile-artifacts-foxintelligence'

node('mac') {
try {
stage('Checkout') {
checkout scm
notifySlack('STARTED')
}

stage('Install Dependencies') {
sh "pod install"
}

stage('Build') {
if (env.BRANCH_NAME == 'master'){
sh "bundle exec fastlane prod_testflight"
}
if (env.BRANCH_NAME == 'preprod'){
sh "bundle exec fastlane staging"
}
if (env.BRANCH_NAME == 'develop'){
sh "bundle exec fastlane develop"
}
}

stage('Push') {
sh "aws s3 cp Cleanfox.ipa s3://${bucket}/ios/cleanfox-${commitID()}.ipa"

if (env.BRANCH_NAME == 'master'){
sh "aws s3 cp Cleanfox.ipa s3://${bucket}/ios/cleanfox-latest.ipa"
}
if (env.BRANCH_NAME == 'preprod'){
sh "aws s3 cp Cleanfox.ipa s3://${bucket}/ios/cleanfox-preprod.ipa"
}
if (env.BRANCH_NAME == 'develop'){
sh "aws s3 cp Cleanfox.ipa s3://${bucket}/ios/cleanfox-develop.ipa"
}
}

stage('Test') {
if (env.BRANCH_NAME == 'master'){
sh 'bundle fastlane tests --scheme "Production"'
}
if (env.BRANCH_NAME == 'preprod'){
sh 'bundle fastlane tests --scheme "Staging"'
}
if (env.BRANCH_NAME == 'develop'){
sh 'bundle fastlane tests --scheme "Sandbox"'
}
}
}catch(e){
currentBuild.result = 'FAILED'
throw e
}finally{
notifySlack(currentBuild.result)
}
}

def notifySlack(String buildStatus){
buildStatus = buildStatus ?: 'SUCCESSFUL'
def colorCode = '#FF0000'
def subject = "Name: '${env.JOB_NAME}'\nStatus: ${buildStatus}\nBuild ID: ${env.BUILD_NUMBER}"
def summary = "${subject}\nMessage: ${commitMessage()}\nAuthor: ${commitAuthor()}\nURL: ${env.BUILD_URL}"

if (buildStatus == 'STARTED') {
colorCode = '#546e7a'
} else if (buildStatus == 'SUCCESSFUL') {
colorCode = '#2e7d32'
} else {
colorCode = '#c62828c'
}

slackSend (color: colorCode, message: summary)
}

def commitAuthor(){
sh 'git show -s --pretty=%an > .git/commitAuthor'
def commitAuthor = readFile('.git/commitAuthor').trim()
sh 'rm .git/commitAuthor'
commitAuthor
}

def commitID() {
sh 'git rev-parse HEAD > .git/commitID'
def commitID = readFile('.git/commitID').trim()
sh 'rm .git/commitID'
commitID
}

def commitMessage() {
sh 'git log --format=%B -n 1 HEAD > .git/commitMessage'
def commitMessage = readFile('.git/commitMessage').trim()
sh 'rm .git/commitMessage'
commitMessage
}

The pipeline is divided into 5 stages:

  • Checkout: clone the GitHub repository.
  • Quality & Unit Tests: check whether our code is well formatted and follows Swift best practices and run unit tests.
  • Build: build and sign the app.
  • Push: store the deployment package (.ipa file) to an S3 bucket.
  • UI Test: launch UI tests on Firebase Test Lab across a wide variety of devices and device configurations.

If a build on the CI passes, a Slack notification will be sent (broken build will notify developers to investigate immediately).

Note the usage of the git commit ID as a name for the deployment package to give a meaningful and significant name for each release and be able to roll back to a specific commit if things go wrong.

Once the pipeline is triggered, a new build should be created as follows:


At the end, Jenkins will launch UI Tests based on XCTest framework on Firebase Test Lab across multiple virtual and physical devices and different screen sizes.


We gave a try to AWS Device Farm, but we needed to get over 2 problems at the same time. We sought waiting for a very short time, to receive tests result, without paying too much.

Test Lab exercises your app on devices installed and running in a Google data center. After your tests finish, you can see the results including logs, videos and screenshots in the Firebase console.


You can enhance the workflow to automate taking screenshots through fastlane snapshot command and saves hours of valuable time you’ll burn taking screenshots. To upload the screenshots, metadata and the IPA file to iTunes Connect, you can use deliver command, which is already installed and initialized as part of fastlane.

The Android CI/CD workflow is quite straightforward, as it needs only the JDK environment with Android SDK preinstalled, we are running the CI on a Jenkins slave deployed into an EC2 Spot instance. The pipeline contains the following stages:

1
2
3
4
5
6
7
8
9
10
11
12
13
14
15
16
17
18
19
20
21
22
23
24
25
26
27
28
29
30
31
32
33
34
35
36
37
38
39
40
41
42
43
44
45
46
47
48
49
50
51
52
53
54
55
56
57
58
59
60
61
62
63
64
65
def bucket = 'mobile-artifacts-foxintelligence'

node('android') {
try {
stage('Checkout') {
checkout scm
notifySlack('STARTED')
}

stage('Clean & Prepare') {
sh "./gradlew clean"
}

stage('Quality Tests') {
sh "./gradlew lintDebug"
androidLint pattern: 'app/build/reports/lint-results-debug.xml'
}

stage('Unit Tests') {
sh "./gradlew testDebug --stacktrace"

if (env.BRANCH_NAME == 'master'){
sh "./gradlew testReleaseUnitTest"
}
if (env.BRANCH_NAME == 'preprod'){
sh "./gradlew testStagingUnitTest"
}
if (env.BRANCH_NAME == 'develop'){
sh "./gradlew testSandboxUnitTest"
}

publishHTML([reportDir: 'app/build/reports/tests/testDebugUnitTest', reportFiles: 'index.html', reportName: 'Unit Tests Report'])

junit 'app/build/test-results/testDebugUnitTest/*.xml'
}

stage('Build'){
sh "./gradlew assembleDebug"

if (env.BRANCH_NAME == 'master'){
sh "./gradlew compileReleaseKotlin"
}
if (env.BRANCH_NAME == 'preprod'){
sh "./gradlew compileStagingKotlin"
}
if (env.BRANCH_NAME == 'develop'){
sh "./gradlew compileSandboxKotlin"
}
}

stage('Push'){
sh "aws s3 cp app/build/outputs/apk/debug/app-debug.apk s3://${bucket}/android/${commitID()}.apk"
}

stage('UI Tests'){
sh "./gradlew assembleDebugAndroidTest"
sh "gcloud firebase test android run --app app/build/outputs/apk/debug/app-debug.apk --test app/build/outputs/apk/androidTest/debug/app-debug-androidTest.apk"
}
}catch(e){
currentBuild.result = 'FAILED'
throw e
}finally{
notifySlack(currentBuild.result)
}
}

The pipeline could be drawn up as the following steps:

  • Check out the working branch from a remote repository.
  • Run the code through lint to find poorly structured code that might impact the reliability, efficiency and make the code harder to maintain. The linter will produces XML files which will be parsed by the Android Lint Plugin.
  • Launch Unit Tests. The JUnit plugin provides a publisher that consumes XML test reports generated and provides some graphical visualization of the historical test results as well as a web UI for viewing test reports, tracking failures, and so on.


  • Build debug or release APK based on the current Git branch name.
  • Upload the artifact to an S3 bucket.
  • Similarly, after the instrumentation tests have finished running, the Firebase web UI will then display the results of each test — in addition to information such as a video recording of the test run, the full Logcat, and screenshots taken:


To bring down testing time (and reduce the cost), we are testing Flank to split the test suite into multiple parts and execute them in parallel across multiple devices.

Our Continuous Integration workflow is sailing now. So far we’ve found that this process strikes the right balance. It automates the repetitive aspects, provides protection but is still lightweight and flexible. The last thing we want is the ability to ship at any time. We have an additional stage to upload the iOS artifact to Test Flight for distribution to our awesome beta tests.

Like what you’re read­ing? Check out my book and learn how to build, secure, deploy and manage production-ready Serverless applications in Golang with AWS Lambda.

Drop your comments, feedback, or suggestions below — or connect with me directly on Twitter @mlabouardy.

Your browser is out-of-date!

Update your browser to view this website correctly. Update my browser now

×